Abstract
For more than 30 years, the fundamental goal in molecular motility has been to resolve force-generating motor protein structural changes. Although low-resolution structural studies have provided evidence for force-generating myosin rotations upon muscle activation, these studies did not resolve structural states of myosin in contracting muscle. Using electron paramagnetic resonance, we observed two distinct orientations of a spin label attached specifically to a single site on the light chain domain of myosin in relaxed scallop muscle fibers. The two probe orientations, separated by a 36° ± 5° axial rotation, did not change upon muscle activation, but the distribution between them changed substantially, indicating that a fraction (17% ± 2%) of myosin heads undergoes a large (at least 30°) axial rotation of the myosin light chain domain upon force generation and muscle contraction. The resulting model helps explain why this observation has remained so elusive and provides insight into the mechanisms by which motor protein structural transitions drive molecular motility.
Muscle contraction results from the relative sliding between actin and myosin filaments, and most models suggest that filament sliding is driven by a large structural change of actin-bound myosin heads, usually depicted as an axial rotation on the order of 45° (1–3). However, resolving distinct myosin structural states in muscle has been difficult, because active muscle contains a heterogeneous population of myosin heads, each independently cycling through different structural states. Changes in x-ray diffraction (4), birefringence (5), electron microscopy (6), and fluorescence (7) upon muscle contraction are consistent with myosin head motions, but evidence for distinct myosin orientational states has not been provided by these techniques, suggesting that either distinct orientations do not exist or these techniques have insufficient orientational resolution to detect them.
Electron paramagnetic resonance (EPR) has the orientational resolution needed to detect multiple orientations of nitroxide spin labels, because each spin label orientation corresponds to a unique splitting between the three narrow spectral lines. Therefore, by covalently attaching a spin label to a specific site on myosin in muscle and orienting the muscle fiber in the magnetic field, myosin orientations with respect to the fiber axis can be determined. Multiple orientations of myosin in muscle, as well as the degree of disorder about those orientations, can be determined by resolving the spectrum of an oriented fiber into a sum of spectra with different splittings (8).
Previous EPR studies revealed two structural states of the spin-labeled catalytic domain, the globular region of myosin that regulates actin–myosin crossbridges through ATP binding and hydrolysis. These structural states are characterized by a single orientation in the strong-binding biochemical states (high actin affinity) and microsecond dynamic disorder in the weak-binding biochemical states (low actin affinity). A small fraction (20%) of myosin heads was observed to undergo a disorder-to-order transition of the catalytic domain upon muscle activation (9–14), suggesting that only a small fraction of myosin heads is well oriented, strongly bound, and generating force during muscle contraction. The disorder-to-order transition of the catalytic domain suggested that any distinct rotation of the myosin head must occur in the myosin LC domain (15, 16), a long (85Å) heavy-chain α-helix with bound regulatory and essential light chains (17). Biochemical (18, 19), structural (17, 20–22), and spectroscopic (13, 16, 23, 24) data support this model, suggesting that the light chain (LC) domain might rotate as a rigid lever arm while the catalytic domain remains rigidly bound to actin.
To test this model, spectroscopic studies have recently focused on probes attached specifically to the regulatory light chain (RLC) of the LC domain in muscle fibers. In most of these studies, considerable disorder was reported, two distinct probe angles were not resolved, and little or no orientational change was detected upon contraction (24–27). In fluorescence polarization studies, the reported disorder could be the result of a broad distribution among multiple LC domain probe orientations that are simply unresolved by this technique. Furthermore, previous studies have used rabbit muscle preparations that require harsh RLC-exchange conditions and result in less than 50% exchange in fibers, with little or no characterization of the functional incorporation of RLCs. Therefore, disorder of the LC domain probes may arise from nonfunctional heads or nonspecifically bound RLCs. In scallop muscle, nearly complete RLC exchange is achieved under milder conditions, and the strong dependence of Ca sensitivity on the RLC permits a quantitative measure of functional RLC binding (28). Therefore, to resolve the structural states of the myosin LC domain in functioning muscle, we have performed EPR experiments on spin-labeled RLC in scallop muscle fibers.
MATERIALS AND METHODS
Labeled Regulatory Light Chains.
We used myosin RLC from smooth muscle because it contains a single Cys that ensures specific spin-labeling and has been shown to restore Ca-sensitive function in scallop muscle when exchanged with native RLC (28). RLC was purified from chicken gizzard myosin (29) and labeled with a cysteine-specific spin probe, 3-(5-fluoro-2,4-dinitroanilino)-2,2,5,5-tetramethyl-1-pyrrolidinyloxy (FDNASL), by incubation with 2.5-fold molar excess FDNASL (pH 7, 4°C) for 20 hr. The spin/protein ratio was 0.9 ± 0.1 (n = 7), indicating complete and specific reaction with the single thiol on Cys-108. Unless otherwise indicated, all uncertainties are SEM.
RLC-Exchanged Scallop Fiber Bundles.
Skinned fiber bundles, approximately 0.25 mm in diameter, were prepared from scallop (Placopecten magellanicus) adductor muscle (30) without Triton treatment (control). Native RLC was removed by perfusing buffer A (40 mM NaCl/0.1 mM NaN3/10 mM Mops, pH 7) plus 15 mM EDTA over fibers at 26°C for 1 hr (extracted). These fibers were then incubated in buffer A plus 2 mM MgCl2 and 2 mg/ml spin-labeled RLC for 2 hr on ice, and finally perfused with buffer A plus 2 mM MgCl2 for 15 min (labeled). To obtain fibers in which most myosin molecules had labeled RLC on only one head and no RLC on the other, resulting in constitutive (Ca-independent) activation, fibers were extracted at 10°C for 30 min (removing about half the RLC), labeled, and extracted at 26°C for 1 hr (28, 31) to remove the remaining native RLC; chicken gizzard RLC is not removed by this treatment.
Minced fibers were prepared by cutting fibers with small scissors. Myofibrils were prepared by homogenizing minced fibers with a tissumizer. Minced fibers or myofibrils were placed in a flat sample cell or a capillary. ATP was introduced by photolysis of caged ATP in the flat cell (32) or by perfusion of ATP-containing buffer through a capillary with the sample trapped by glass wool.
RLC-Exchanged Rabbit Psoas Muscle Fiber Bundles.
Bundles of rabbit psoas muscle fibers were dissected from glycerinated muscle strips (33). Native RLC was removed (<30%) by perfusing the fibers with extraction buffer (20 mM imidazole/20 mM KCl/5 mM EDTA/5 mM CDTA/2 mM EGTA/0.1 mM NaN3/15 mM trifluoperazine, pH 6.7) plus 0.05% Triton for 15 min and without Triton for 105 min at 10°C (extracted). Extracted fibers were incubated in rigor buffer (130 mM KPr/20 mM Mops/6 mM MgCl2/1 mM EGTA/0.1 mM NaN3, pH 7) with 1.7 mg/ml spin-labeled RLC and 0.2 mg/ml troponin C for 5 hr on ice, then perfused with rigor buffer for 15 min.
EPR Acquisition and Analysis.
High-resolution detection of the LC domain probe orientation was obtained from EPR spectra of these fiber bundles during continuous perfusion. X-band EPR spectra were acquired at 25°C as previously described (13). Spectral simulations and nonlinear least-squares fits were performed on a Cray-C916 by using the program amoeba (34), extended and rewritten by Edmund C. Howard.
Buffers.
Rigor buffer contained 20 mM Mops, 5 mM MgCl2, 1 mM EGTA, and 0.1 mM NaN3. Relaxation and contraction buffers contained, in addition, 5 mM ATP, 20 mM creatine phosphate, and 0.25 mg/ml creatine phosphokinase; in contraction, pCa was 4.0. Ionic strength was adjusted to 200 mM with potassium propionate, and pH was adjusted to 7.0 with potassium hydroxide.
RESULTS
Scallop Fiber Characterization.
In scallop muscle, Ca sensitivity of tension and ATPase activity provide a quantitative measure of the extent and specificity of RLC removal and reincorporation (Table 1). Seventy-five percent of the RLCs were removed, and RLC reincorporation was complete, specific, and functional, as evidenced by gel electrophoresis and Ca sensitivity. This preparation has three major advantages over previous LC domain spectroscopic studies: (i) most heads are labeled, (ii) the fraction of nonspecifically bound RLCs is small (<5%), and (iii) most probed RLCs are functionally incorporated.
Table 1.
Characterization of scallop muscle fiber bundles
| Fiber preparation | Total RLC/ELC (±SEM) | Tension Ca sensitivity* (±SEM) | Myofibril ATPase Ca sensitivity* (±SD) |
|---|---|---|---|
| Control | 0.87 ± 0.03 | 0.95 ± 0.01 | 0.97 ± 0.01 |
| (n = 14) | (n = 23) | (n = 6) | |
| Extracted | 0.21 ± 0.02 | 0.13 ± 0.19 | 0.28 ± 0.07 |
| (n = 16) | (n = 7) | (n = 4) | |
| Labeled | 0.86 ± 0.05 | 0.91 ± 0.06 | 0.93 ± 0.02 |
| (n = 13) | (n = 17) | (n = 6) |
Isometric tension and myofibril ATPase were measured (35) under EPR relaxation and contraction conditions. Ca sensitivity is [1 − (relaxation/contraction)]. Active tension was similar for control and labeled fibers and was in the range of 1–2.5 N/cm2, as previously reported for scallop fiber bundles (30). The essential light chain (ELC) is not removed by the extraction procedure, so the ratio of RLC/ELC, determined from urea/polyacrylamide gels, reflects the RLC content.
The LC Domain Orientation Is Sensitive to the Physiological State in Muscle.
EPR spectra of these fibers are highly sensitive to the fiber’s orientation in the magnetic field (Fig. 1), showing that the probes and, therefore, the LC domains to which they are bound, have substantial orientational order in muscle. Significant spectral differences among the physiological states of rigor (no ATP), relaxation (ATP), and contraction (ATP + Ca) are observed in oriented fibers (Fig. 1) but not in randomly oriented fibers (Fig. 2), showing that essentially all of the observed spectral changes are the result of reorientation of the LC domain probe relative to the fiber axis.
Figure 1.
EPR spectra of oriented fibers. Spectra shown (from top, down) are fibers in rigor, relaxation, and contraction. The significant difference between the spectra of fibers oriented parallel (black) and perpendicular (gray) to the magnetic field shows that the probes are well ordered in all three physiological states.
Figure 2.
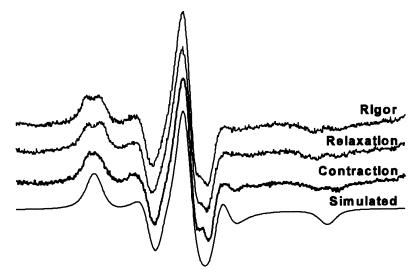
EPR spectra of randomly oriented fibers. Spectra shown (from top, down) are fibers in rigor, relaxation, contraction, and simulation of the best fit to the rigor experimental spectrum. The simulated spectrum has a Lorentzian line width of 2.2 G, Gaussian line width of 2.8 G, anisotropic T values Tzz = 29.9 G, Tyy = 9.8 G, and Txx = 8.3 G, and g values gxx = 2.0072, gyy = 2.0068, and gzz = 2.0035.
The spectrum of randomly oriented fibers in rigor (Fig. 2 Upper) was fit to a spectrum simulated from a random orientational distribution (Fig. 2 Lower) to determine the orientation-independent parameters (Fig. 2, legend) used in analyzing spectra of oriented samples. The imperfect fit suggests that probe motion and local environment have subtle effects on certain spectral features. However, these small deviations in spectral features do not significantly affect the subsequent analysis, which focuses on the dramatic changes in spectral line splittings (Fig. 3) that are the result of large orientational changes of well defined effective probe axes (36). More complex models, such as allowing two different values of Tzz, improved the fits to the spectra in Fig. 2, but had no significant effect on the conclusions about probe orientation.
Figure 3.
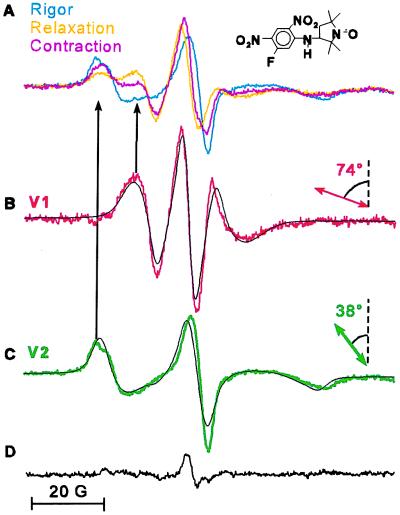
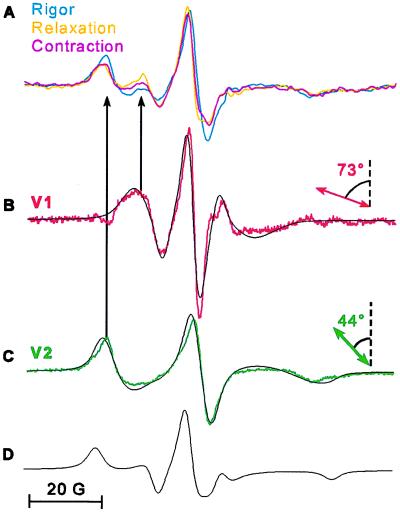
Two resolved orientational components derived from EPR spectra of spin-labeled scallop muscle fibers. (A) Spectra overlaid in rigor (cyan), relaxation (orange), and contraction (magenta). (B and C) Resolved spectral components V1 (red) and V2 (green) were obtained by subtraction of rigor and relaxation spectra, yielding unique endpoints (9). Each of the black spectra in B and C is the best-fit simulation (34) to a single, oriented population of the probe’s principal axis (double-headed arrow) with respect to the fiber axis (vertical, dashed line). The residual spectrum (D) shows the small difference between the contraction spectrum and a linear combination of V1 and V2 (Eq. 1, x1 = 0.33, x2 = 0.67).
Two Distinct Spectral (Orientational) Components.
EPR spectra of oriented fibers in rigor, relaxation, and contraction show different relative intensities of two distinct components, shown clearly by the two peaks of the low-field spectral lines (Fig. 3A, black arrows). We show below that these two components correspond to two orientational probe populations, so the spectral line intensities correspond to the mole fractions of these two populations. Digital subtraction of any two experimental spectra unambiguously resolved the same two distinct spectral components, V1 and V2, which were uniquely simulated (as discussed below) as two distinct Gaussian populations having central angles, θ1 and θ2, of 74° and 38° with respect to the fiber axis (Fig. 3 B and C).
Therefore, the spectra in all three physiological states are uniquely and completely described by different linear combinations of the same two distinct spectral components (Fig. 3):
 |
1 |
corresponding to two distinct orientational populations (Fig. 4):
 |
2 |
where x1 and x2 are mole fractions (x1 + x2 = 1), H is magnetic field strength, and θ is the probe’s tilt from the fiber axis.
Figure 4.
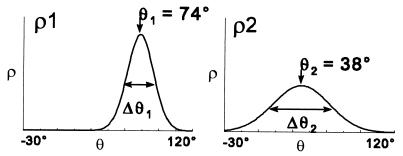
Gaussian orientational distribution for each component determined by fitting EPR spectral components V1 and V2 (Fig. 3) to simulated spectra corresponding to ρi(θ) = exp − {(ln2)[(θ − θi)/(Δθi/2)]2}/∫(ρi(θ)sinθdθ).
An exact fit of the low-field peak is complicated by a slight spectral shoulder. This spectral feature is also observed in the absence of fiber orientation (Fig. 2) and therefore is an effect of the local probe environment. Although we cannot rule out the possibility that this shoulder or other small variations in the shape of spectral lines represent subpopulations within ρ1 or ρ2, the small residual in Fig. 3D indicates that differences among or transitions between any subpopulations are small compared with the large angle difference between the two main populations (36°) and the significant population shift between them.
Quantitative Analysis of the Two Orientational Populations.
Multiple splittings in an EPR spectrum are easily resolved into distinct spectral components (Fig. 3) because of the high orientational resolution of EPR. Because EPR spectra are well defined by basic physical principles, each spectral component can be quantitatively described through computer simulations as a distinct orientational population of the probe.
In all simulations, each orientational population was assumed to have a Gaussian distribution, ρi, with a central angle θi and a full width at half-maximum of Δθi (Fig. 4). A single Gaussian distribution gave a poor fit to the spectra in relaxation and contraction, but gave a good fit to each of the resolved spectral components V1 and V2. For each spectral component, Vi, both θi and Δθi were varied until the best fit was obtained. V1 (Fig. 3B) was best fit by a distribution ρ1 with θ1 = 74° ± 3° and Δθ1 = 24° ± 2°, and V2 (Fig. 3C) was best fit by a distribution ρ2 with θ2 = 38° ± 4° and Δθ2 = 49° ± 4° (Fig. 4). The difference between the two angles, θ1 − θ2, is 36° ± 5°. Similar results were obtained by fitting each of the spectra in Fig. 3A to a sum of two Gaussian distributions.
Distribution Between the Two Orientational Populations.
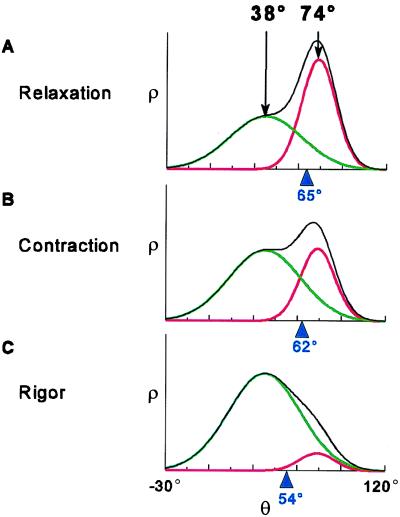
For each physiological state, the relative contributions of V1 and V2 to the experimental spectrum, V, determine the mole fractions, x1 and x2, of the two populations in that state (Eqs. 1 and 2). In relaxation (Fig. 5A), ρ1 and ρ2 are equally populated (x2 = 0.50 ± 0.02, n = 24). Calcium activation (contraction, Fig. 5B) moderately increases the fraction of ρ2 (x2 = 0.67 ± 0.03, n = 17), whereas ATP removal (Fig. 5C, rigor) results in a dramatic increase in ρ2 (x2 = 0.92 ± 0.02, n = 24).
Figure 5.
The overall angular distribution ρ(θ) (Eq. 1, plotted in black), of spin-labeled LC domain in scallop fibers for different physiological states, showing contributions from the two oriented components, ρ1 (red) and ρ2 (green), as determined from the EPR spectra in Fig. 2. The average value of θ for the overall distribution, 〈θ〉 = ∫θsin(θ)ρ(θ)dθ, is indicated in blue. (A) Relaxation: ρ1 and ρ2 are both populated. (B) Contraction: the distribution shifts toward ρ2. (C) Rigor: ρ2 is predominant.
Without the high orientational resolution of EPR, changes in the complex shape of the overall distribution (Fig. 5, black) might mistakenly be approximated by a variety of models, the simplest being a small change in the average angle (Fig. 5, blue marker) of a single population. Although the difference between the central angles of the two populations is large (36° ± 5°), muscle activation (contraction) shifts only a fraction (17% ± 2%) of the heads from ρ1 to ρ2, resulting in a small change (≈3°) in the average probe angle.
Rotation Correlates with Force.
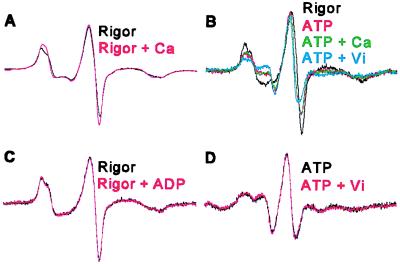
The nearly complete and fully functional RLC exchange possible in scallop make it the ideal muscle for this study, but scallop’s myosin-based Ca regulation raises the possibility that the observed LC domain probe rotation is a local change. We exclude this possibility, because addition of Ca to rigor fibers had no significant effect on the distribution (Fig. 6A), and the fraction of the 38° population in relaxation (x2 = 0.50) was increased not only by Ca-activation and ATP removal (Fig. 3), but also by partial depletion of the RLCs (x2 = 0.60 ± 0.02, n = 3) (Fig. 6B), which activates scallop muscle even in the absence of Ca.
Figure 6.
Controls. (A) Addition of calcium to rigor had no significant effect on the spectrum. (B) Partially extracted fibers, which are activated by ATP with or without calcium, show essentially the same spectra as unextracted fibers that have been Ca-activated. On addition of vanadate, the overall distribution shifts toward that of relaxation. (C) Addition of ADP to rigor and (D) addition of vanadate to relaxation had little effect on the original spectrum.
LC domain probe rotations between rigor and relaxation and between relaxation and contraction (with and without calcium) show that transitions between the two structural states are coupled to transitions between the weak- and strong-binding states, two generalized biochemical states characterized by different myosin affinities for actin (37). However, transitions among strong-binding states (addition of 5 mM MgADP, Fig. 6C, or 0.1 mM free Ca2+ to rigor, Fig. 6A) or among weak-binding states (addition of 5 mM vanadate to relaxation, Fig. 6D) had no significant effect on either component (±1°) or the mole fraction (<3%). This suggests that the strong-binding states are predominantly the 38° population, ρ2, and that all weak-binding states have approximately equal fractions of the two oriented populations, ρ1 and ρ2.
Two LC Domain Probe Populations in Skeletal Muscle.
To test the generality of our results, we repeated these experiments on rabbit skeletal muscle fibers, which are actin-filament regulated. We resolved two distinct spectral components (Figs. 7 B and C) from EPR spectra of fibers in rigor, relaxation, and contraction (Fig. 7A), which were then simulated as two LC domain probe orientational populations similar to those in scallop.
Figure 7.
EPR spectra of spin-labeled rabbit muscle fibers. (A) Spectra overlaid in rigor (cyan), relaxation (orange), and contraction (magenta). (B and C) Orientational components V1 (red) and V2 (green) were obtained as in Fig. 2, with the additional subtraction of up to 40% of a powder spectrum (D). Black spectra in B and C are the best-fit simulations of Gaussian distributions centered at 73 ± 5° and 44 ± 5° with full width at half-maximum of 24 ± 5° and 40 ± 5°, respectively.
However, in contrast to scallop muscle, a disordered population was required to completely describe the experimental spectra of all three physiological states (Fig. 7D) and, upon activation, the shift from ρ1 to ρ2 was almost undetectable (<4%).
The disordered spectral component suggests the presence of nonspecifically bound RLCs (38), whereas the slight population shift on activation suggests that either a relatively small fraction of heads rotate, or predominantly unlabeled heads rotate in rabbit. Current preparations of probed-RLC rabbit fibers have less than 50% of the myosin heads labeled with no measure of functional incorporation. These preparations will need to be improved before we can determine whether the differences between rabbit and scallop data are significant. Nevertheless, these results clearly show that two distinct LC domain probe orientations exist in rabbit muscle that are remarkably similar to those observed in scallop.
DISCUSSION
Because most of the myosin heads in our experiments are specifically and functionally labeled with probes that are well oriented on the LC domain, EPR will detect small (<2°) axial rotations of the LC domain, and therefore this study directly tests the prediction of LC domain rotation.
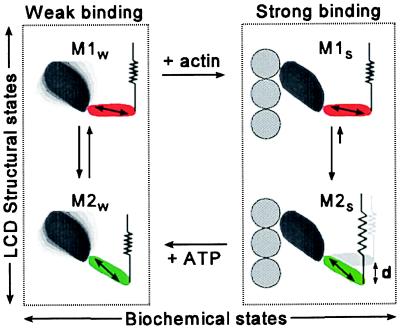
The two distinct EPR spectral components, V1 and V2 (Fig. 3), clearly indicate two distinct probe populations, ρ1 and ρ2 (Fig. 4), corresponding to two distinct LC domain structural states. Control experiments indicate that the probe orientations, θ1 and θ2, in these two states are invariant with respect to changes in the physiological state, and that the mole fractions of these structural states change only in response to a change in the balance between weak and strong actin-binding states. These results show clearly that changes at the actomyosin interface induce a change in the distribution of LC domain structural states. The most likely interpretation is that these structural states correspond to two orientations of the LC domain. Therefore, we propose that the two orientational populations, ρ1 and ρ2, represent two distinct myosin structures, M1 and M2 (Fig. 8), with LC domains axially separated by 36° ± 5°. This axial separation of the two LC domain structures could be even greater than 36° if the probe’s principal axis is not in the plane of axial rotation, or if the two LC domain orientations are on opposite sides of the 90° plane of fiber symmetry (24).
Figure 8.
A myosin crossbridge model. Force is generated upon the transition from weak (Left) to strong (Right) actin binding, which is coupled to a change in the distribution between two myosin head structures, M1 and M2, having LC domain orientations that differ by at least 36°. The stretched spring (Right Lower) indicates that force has been produced and does not necessarily correspond to a specific structural feature.
Evidence for two LC domain orientations has been reported previously in studies of isolated myosin heads (S1) bound to actin. EPR (22) and electron microscopy reconstructions (21, 39) of S1-decorated actin filaments have shown ADP-induced transitions between two distinct LC domain orientations. However, these transitions are not directly related to force generation in muscle, because in those experiments S1 was unstrained and not mechanically coupled to the myosin filament, and the structural changes were observed for S1 from nonmuscle and smooth muscle myosin but not for S1 from striated muscle. Furthermore, ADP has little or no effect on force in rigor muscle (40) and ADP has no effect on LC domain probe orientation in scallop muscle (Fig. 6C).
A 36° rotation of the LC domain is consistent with other observed force-generating myosin transitions. In vitro motility assays have shown 5- to 10-nm myosin step sizes (41, 42) that can be explained by a 30–40° rotation of a 10-nm LC domain. Fluorescence polarization studies (7, 24) have shown a correlation between a small change (≤3°) in the average LC domain angle and force. Our results show a similar change in average angle (3°, Fig. 5) upon muscle contraction, but EPR clearly resolves this as a small change in the mole fractions of M1 and M2 rather than a small change in the actual orientation of the LC domain.
The present study significantly extends previous studies by (i) resolving two distinct myosin structures in intact muscle fibers, (ii) showing that both structures are present in all physiological states, and (iii) detecting a small fraction of myosin heads that shift between the two structures upon muscle activation.
Fig. 8 shows the observed coupling between the generalized biochemical states (weak- and strong-binding) and the structural states of both the catalytic domain (disordered and ordered) and the LC domain (M1 and M2). In rigor, only the strong-binding biochemical state is populated and the structural state of myosin is characterized by the ordered catalytic domain and the M2 LC domain orientation. In relaxation only the weak-binding biochemical state is populated and the structural state of myosin is characterized by a dynamically disordered catalytic domain (11, 14) and both M1 and M2 LC domain orientations. Upon muscle activation a fraction (10–20%) of myosin heads (i) shifts from the weak- to strong-binding states (43), (ii) shifts from the disordered to ordered catalytic domain structure (9, 11), and (iii) shifts from the M1 to M2 LC domain orientation.
In the weak-binding state, the catalytic domain is disordered and interacts weakly with actin, so the two LC domain orientations, M1 and M2, are probably ordered by interactions with the core of the myosin filament. If the M2 LC domain structure is stabilized when the catalytic domain binds strongly to actin, myosin heads with the M1 orientation would rotate more than 30° to M2 on muscle activation, resulting in filament sliding and force generation. A cycle is easily established if ATP binds preferentially to the M2S structural state, which would occur if the transition from M1S to M2S is coupled to a product-release step or is faster than the rate of ADP release. On ATP binding, the myosin head returns to the weak-binding state, where the myosin filament core reprimes the myosin head by reestablishing the equal distribution between M1 and M2.
Our results indicate why the observation of LC domain rotation on contraction has been so elusive. Techniques that are sensitive to the mass of the entire head do not resolve these two structures, because the massive catalytic domain is dynamically disordered most of the time and undergoes no distinct rotation (9, 10). Therefore, it is essential to monitor the small mass of the LC domain. Furthermore, only a small fraction of heads rotates between two distinct but partially disordered LC domain orientations, so a technique with high orientational resolution is essential for detecting these two orientations and the transitions between them.
Because EPR has the necessary specificity and resolution, we have detected two LC domain orientations axially separated by at least 30°. The distribution between these two myosin structures is modulated primarily by the force-generating, weak-to-strong actin-binding transition and is not tightly coupled to ATP binding or hydrolysis, showing that 17 ± 2% of the heads rotate by at least 30° upon muscle contraction. The implications of these results support a new framework for exploring energy transduction systems, in which molecular engines work by modulating a distribution between existing structural states through ligand binding and protein–protein interactions, rather than driving new structures that are directly coupled to the bound ligand (44).
Acknowledgments
We thank Dr. Albert Gordon for providing us with troponin C; Edmund C. Howard and David W. Hayden for assistance with spectroscopic simulations; Dr. Osha Roopnarine for initiating the study of scallop muscle and spin-labeled RLC in this laboratory; and Nicholas J. Meyer, Cheryl A. Miller, and Dr. John J. Matta for their excellent technical assistance. This work was supported by grants from the Muscular Dystrophy Association, the National Institutes of Health (AR32961), and the Minnesota Supercomputer Institute. I.B.M., J.B., and L.E.W.L. were supported by a National Science Foundation training grant. S.R. was supported by a Muscular Dystrophy Association postdoctoral fellowship.
Footnotes
This paper was submitted directly (Track II) to the Proceedings Office.
Abbreviations: EPR, electron paramagnetic resonance; FDNASL, 3-(5-fluoro-2,4-dinitroanilino)-2,2,5,5-tetramethyl-1-pyrrolidinyloxy; LC, light chain; RLC, regulatory LC.
A commentary on this article begins on page 2720.
References
- 1.Huxley H E. Science. 1969;164:1356–1366. [PubMed] [Google Scholar]
- 2.Huxley A F. J Physiol (London) 1974;243:1–42. [PMC free article] [PubMed] [Google Scholar]
- 3.Lymn R W, Taylor E W. Biochemistry. 1971;10:4617–4624. doi: 10.1021/bi00801a004. [DOI] [PubMed] [Google Scholar]
- 4.Huxley H E, Simmons R M, Faruqi A R, Kress M, Bordas J, Koch M H J. J Mol Biol. 1983;169:469–506. doi: 10.1016/s0022-2836(83)80062-x. [DOI] [PubMed] [Google Scholar]
- 5.Irving M. J Physiol (London) 1993;472:127–156. doi: 10.1113/jphysiol.1993.sp019940. [DOI] [PMC free article] [PubMed] [Google Scholar]
- 6.Hirose K, Lenart T D, Murray J M, Franzini-Armstrong C, Goldman Y E. Biophys J. 1993;65:397–408. doi: 10.1016/S0006-3495(93)81061-0. [DOI] [PMC free article] [PubMed] [Google Scholar]
- 7.Ling N, Shrimpton C, Sleep J, Kendrick-Jones J, Irving M. Biophys J. 1996;70:1836–1846. doi: 10.1016/S0006-3495(96)79749-7. [DOI] [PMC free article] [PubMed] [Google Scholar]
- 8.Thomas D D, Cooke R. Biophys J. 1980;32:891–906. doi: 10.1016/S0006-3495(80)85024-7. [DOI] [PMC free article] [PubMed] [Google Scholar]
- 9.Cooke R, Crowder M S, Thomas D D. Nature (London) 1982;300:776–778. doi: 10.1038/300776a0. [DOI] [PubMed] [Google Scholar]
- 10.Barnett V A, Thomas D D. Biophys J. 1989;56:517–523. doi: 10.1016/S0006-3495(89)82698-0. [DOI] [PMC free article] [PubMed] [Google Scholar]
- 11.Berger C L, Thomas D D. Biophys J. 1994;67:250–261. doi: 10.1016/S0006-3495(94)80476-X. [DOI] [PMC free article] [PubMed] [Google Scholar]
- 12.Raucher D, Fajer P G. Biochemistry. 1994;33:11993–11999. doi: 10.1021/bi00205a039. [DOI] [PubMed] [Google Scholar]
- 13.Roopnarine O, Thomas D D. Biophys J. 1995;68:1461–1471. doi: 10.1016/S0006-3495(95)80319-X. [DOI] [PMC free article] [PubMed] [Google Scholar]
- 14.Thomas D D, Ramachandran S, Roopnarine O, Hayden D W, Ostap E M. Biophys J. 1995;68:135s–141s. [PMC free article] [PubMed] [Google Scholar]
- 15.Huxley H E, Kress M. J Muscle Res Cell Motil. 1985;6:153–161. doi: 10.1007/BF00713057. [DOI] [PubMed] [Google Scholar]
- 16.Cooke R. CRC Crit Rev Biochem. 1986;21:53–118. doi: 10.3109/10409238609113609. [DOI] [PubMed] [Google Scholar]
- 17.Rayment I, Holden H M, Whittaker M, Yohn C B, Lorenz M, Holmes K C, Milligan R A. Science. 1993;261:58–65. doi: 10.1126/science.8316858. [DOI] [PubMed] [Google Scholar]
- 18.Spudich J A. Nature (London) 1994;372:515–518. doi: 10.1038/372515a0. [DOI] [PubMed] [Google Scholar]
- 19.Uyeda T Q, Abramson P D, Spudich J A. Proc Natl Acad Sci USA. 1996;93:4459–4464. doi: 10.1073/pnas.93.9.4459. [DOI] [PMC free article] [PubMed] [Google Scholar]
- 20.Fisher A J, Smith C A, Smith R, Sutoh K, Holden H M, Rayment I. Biophys J. 1995;68:19s–28s. [PMC free article] [PubMed] [Google Scholar]
- 21.Whittaker M, Wilson-Kubalek E M, Smith J E, Faust L, Milligan R A, Sweeney H L. Nature (London) 1995;378:748–751. doi: 10.1038/378748a0. [DOI] [PubMed] [Google Scholar]
- 22.Gollub J, Cremo C R, Cooke R. Nat Struct Biol. 1996;3:796–802. doi: 10.1038/nsb0996-796. [DOI] [PubMed] [Google Scholar]
- 23.Thomas D D. Annu Rev Physiol. 1987;49:891–909. doi: 10.1146/annurev.ph.49.030187.003355. [DOI] [PubMed] [Google Scholar]
- 24.Irving M, St. Claire Allen T, Sabido-David C, Craik J S, Brandmeier B, Kendrick-Jones J, Corrie J E T, Trentham D R, Goldman Y E. Nature (London) 1995;375:688–691. doi: 10.1038/375688a0. [DOI] [PubMed] [Google Scholar]
- 25.Hambly B, Franks K, Cooke R. Biophys J. 1992;63:1306–1313. doi: 10.1016/S0006-3495(92)81717-4. [DOI] [PMC free article] [PubMed] [Google Scholar]
- 26.Zhao L, Gollub J, Cooke R. Biochemistry. 1996;35:10158–10165. doi: 10.1021/bi960505v. [DOI] [PubMed] [Google Scholar]
- 27.Arata T. J Mol Biol. 1990;214:471–478. doi: 10.1016/0022-2836(90)90194-Q. [DOI] [PubMed] [Google Scholar]
- 28.Simmons R M, Szent-Györgyi A G. Nature (London) 1980;286:624–626. doi: 10.1038/286626a0. [DOI] [PubMed] [Google Scholar]
- 29.Persechini A, Hartshorne D J. Biochemistry. 1983;22:470–477. doi: 10.1021/bi00271a033. [DOI] [PubMed] [Google Scholar]
- 30.Simmons R M, Szent-Györgyi A G. J Physiol (London) 1985;358:47–64. doi: 10.1113/jphysiol.1985.sp015539. [DOI] [PMC free article] [PubMed] [Google Scholar]
- 31.Chantler P D. J Mol Biol. 1985;181:557–560. doi: 10.1016/0022-2836(85)90428-0. [DOI] [PubMed] [Google Scholar]
- 32.Berger C L, Thomas D D. Biochemistry. 1993;32:3812–3821. doi: 10.1021/bi00065a038. [DOI] [PubMed] [Google Scholar]
- 33.Ostap E M, Barnett V A, Thomas D D. Biophys J. 1995;69:177–188. doi: 10.1016/S0006-3495(95)79888-5. [DOI] [PMC free article] [PubMed] [Google Scholar]
- 34.Fajer P G, Bennett R L H, Polnaszek C F, Fajer E A, Thomas D D. J Magn Reson. 1990;88:111–125. [Google Scholar]
- 35.Fajer P G, Fajer E A, Brunsvold N J, Thomas D D. Biophys J. 1988;53:513–524. doi: 10.1016/S0006-3495(88)83131-X. [DOI] [PMC free article] [PubMed] [Google Scholar]
- 36.Griffith O H, Jost P C. In: Spin Labeling. Berliner L, editor. New York: Academic; 1979. pp. 485–523. [Google Scholar]
- 37.Brenner B. In: Molecular Mechanisms in Muscular Contraction. Squire J M, editor. Boca Raton, FL: CRC; 1990. pp. 77–149. [Google Scholar]
- 38.Hambly B, Franks K, Cooke R. Biophys J. 1991;59:127–138. doi: 10.1016/S0006-3495(91)82205-6. [DOI] [PMC free article] [PubMed] [Google Scholar]
- 39.Jontes J D, Wilson-Kubalek E M, Milligan R A. Nature (London) 1995;378:751–753. doi: 10.1038/378751a0. [DOI] [PubMed] [Google Scholar]
- 40.Tanner J W, Thomas D D, Goldman Y E. J Mol Biol. 1992;223:185–203. doi: 10.1016/0022-2836(92)90725-y. [DOI] [PubMed] [Google Scholar]
- 41.Finer J T, Simmons R M, Spudich J A. Nature (London) 1994;368:113–119. doi: 10.1038/368113a0. [DOI] [PubMed] [Google Scholar]
- 42.Molloy J E, Burns J E, Kendrick-Jones J, Tregear R T, White D C S. Nature (London) 1995;378:209–212. doi: 10.1038/378209a0. [DOI] [PubMed] [Google Scholar]
- 43.Howard J. Nature (London) 1997;389:561–567. doi: 10.1038/39247. [DOI] [PubMed] [Google Scholar]
- 44.Geeves M A, Goody R S, Gutfreund H. J Mus Res Cell Motil. 1984;5:351–361. doi: 10.1007/BF00818255. [DOI] [PubMed] [Google Scholar]


