Abstract
In this study we used HeLa cells transfected with a conditional Bcl-2 expression construct to study the effects of Bcl-2 on reduced glutathione (GSH) metabolism. Our previous work demonstrated that depletion of GSH by culturing cells in tissue culture medium lacking the amino acids cysteine and methionine, essential for GSH biosynthesis, caused cells overexpressing Bcl-2 to become sensitized to apoptotic induction. Here we report that Bcl-2 also dramatically alters GSH compartmentalization. Cellular distribution of GSH, assayed by confocal microscopy, revealed that when Bcl-2 expression was suppressed GSH was uniformly distributed primarily in the cytosol, whereas overexpression of Bcl-2 led to a relocalization of GSH into the nucleus. Isolated nuclei readily accumulated radiolabeled GSH and maintained higher nuclear GSH concentration in direct relation to Bcl-2 nuclear protein levels. Moreover, exogenous GSH blocked apoptotic changes and caspase activity in isolated nuclei exposed to the pro-apoptotic protease granzyme B. Our results indicate that one of the functions of Bcl-2 is to promote sequestration of GSH into the nucleus, thereby altering nuclear redox and blocking caspase activity as well as other nuclear alterations characteristic of apoptosis. We speculate that this mechanism contributes to the suppression of apoptosis in cells with elevated Bcl-2 levels.
The ability of Bcl-2 and its family members to regulate apoptosis makes it a tantalizing target for modulating cell death in diseases where tissue homeostasis is disrupted by deregulated cell death. The biochemical mechanisms involved in the function of these proteins, however, have remained elusive. Initial insight into the function of Bcl-2 came from studies in knockout mice (1), which developed pathologies associated with defects in regulation of cellular redox in response to oxidative stress (2). More recent research into the function of Bcl-2 by three-dimensional protein crystallography indicated that the tertiary structure of Bcl-2 resembled the pore-forming domains of bacterial toxins (3). Additionally, recombinant Bcl-XL was capable of forming ion channels in synthetic membranes, and Minn et al. (4) suggested the possibility that Bcl-XL may also regulate the transport of proteins.
Previously, we have reported that in both animal and cell models, Bcl-2 overexpression led to an increase in total cellular glutathione (GSH) levels (5). Depletion of GSH by culturing cells in tissue culture medium lacking the amino acids cysteine and methionine (CM− medium) or treating cells with diethyl maleate to directly deplete GSH caused cells overexpressing Bcl-2 to become sensitized to apoptotic induction. Interestingly, under these conditions Bcl-2 levels remained unchanged, suggesting that Bcl-2 was not directly regulating apoptotic sensitivity but modulating sensitivity through an intermediary such as GSH.
In light of these observations we decided to investigate whether Bcl-2 had any role in GSH trafficking. By using HeLa cells transfected with Bcl-2 under the control of a tetracycline (Tet)-repressible promoter we were able to observe GSH sequestration into the nucleus when Bcl-2 protein expression was high that did not occur when Bcl-2 was low. When these findings were extended to other systems, the observation of nuclear GSH localization was predicted by Bcl-2 status. Depletion of GSH by CM− medium sensitized HeLa cells overexpressing Bcl-2. Additionally, nuclear GSH was functionally relevant because isolated nuclei treated with exogenous GSH were protected from apoptotic changes induced by granzyme B. Taken together these results suggest that one of the functions of Bcl-2 is to sequester GSH within the nucleus.
MATERIALS AND METHODS
Cell Culture.
LYas and LYar cells are sublines obtained from an apoptosis-sensitive B-cell mouse lymphoma (TH-LY) (6). HeLa S3 Tet-Off cells stably transformed with pTRE-Bcl-2 (HeLa/Tet-Bcl-2) (7) were kindly provided by CLONTECH. Cells were grown as described previously (7). To suppress Bcl-2 protein levels HeLa/Tet-Bcl-2 cells were cultured in the presence of 2 μg/ml Tet (Sigma) 48 h before any experiment. Bcl-2 protein levels were assayed by Western blot analysis.
Subcellular Localization of GSH.
To qualitatively assess GSH localization, cells were visualized with a Zeiss Axiovert confocal microscope attached to a PC-based computer running laser scan microscope software for microscope control and image analysis. HeLa/Tet-Bcl-2 cells grown in chamber slides were loaded with 100 nM CellTracker green 5-chloromethylfluorescein diacetate (CMFDA) and 100 nM MitoTracker red CM-H2XRos (MTX) (both from Molecular Probes) following the manufacturer’s directions. Coverslips were mounted with either tissue culture medium, or cells were fixed with 4% paraformaldehyde and mounted with Slowfade (Molecular Probes). LYar/LYas cells were loaded with CMFDA and MTX in suspension culture and following a PBS wash were attached to slides by cytospin. Independent scans of red (510 nM) and green (488 nM) fluorescence were made to identify MTX and CMFDA staining, respectively.
Nuclei Isolation and Nuclear GSH Quantitation.
Nuclei isolation was performed as described previously (8). For quantitation of nuclear pools of GSH, cells were layered on silicon oil, and nuclei were pelleted into GSH lysis buffer for GSH determination or PBS for nuclei purity analysis. Nuclear and whole cell GSH was determined by o-phthaldialdehyde quantitation of GSH as described previously (5).
Quantitation of Nuclear Uptake of Radiolabeled GSH.
Nuclei were resuspended in TKN buffer (150 mM NaCl/1.5 mM MgCl2/10 mM Tris⋅HCl, pH 7.4) supplemented with 1 mM ATP and [3H]GSH (DuPont/NEN) for 45 min as described in Bellomo et al. (9). Nuclei were then pelleted and transferred to scintillation vials, and disintegrations/min were determined with a Packard Tri-Carb 4530 liquid scintillation counter (Packard).
Pulsed-Field Gel Electrophoresis (PFGE) Analysis of DNA Fragmentation.
PFGE was performed as described previously (10). Electrophoretic conditions were: 5 V/cm for 16 h at 14°C with a ramped switching time from 50 to 100 s. Quantification of apoptosis by DNA fragmentation was performed as reported previously (5).
Poly(ADP-Ribose) Polymerase (PARP) and Bcl-2 Analysis.
Western blot analysis of Bcl-2 expression and PARP cleavage was performed as described previously (5) with the exception that filters were probed with Bcl-2 monoclonal or PARP polyclonal antibody (clone 124, Dako; A220, Santa Cruz Biotechnology) at a dilution of 1:2000 and antiactin (Amersham) at 1:2000 in 3% dried milk/PBS-Tween 20 for 2 h. The filters were then washed and probed with horseradish peroxidase-conjugated anti-mouse secondary antibody (Amersham), and detection was performed with enhanced chemiluminescence (ECL, Amersham). Quantitation was performed on a Molecular Dynamics scanning densitometer.
Cell-Free Caspase 3 Activity.
Caspase 3 activity was monitored by cleavage of Asp-Glu-Val-Asp-AFC (DEVD-AFC). The fluorescence of 20 μM of the fluorogenic peptide substrate DEVD-AFC (Biomol, Plymouth Meeting, PA) was measured spectrophotometrically in 96-well plates on a Cytofluor series 400 fluorometric plate reader (PerSeptive Biosystems, Framingham, MA). Formation of the cleavage product was measured in 107 nuclei/ml at 530/25 nM emission while excited at 360/40 nM. Plate temperature was maintained at 37°C throughout.
RESULTS AND DISCUSSION
We and others (11) have reported that Bcl-2 overexpression leads to an increase in total cellular GSH levels (5); conversely, depletion of GSH resensitized cells to apoptotic induction without modulating Bcl-2 levels. Thus, Bcl-2 may modulate apoptosis though an intermediary pathway such as GSH metabolism.
To investigate the effects of Bcl-2 on GSH more directly, we used HeLa cells transfected with Bcl-2 under the control of a Tet-repressible promoter. Addition of Tet for 48 h led to suppression of Bcl-2 protein levels (Fig. 1). To visualize intracellular GSH we used the fluorescent probe CMFDA, which is conjugated to GSH preferentially by glutathione S-transferase, to determine localization of GSH within HeLa/Tet-Bcl-2 cells (12). Analysis by confocal microscopy of GSH staining by CMFDA indicated a cytoplasmic and perinuclear staining in cells where Bcl-2 levels were low. In contrast, cells with high levels of Bcl-2 had abundant nuclear CMFDA staining with diffuse cytoplasmic staining (Fig. 2A). Semiquantitative pseudo-color relief maps emphasize the relative distribution of GSH within these cells under different Bcl-2 protein levels (Fig. 2C).
Figure 1.
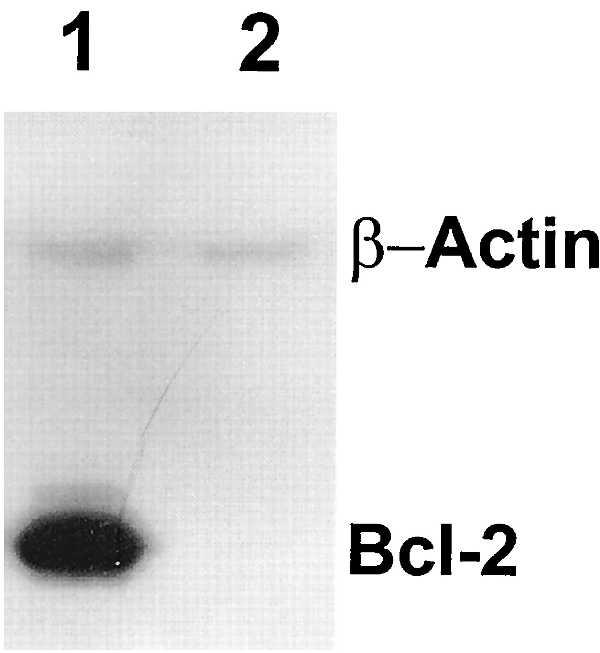
Repression of Bcl-2 protein expression in HeLa/Tet-Bcl-2 cells by Tet. Western blot analysis was performed on the HeLa/Tet-Bcl-2 cell system to ensure adequate suppression of Bcl-2 protein. Protein samples were collected from cell populations that were cultured in parallel on chamber slides for microscopy. Cells were placed in culture with or with out 2 μg/ml Tet (lanes 2 and 1, respectively) and incubated for 48 h to regulate Bcl-2 protein expression. Coimmunodetection of actin was performed to assure equal loading.
Figure 2.
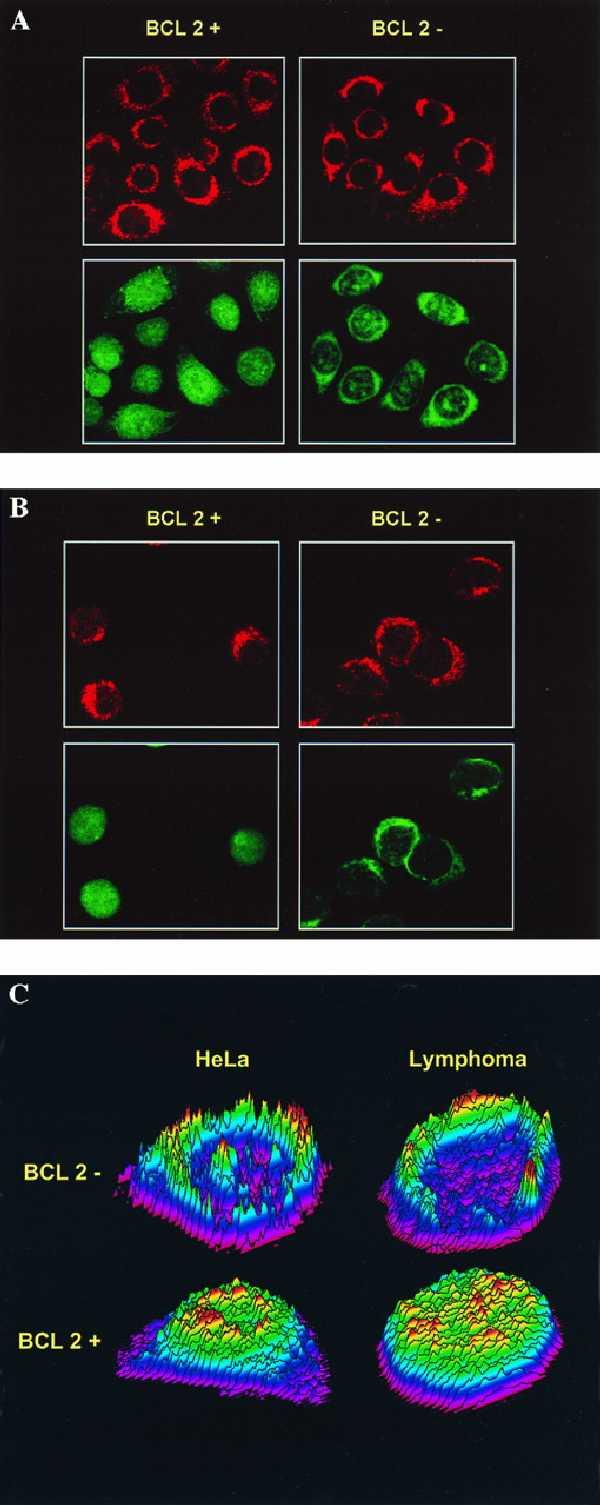
Confocal analysis of GSH and mitochondria staining in HeLa/Tet-Bcl-2 (A) and LYar/LYas (B) cells with CMFDA and MTX. HeLa/Tet-Bcl-2 and LYar/LYas cells were dual labeled with CMFDA to stain GSH and MTX to stain mitochondria. (A Left) HeLa cells grown on chamber slides in the absence of Tet. (A Right) HeLa cells grown for 48 h in the presence of 2 μg/ml Tet. (B Left and Right) Cytospins of LYar and LYas, respectively. (A and B Upper) Cells scanned for red fluorescence to detect mitochondria. (A and B Lower) Cells scanned for green fluorescence to detect GSH staining. Green fluorescence indicates localization of GSH to the nucleus when the Bcl-2 protein level is high that is not seen when Bcl-2 is low. Multiple slides were labeled during many experiments, and reported scans are representative of what was observed. (C) Topographical color relief map of GSH localization in HeLa/Tet-Bcl-2 and LYar/LYas cells. Z-sections from confocal images of cells expressing high and low levels of Bcl-2 are shown. (Upper) HeLa/Tet-Bcl-2 (Left) and LYas cells (Right), which have low levels of Bcl-2 protein expression. (Lower) HeLa cells with Bcl-2 derepressed (Left) and LYar cells (Right), which express high levels of Bcl-2. Gray scale images of CMFDA dye intensity measured in 2-μm z-sections were converted to pseudocolor and plotted in the z axis.
To confirm these findings, we quantified GSH in the nuclear compartment by isolating nuclei through a silicon oil layer (9) to prevent reported GSH leakage from isolated nuclei in aqueous medium and cell-free systems (13). HeLa/Tet-Bcl-2 cells that expressed high levels of Bcl-2 amassed approximately 75% of total cellular GSH within the nucleus, whereas only 30% of the total GSH was located within the nucleus when Bcl-2 expression was suppressed (Table 1).
Table 1.
Quantitation of GSH in isolated nuclei from HeLa/Tet-Bcl-2 cells
| GSH
|
|||||
|---|---|---|---|---|---|
| Cell total
|
Nucleus
|
||||
| HeLa | pg/cell | mM | pg/nucleus | mM | % nuclear |
| Bcl-2 off | 5.4 ± 0.84 | 16 ± 2.4 | 1.7 ± 0.36 | 6 ± 1.3 | 32 |
| Bcl-2 on | 5.8 ± 0.95 | 14 ± 2.3 | 4.3 ± 1.51 | 16 ± 5.4 | 74 |
GSH content was calculated on a cell (nucleus) basis and reported as amount and concentration. Reported values are from three samples, and the standard deviation is reported. Similar results were observed in multiple experiments.
Bellomo et al. (9, 14) have previously documented the existence of an ATP-dependent nuclear GSH sequestration system in isolated hepatocytes. Because all currently available dyes for GSH have different degrees of specificity for GSH, we directly measured GSH uptake in isolated nuclei from HeLa/Tet-Bcl-2 cells expressing different levels of Bcl-2. Incubation of nuclei in the presence of radiolabeled GSH and ATP led to increasing accumulation of nuclear GSH with increasing amounts of nuclear Bcl-2 protein expression (Fig. 3). We are currently investigating the mechanism and energy requirements of Bcl-2-mediated nuclear GSH sequestration (unpublished data).
Figure 3.
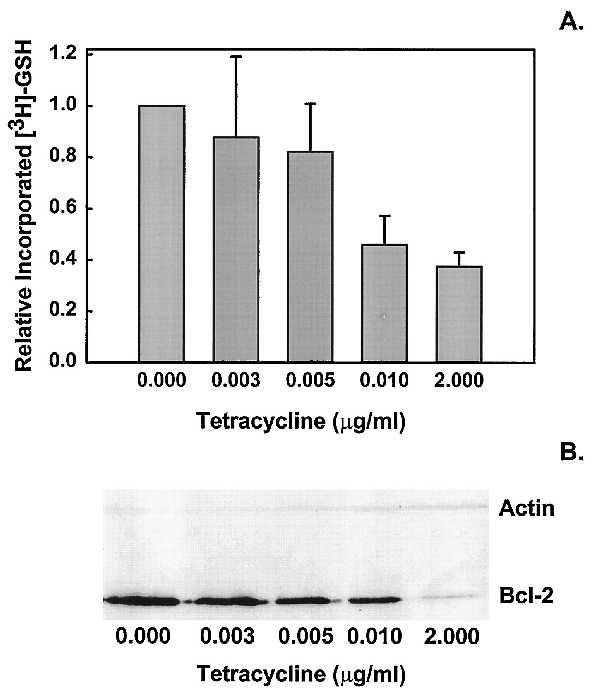
Nuclear uptake of GSH as a function of Bcl-2 protein concentration in isolated nuclei. To determine the relationship between uptake of GSH and Bcl-2 protein expression, isolated nuclei from HeLa/Tet-Bcl-2 cells were incubated with [3H]GSH in TKN buffer for 45 min as described previously (9). To obtain varying levels of Bcl-2, cells were exposed to titrated levels of Tet before nuclei isolation. Nuclei were then processed for Western blot analysis of Bcl-2 or incubated with radiolabeled GSH. (A) Increased GSH uptake was observed in nuclei that expressed elevated levels of Bcl-2. (B) Verification of Bcl-2 protein levels observed in isolated nuclei by Western blot analysis. Error bars represent SE from three independent experiments repeated with similar results.
We next examined a number of different cell systems to determine the universality of the effect of Bcl-2 on nuclear GSH. We have previously described the LYar and LYas mouse lymphoma cell systems, which are derived from cells isolated from an apoptosis-sensitive mouse tumor (6). In LYas cells, which have no detectable Bcl-2 protein by Western blot analysis (5), weak nuclear CMFDA staining and moderate mitochondrial localization was observed when cells were analyzed by confocal microscopy (Fig. 2B). However, LYar cells, which express a 30-fold higher level of Bcl-2, had prominent nuclear staining along with cytoplasmic staining (Fig. 2B). Consistent observations were obtained with thymocytes from Bcl-2 transgenic or Bcl-2 knockout mice; where Bcl-2 levels were high, nuclear accumulation of GSH was observed (Fig. 4). Interestingly, in the wild-type control mice, there was heterogeneity in nuclear GSH staining between individual cells, which may be indicative of the heterogeneity to apoptosis susceptibility observed in the developing thymus during T cell maturation (15).
Figure 4.
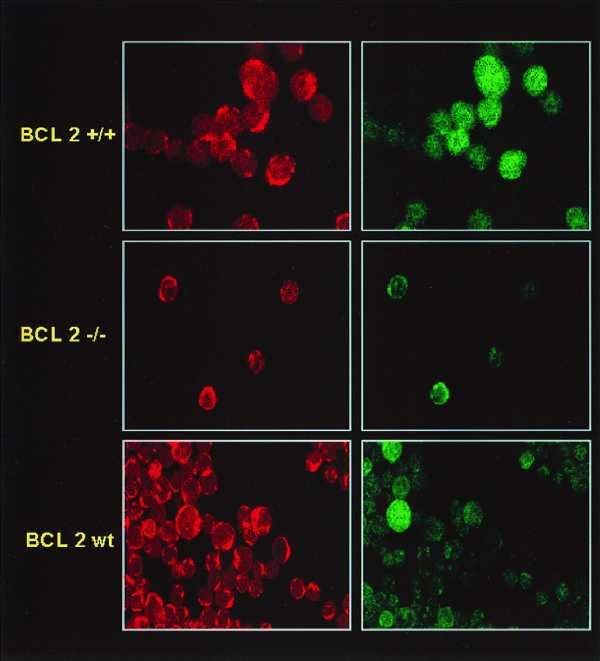
Localization of GSH in mouse thymocytes expressing various levels of Bcl-2 as analyzed by confocal microscopy. Isolated thymocytes from mice transgenic for Bcl-2 (top), Bcl-2 knockout mice (middle), or control littermates (bottom) were stained with CMFDA and MTX and subjected to confocal microscopy. Mitochondria are highlighted by MTX localization in the left panels, whereas GSH localization is shown in the right panels. Of interest is the heterogeneous GSH staining between cells in the control mice suggesting high Bcl-2 levels in some thymocytes and low Bcl-2 levels in others.
To determine the relevance of GSH accumulation to apoptosis susceptibility, we depleted GSH in the Bcl-2-expressing cells through incubation in CM− medium. This partially restored apoptotic sensitivity to ionizing radiation (Fig. 5). We previously reported (5) that diethyl maleate was able to reverse the resistance to apoptosis by Bcl-2 expression in LYar cells by depleting GSH; however, buthionine sulfoximine, which primarily depletes cytosolic and not nuclear GSH (13), did not sensitize Bcl-2-expressing LYar cells. Diethyl maleate depletes GSH by conjugating with –SH groups within all cellular pools, whereas buthionine sulfoximine depletes GSH by inhibiting γ-glutamylcysteine synthetase that is necessary for cytosolic GSH biosynthesis. Therefore, it is likely that compartmentalization of GSH is a more important determinant of apoptosis sensitivity than the overall intracellular level of GSH.
Figure 5.
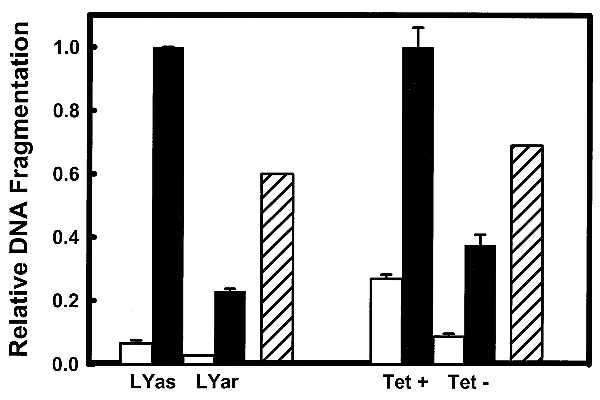
Suppression of radiation-induced DNA fragmentation in HeLa/Tet-Bcl-2 and LYar/LYas by Bcl-2 is reversed in the presence of CM− medium. DNA fragmentation in mouse lymphoma and HeLa cells with either high or low Bcl-2 expression following exposure to 5 Gy γ-irradiation (dark bars) or sham irradiation (light bars) is shown. Previously we have reported that incubation cells in CM− medium sensitized them to radiation in the presence of Bcl-2 by depleting GSH (5). Therefore, LYar and HeLa cells expressing high levels of Bcl-2 were incubated in the presence of CM− medium following exposure to 5 Gy (hatched bar). Fragmentation was normalized to compare differences between induced fragmentation with different levels of Bcl-2 protein. In LYas cells fragmentation peaked at 4 h with approximately 80% of the DNA fragmented. The time course for DNA fragmentation in HeLa cells is of a longer duration. Maximum fragmentation was 30% measured at 120 h. Bcl-2 influence on radiation-induced DNA fragmentation could be measured as early as 24 h, which is reported in the figure. Error bars are SD from three samples, and each experiment was repeated with similar results.
Members of a family of cysteine proteases homologous to human interleukin-1β-converting enzyme, collectively termed caspases, are key components of the effector machinery leading to DNA fragmentation in apoptosis. Although early work suggested that these proteases are expressed primarily in the cytosol, recent results indicate that they are also found in the nucleus (16, 17). To test the functional relevance of the nuclear GSH pool in apoptosis regulation we developed a cell-free system in which exogenous recombinant granzyme B was used to directly trigger caspase activation (18) and DNA fragmentation in isolated nuclei. Incubation of isolated nuclei in the presence of granzyme B led to a significant increase in 50-kbp DNA fragments typical of apoptosis (10) as measured by PFGE (Fig. 6A). Parallel Western blot analysis of PARP cleavage (indicative of caspase 3 activation (19)) revealed that the granzyme B-treated samples also exhibited characteristic 89-kDa PARP fragments (Fig. 6B). However, when 10 mM GSH was added to nuclei immediately before addition of granzyme B both DNA fragmentation and PARP cleavage were suppressed (Fig. 6). Similar inhibition was observed by using lower GSH concentrations in the presence of a regenerating system [NADPH + GSH reductase (data not shown)]. GSH also inhibited the cleavage of DEVD-AFC, a specific substrate for caspase 3, at a concentration of granzyme B sufficient to induce DNA fragmentation and a 4-fold increase in fluorescence of hydrolyzed DEVD-AFC (Fig. 6C). Importantly, granzyme B did not cleave DEVD-AFC directly when incubated without nuclei (data not shown), indicating that DEVD hydrolysis was because of caspase activation. Additionally, GSH did not prevent either the hydrolysis of a granzyme B-selective peptide substrate (AAD-AFC) or production of the 64-kDa fragment characteristic of direct granzyme B cleavage of PARP (20, 21). These observations suggest that DEVD-AFC hydrolysis was because of activation of caspase 3 and that GSH inhibited the catalytic activity of caspase 3 and not granzyme B processing of caspase 3.
Figure 6.
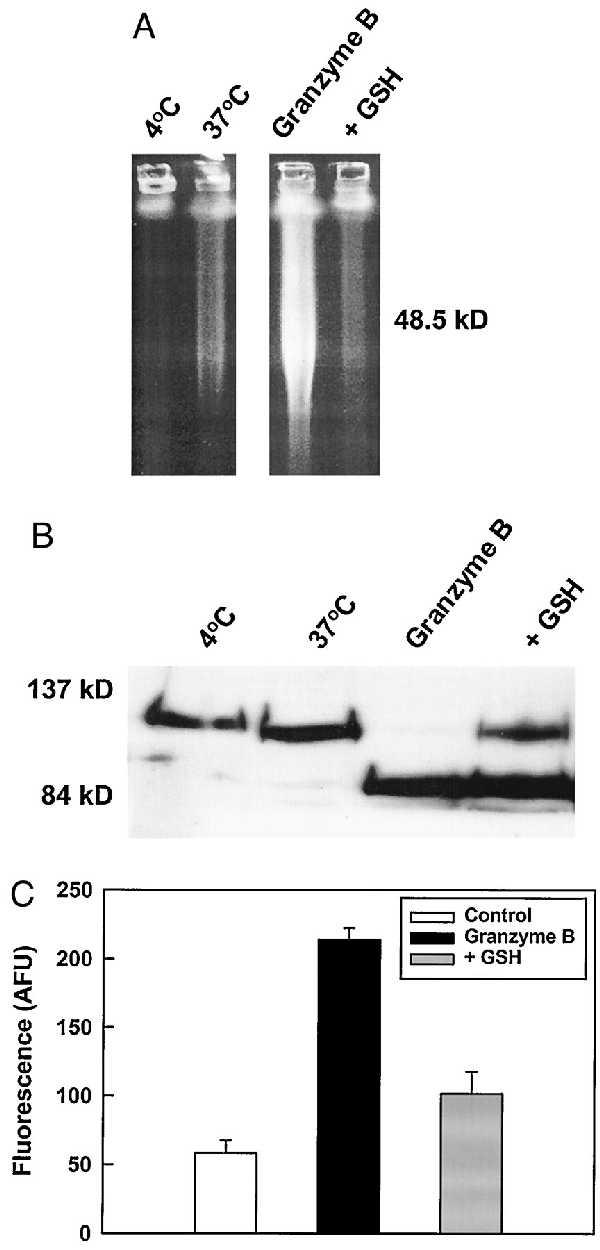
DNA fragmentation and PARP cleavage but not caspase 3 processing are inhibited by GSH in nuclei treated with granzyme B. Nuclei from LYas cells were isolated and treated with 20 units of granzyme B for 1 h at 37°C. Samples were then separated to analyze (A) DNA and (B) PARP and integrity by PFGE and Western blot, respectively. Granzyme-treated samples exhibited both PARP cleavage and generation of a 50-kbp fragment, which was abolished by addition of 10 mM GSH. Although PARP cleavage was not totally suppressed this is probably because of the lack of a GSH-regenerating system (see text). In separate experiments caspase 3 activity and processing (C) were determined by cleavage of a target peptide 30 min following addition of 20 units of granzyme B. Addition of 10 mM GSH was able to suppress the cleavage of DEVD-AFC. Error bars in caspase 3 activity measurements were from replicate wells.
Although recent work has established that Bcl-2 can block release of cytochrome c and certain other mitochondrial features of apoptosis (22, 23) (for a review see ref. 24), a substantial fraction of total cellular Bcl-2 localizes to the nuclear envelope (25), where it may exert additional antiapoptotic activities (8, 26, 27), and we favor the idea that Bcl-2 interferes with apoptosis at multiple subcellular sites concurrently. Although the observation that Bcl-2 promotes nuclear uptake of GSH is unprecedented, our data are entirely consistent with previous results demonstrating that GSH depletion and efflux occur at a very early stage of apoptosis (28, 29) and that the pro-apoptotic effects of p53 are associated with transcription of genes that generate or respond to oxidative stress (30). Precisely how GSH interferes with nuclear caspase activation is not clear, although the fact that reducing agents actually maintain the activity of recombinant caspase-3 (31) argues that its interference with caspase activity in vivo is indirect, and we are currently pursuing the underlying mechanism(s) aggressively. In a broader sense, however, an alteration in nuclear redox by Bcl-2 modification of GSH concentrations may have pleiotropic effects on susceptibility to DNA damage, gene transcription, and nuclear signal transduction both before and following an apoptotic stimulus; this in essence may determine the response of a cell to an apoptotic stimulus before activation of the apoptotic pathway. This may indeed explain the multiplicity of effects Bcl-2 and its family members appear to have on cells.
Acknowledgments
We thank Mrs. Angela Goodacre for expert technical assistance in acquiring the confocal images. This work was supported by a fellowship from the American Legion Auxiliary (to D.W.V.) and National Cancer Institute Grants CA-06294 and CA-69003 (to R.E.M.), CA-69676 (to D.J.M.), and Core Grant CA-16672.
ABBREVIATIONS
- GSH
glutathione
- CM− medium
tissue culture medium lacking the amino acids cysteine and methionine
- Tet
tetracycline
- CMFDA
5-chloromethylfluorescein diacetate
- MTX
MitoTracker red CM-H2XRos (chloromethyldihydro-X-rosamine)
- PFGE
pulse field gel electrophoresis
- PARP
poly(ADP-ribose) polymerase
- AFC
7-amino-4-trifluoromethylcoumarin
References
- 1.Veis D J, Sorenson C M, Shutter J R, Korsmeyer S J. Cell. 1993;75:229–240. doi: 10.1016/0092-8674(93)80065-m. [DOI] [PubMed] [Google Scholar]
- 2.Hockenbery D M, Oltvai Z N, Yin X M, Milliman C L, Korsmeyer S J. Cell. 1993;75:241–251. doi: 10.1016/0092-8674(93)80066-n. [DOI] [PubMed] [Google Scholar]
- 3.Muchmore S W, Sattler M, Liang H, Meadows R P, Harlan J E, Yoon H S, Nettesheim D, Chang B S, Thompson C B, Wong S L, Ng S C, Fesik S W. Nature (London) 1996;381:335–341. doi: 10.1038/381335a0. [DOI] [PubMed] [Google Scholar]
- 4.Minn A J, Velez P, Schendel S L, Liang H, Muchmore S W, Fesik S W, Fill M, Thompson C B. Nature (London) 1997;385:353–357. doi: 10.1038/385353a0. [DOI] [PubMed] [Google Scholar]
- 5.Mirkovic N, Voehringer D W, Story M D, McConkey D J, McDonnell T J, Meyn R E. Oncogene. 1997;15:1461–1470. doi: 10.1038/sj.onc.1201310. [DOI] [PubMed] [Google Scholar]
- 6.Story M D, Voehringer D W, Malone C G, Hobbs M L, Meyn R E. Int J Radiat Biol. 1994;66:659–668. [PubMed] [Google Scholar]
- 7.Yin D X, Schimke R T. Cancer Res. 1995;55:4922–4928. [PubMed] [Google Scholar]
- 8.Marin M C, Fernandez A, Bick R J, Brisbay S, Buja L M, Snuggs M, McConkey D J, von Eschenbach A C, Keating M J, McDonnell T J. Oncogene. 1996;12:2259–2266. [PubMed] [Google Scholar]
- 9.Bellomo G, Palladini G, Vairetti M. Microsc Res Tech. 1997;36:243–252. doi: 10.1002/(SICI)1097-0029(19970215)36:4<243::AID-JEMT3>3.0.CO;2-N. [DOI] [PubMed] [Google Scholar]
- 10.Zhivotovsky B, Wade D, Gahm A, Orrenius S, Nicotera P. FEBS Lett. 1994;351:150–154. doi: 10.1016/0014-5793(94)00827-2. [DOI] [PubMed] [Google Scholar]
- 11.Kane D J, Sarafian T A, Anton R, Hahn H, Gralla E B, Valentine J S, Ord T, Bredesen D E. Science. 1993;262:1274–1277. doi: 10.1126/science.8235659. [DOI] [PubMed] [Google Scholar]
- 12.Coates A, Tripp E. Melanoma Res. 1995;5:107–111. doi: 10.1097/00008390-199504000-00006. [DOI] [PubMed] [Google Scholar]
- 13.Thomas M, Nicklee T, Hedley D W. Br J Cancer. 1995;72:45–50. doi: 10.1038/bjc.1995.275. [DOI] [PMC free article] [PubMed] [Google Scholar]
- 14.Bellomo G, Vairetti M, Stivala L, Mirabelli F, Richelmi P, Orrenius S. Proc Natl Acad Sci USA. 1992;89:4412–4416. doi: 10.1073/pnas.89.10.4412. [DOI] [PMC free article] [PubMed] [Google Scholar]
- 15.Sentman C L, Shutter J R, Hockenbery D, Kanagawa O, Korsmeyer S J. Cell. 1991;67:879–888. doi: 10.1016/0092-8674(91)90361-2. [DOI] [PubMed] [Google Scholar]
- 16.Krajewska M, Wang H G, Krajewski S, Zapata J M, Shabaik A, Gascoyne R, Reed J C. Cancer Res. 1997;57:1605–1613. [PubMed] [Google Scholar]
- 17.Martins L M, Kottke T, Mesner P W, Basi G S, Sinha S, Frigon N, Tatar E, Tung J S, Bryant K, Takahashi A, Svingen P A, Madden B J, McCormick D J, Earnshaw W C, Kaufmann S H. J Biol Chem. 1997;272:7421–7430. doi: 10.1074/jbc.272.11.7421. [DOI] [PubMed] [Google Scholar]
- 18.Darmon A J, Ley T J, Nicholson D W, Bleackley R C. J Biol Chem. 1996;271:21709–21712. doi: 10.1074/jbc.271.36.21709. [DOI] [PubMed] [Google Scholar]
- 19.Fernandes-Alnemri T, Litwack G, Alnemri E S. J Biol Chem. 1994;269:30761–30764. [PubMed] [Google Scholar]
- 20.Froelich C J, Hanna W L, Poirier G G, Duriez P J, Damours D, Salvesen G S, Alnemri E S, Earnshaw W C, Shah G M. Biochem Biophys Res Commun. 1996;227:658–665. doi: 10.1006/bbrc.1996.1565. [DOI] [PubMed] [Google Scholar]
- 21.Quan L T, Tewari M, O’Rourke K, Dixit V, Snipas S J, Poirier G G, Ray C, Pickup D J, Salvesen G S. Proc Natl Acad Sci USA. 1996;93:1972–1976. doi: 10.1073/pnas.93.5.1972. [DOI] [PMC free article] [PubMed] [Google Scholar]
- 22.Yang J, Liu X, Bhalla K, Kim C N, Ibrado A M, Cai J, Peng T I, Jones D P, Wang X. Science. 1997;275:1129–1132. doi: 10.1126/science.275.5303.1129. [DOI] [PubMed] [Google Scholar]
- 23.Kluck R M, Bossy-Wetzel E, Green D R, Newmeyer D D. Science. 1997;275:1132–1136. doi: 10.1126/science.275.5303.1132. [DOI] [PubMed] [Google Scholar]
- 24.Kroemer G, Zamzami N, Susin S A. Immunol Today. 1997;18:44–51. doi: 10.1016/s0167-5699(97)80014-x. [DOI] [PubMed] [Google Scholar]
- 25.deJong D, Prins F A, Mason D Y, Reed J C, van Ommen G B, Kluin P M. Cancer Res. 1994;54:256–260. [PubMed] [Google Scholar]
- 26.Fernandez A, Fosdick L J, Marin M C, Diaz C, McDonnell T J, Ananthaswamy H N, McConkey D J. Oncogene. 1995;10:769–774. [PubMed] [Google Scholar]
- 27.Beham A, Marin M C, Fernandez A, Herrmann J, Brisbay S, Tari A M, Lopez-Berestein G, Lozano G, Sarkiss M, McDonnell T J. Oncogene. 1997;15:2767–2772. doi: 10.1038/sj.onc.1201464. [DOI] [PubMed] [Google Scholar]
- 28.Backway K L, McCulloch E A, Chow S, Hedley D W. Cancer Res. 1997;57:2446–2451. [PubMed] [Google Scholar]
- 29.Vandendobbelsteen D J, Nobel C S I, Schlegel J, Cotgreave I A, Orrenius S, Slater A F G. J Biol Chem. 1996;271:15420–15427. doi: 10.1074/jbc.271.26.15420. [DOI] [PubMed] [Google Scholar]
- 30.Polyak K, Yong X, Zweier J L, Kinzler K W, Vogelstein B. Nature (London) 1997;389:300–305. doi: 10.1038/38525. [DOI] [PubMed] [Google Scholar]
- 31.Nicholson D W, Ali A, Thornberry N A, Vaillancourt J P, Ding C K, Gallant M, Gareau Y, Griffin P R, Labelle M, Lazebnik Y A, Munday N A, Raju S M, Smulson M E, Yamin T T, Yu V L, Miller D K. Nature (London) 1995;376:37–43. doi: 10.1038/376037a0. [DOI] [PubMed] [Google Scholar]


