

Abstract
Current thinking attributes the balance between T helper 1 (Th1) and Th2 cytokine response patterns in immune responses to the nature of the antigen, the genetic composition of the host, and the cytokines involved in the early interaction between T cells and antigen-presenting cells. Here we introduce glutathione, a tripeptide that regulates intracellular redox and other aspects of cell physiology, as a key regulatory element in this process. By using three different methods to deplete glutathione from T cell receptor transgenic and conventional mice and studying in vivo and/or in vitro responses to three distinct antigens, we show that glutathione levels in antigen-presenting cells determine whether Th1 or Th2 response patterns predominate. These findings present new insights into immune response alterations in HIV and other diseases. Further, they potentially offer an explanation for the well known differences in immune responses in “Th1” and “Th2” mouse strains.
T helper 1 (Th1) and Th2 immune response patterns are defined both by cytokine secretion and by immune functions (1–3). In general, the Th1 pattern is characterized by interleukin 12 (IL-12) and interferon γ (IFN-γ) production and the up-regulation of cell-mediated, e.g., delayed hypersensitivity (DTH), responses (4, 5). The Th2 response pattern is characterized by IL-4 and IL-10 production and the up-regulation of a variety of antibody responses (2). Th1- and Th2-associated cytokines tend to be reciprocally regulatory; IFN-γ inhibits Th2-associated functions (6), and IL-4 and IL-10 inhibit Th1-associated functions (7). In extreme cases, primary or secondary immune responses may develop exclusively in either a Th1 or Th2 response pattern (6) and thus impair the body’s overall ability to combat infection (2, 8, 9).
Antigen-presenting cells (APC)—macrophages, dendritic cells, and B cells—are central to the development of either Th1 or Th2 immunity because antigen presentation and recognition are required to initiate responses. Substantial evidence demonstrates that reciprocal cytokine interactions involving APC regulate the balance between Th1 and Th2 response patterns, e.g., APC secrete IL-12, which drives IFN-γ production, and the Th2-associated cytokine IL-10 (10) inhibits APC IL-12 production and thereby drives IL-4 production (11). However, the underlying mechanism(s) leading to the decision as to whether a Th1 or Th2 cytokine pattern predominates in a given response are still not clearly defined.
Studies presented here show that intracellular glutathione (GSH) levels in APC influence the Th1/Th2 cytokine response pattern. GSH, like nitric oxide (NO), is a small molecule that plays key roles in basic metabolic and cell cycle-related processes. Among its many functions, this cysteine-containing tripeptide reduces protein disulfides, detoxifies free radicals and exogenous toxins, and preserves the intracellular redox balance (12, 13). Previous studies have shown that cyclophosphamide, x- or γ-irradiation, ethanol consumption, and other agents alter immune responses (14–18) at dosages known to deplete GSH (19–22). Here, we deplete GSH in vivo and/or in vitro by treatment with three different agents (diethyl maleate, ethanol, and cyclophosphamide) and examine in vivo and in vitro responses to three well studied antigens (ovalbumin, fowl γ globulin, and a synthetic copolymer of glutamic acid and tyrosine). We show that in all cases, GSH depletion inhibits Th1-associated cytokine production and/or favors Th2-associated responses. Further, by charting the responses of isolated cell populations mixed in vitro, we demonstrate clearly that the decrease in Th1 cytokine production is due to the short-term, readily reversible depletion of APC GSH.
MATERIALS AND METHODS
In Vivo GSH Depletion.
DO11.10 mice, transgenic for an αβ-T cell receptor specific for ovalbumin (OVA) (23), were bred at Northwestern University. Female BALB/c mice were purchased from the Small Animal Production Unit, National Cancer Institute, Frederick, MD. All mice were 8–10 weeks of age.
Ethanol-Consumption Model.
Mice were fed a solid diet (Harlan TekLab, Madison, WI) and water ad libitum, a liquid ethanol diet, or a liquid control diet, as previously described (24). The liquid ethanol diet (1 kcal/ml) contained 30% ethanol-derived calories (4.9% wt/vol), the liquid control diet isocalorically substituted sucrose for ethanol. Control mice were pair-fed, such that caloric intake by the ethanol-fed mice determined the caloric intake for the liquid control diet-fed mice for the subsequent day. Mice were fed the indicated diets for 11–14 days and euthanized, and spleens or lymph nodes (LN) were removed aseptically for use in culture.
Diethyl Maleate (DEM) Feeding Model.
BALB/c mice were fed liquid control diet ± 5 mM DEM (55–70 μmol DEM/mouse per day). Mice were pair-fed, such that the caloric intake by the liquid control diet/DEM-fed mice determined the caloric intake for the liquid control diet-fed mice for the subsequent day. Mice were fed for 11–14 days and euthanized, and LN were used in culture.
Cyclophosphamide (CY) Treatment.
Mice were immunized i.p. with 50 μg GT [poly(Glu50Tyr50), Sigma] or 20 μg GT coupled to methylated BSA (GTMBSA) emulsified in complete Freund’s adjuvant (CFA, H37Ra, Difco) and GT-specific plaque forming cells (pfc) were determined 7 days later (14). Indicated groups were injected, i.p., with CY (5 mg/kg) 24 h before immunization. Some mice were fed N-acetyl-l-cysteine (NAC, 1 mg/ml) or N-acetyl-l-serine (NAS, 1 mg/ml) in their drinking water 48 h before immunization and throughout the experiment. Mice consumed 3–4 ml (3–4 mg) of NAC or NAS per day.
In Vitro GSH Depletion.
Spleen cells from BALB/c mice were treated with NH4Cl-KHC03 to lyse erythrocytes and suspended in DMEM at 107 cells/ml and treated with 0.4, 1.6, 3.1, or 6.2 mM DEM for 15 min at 37°C. Cells were washed three times to remove DEM and assayed for intracellular GSH (25) prior to culture.
Cultures.
Spleen or LN cells were cultured (5 × 10⁵ cells in 200 μl) with FγG (10 μg/ml) in Click’s medium (Irvine Scientific) supplemented with 5 × 10⁻⁵ M 2-mercaptoethanol, 3 μM Gln, and 1% Nutridoma (a serum substitute, Boehringer Mannheim). T cell proliferation was determined in 72-h, 96-well cultures pulsed with 0.5 μCi per well of 3H-labeled TdR at 48 h. Net-incorporated (Δ) counts per minute (cpm) were determined by subtracting the cpm of unstimulated cultures (≤1500 cpm) from cultures established in the presence of antigen. Culture supernatants were collected at 12, 24, 48, and 72 h culture for cytokine analysis.
Immunization Model.
BALB/c mice were immunized with 100 μg fowl gamma globulin (FγG, Rockland, Gilbertsville, PA) in CFA 4 days after the start of GSH-depleting dietary regimens. On day 11, 7 days after immunization, LN cells were assayed for FγG-specific responses in culture.
BALB/c APC and DO11.10 T Cell Cocultures.
T cells from DO11.10 mice were enriched from erythrocyte-free spleens depleted of B cells and adherent cells (Cellect Columns, Biotex Laboratories, Edmonton, Canada). Purified transgenic T cells (5 × 10⁴), 4 × 10⁵ BALB/c spleen cells as a source of APC, and 18 μM OVA were cocultured for 24–72 h in 96-well culture plates in Click’s medium as described above.
Cytokine Analysis.
IL-2, IFN-γ, granulocyte/macrophage colony-stimulating factor (GM-CSF), and IL-4 levels in culture supernatants were determined by ELISA (Endogen, Cambridge, MA). Total IL-12 levels in culture supernatants were determined by using an ELISA kit from Genzyme (Woburn, MA).
RESULTS
Ethanol-Feeding Decreases IFN-γ and Enhances IL-4 in Immunized Mice.
BALB/c mice fed a liquid diet containing 30% ethanol-derived calories for 11 days show markedly diminished delayed hypersensitivity (DTH, a Th1-associated response) and enhanced humoral immune (Th2-associated) responses (24). Similarly, ethanol feeding decreases OVA-specific DTH in unimmunized αβ T cell receptor transgenic (DO11.10) mice (24). Data in Fig. 1 show that in vitro cytokine responses produced by T cells taken from immunized, ethanol-fed mice also shift to a Th2 pattern.
Figure 1.
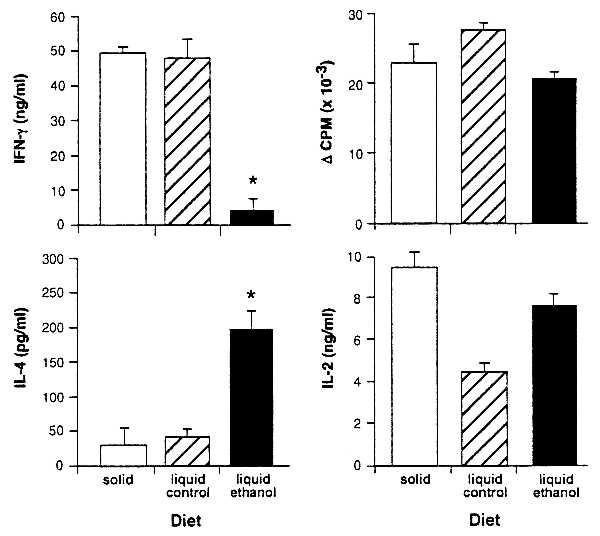
IFN-γ is diminished and IL-4 is enhanced in cultures derived from ethanol-consuming BALB/c mice immunized with FγG. BALB/c mice were fed solid diet, liquid control diet, or liquid ethanol diet and immunized 4 days later with 100 μg of FγG in CFA. On day 11 LN cells were assayed for FγG-specific proliferation and cytokine responses. IFN-γ (72 h) and IL-4 (48 h) were measured. Asterisks indicate a significant change in IFN-γ (P < 0.001) or IL4 (P < 0.005) production. Cytokine production in response to Con A stimulation was unaltered in cultures from ethanol-fed mice (data not shown). T cell proliferation was determined in 72-h cultures pulsed with 0.5 μCi per well of 3H-labeled TdR at 48 h. Optimal IL-2 production was measured at 48 h. No significant differences in T cell proliferative responses were seen. The slight increase in the liquid control diet proliferation, accompanied by a decrease in IL-2, can be attributed to the increased uptake of this autocrine growth factor by the liquid control diet cells.
In these studies, BALB/c mice were fed an ethanol-containing diet for 11 days, a liquid control diet that isocalorically substitutes sucrose for ethanol, or a standard laboratory chow diet and water ad libitum. All mice were immunized on dietary day 4 with FγG, LN cells were cultured with antigen on day 11, and IL-4 and IFN-γ production were assayed. IL-2 and T cell proliferation were measured as an overall index of T cell activation.
Results show that ethanol feeding sharply diminishes IFN-γ and increases IL-4 production in the antigen-stimulated cultures (Fig. 1). T cell proliferation and IL-2 production, in contrast, are unaffected. Thus, consistent with our previous demonstration that ethanol feeding before immunization inhibits DTH (24), findings presented here demonstrate that in vitro IFN-γ production is decreased and IL-4 production is favored.
GSH Depletion Decreases IFN-γ Responses in Immunized Mice.
Ethanol consumption causes a wide variety of physiological effects, including depletion of cellular GSH (17). Severe GSH depletion (>70%) grossly alters the ability of APC to process and present antigen to T cells (26) due in part to the need for reduction of disulfide bonds before proteolytic digestion of antigen (27, 28). Under conditions used in these studies, ethanol decreases total GSH levels in splenic leukocytes by approximately 25% after 4 days of feeding.
Feeding BALB/c mice a liquid diet supplemented with a well known GSH-depleting agent, diethyl maleate (DEM, 5 mM) (29), depletes GSH in splenic leukocytes (28% decrease) and peritoneal cells (38% decrease) in comparison with pair-fed controls. Following the protocol established in the ethanol treatment experiments, DEM-treated and control mice were immunized on dietary day 4 with FγG, and on day 11 LN cells from each group were cultured with antigen. Culture supernatants were assayed for IFN-γ (but not IL-4), IL-2, and GM-CSF. Antigen-stimulated IFN-γ production is decreased by 40% in cultures from DEM-treated mice, whereas T cell proliferation, production of IL-2, and production of GM-CSF are unaffected (Table 1). Thus, like in ethanol-fed mice, antigen-stimulated in vitro IFN-γ production is impaired in mice fed a GSH-depletor before immunization.
Table 1.
DEM treatment inhibits IFN-γ production in FγG-immunized BALB/c mice
| Treatment | T cell proliferation, ΔCPM | IL-2, ng/ml | GM-CSF, ng/ml | IFN-γ, ng/ml |
|---|---|---|---|---|
| None | 14,320 ± 202 | 2.4 ± 0.05 | 2.2 ± 0.03 | 21.6 ± 3.29 |
| DEM | 12,579 ± 324 | 2.3 ± 0.10 | 2.2 ± 0.05 | 13.3 ± 0.64 |
Mice were fed DEM in liquid control diet for 11 days to deplete GSH, immunized on day 4 with FγG, and on day 11 LN cells were stimulated in culture with 10 μg FγG. T cell proliferation was determined in 72-h cultures pulsed with 0.5 μCi per well of 3H-labeled TdR at 48 h. Cytokine production was measured at 48 (IL-2 and GM-CSF) and 72 (IFN-γ) h. DEM treatment significantly decreased (P < 0.001) IFN-γ production (boxed value); no significant alteration was seen in T cell proliferation, Il-2, or GM-CSF production. IFN-γ production in response to Con A stimulation was unaltered (not shown).
APC from Ethanol-Fed Mice Do Not Support IFN-γ Production by T Cells from T Cell Antigen Receptor (TCR)-Transgenic Mice.
In the studies described above, we used a two-stage immunization system in which conventional BALB/c mice were immunized with FγG while being maintained on ethanol (or DEM) diets, and their LN cells were subsequently tested for response to the immunizing antigen. To define the cellular mechanism mediating this ethanol-induced lesion, we used BALB/c congenic αβ TCR transgenic (DO11.10) mice in which >85% of their T cells are specific for OVA. We cocultured spleen cells (APC source) from ethanol-fed BALB/c mice with purified T cells (free of APC) from control diet DO11.10 mice, and vice versa. In this coculture system, the BALB/c splenic APC present OVA to purified T cells from the unimmunized DO11.10 transgenic mice, leading to proliferation and cytokine production. OVA presentation by control (i.e., solid or liquid control diets) APC stimulates DO11.10 T cells to produce readily detectable IL-2 and IFN-γ after 3 days in culture (Table 2). IL-12, which is derived from an APC source, is also readily detectable. In contrast, IL-4 production is not detectable in these cultures (<10 pg/ml).
Table 2.
IL-12 and IFN-γ are inhibited in cultures containing APC from ethanol-fed mice and DO11.10 OVA-transgenic T cells
| Diet
|
Cytokine production
|
|||
|---|---|---|---|---|
| BALB/c, APC | DO11.10, T cells | IFN-γ, ng/ml | IL-2, ng/ml | IL-12, pg/ml |
| Liquid ethanol | Solid | 68 ± 2.7 | 39 ± 4.5 | <20 |
| Liquid ethanol | Liquid control | 25 ± 0.0 | 33 ± 3.3 | <20 |
| Liquid ethanol | Liquid ethanol | 35 ± 1.8 | 51 ± 0.3 | <20 |
| Liquid control | Solid | 196 ± 0.4 | 46 ± 2.5 | 192 ± 7.5 |
| Liquid control | Liquid control | 194 ± 1.8 | 37 ± 0.9 | 186 ± 0.0 |
| Liquid control | Liquid ethanol | 176 ± 11.7 | 58 ± 1.9 | 202 ± 22.5 |
| Solid | Solid | 235 ± 48.3 | 59 ± 2.8 | 298 ± 7.5 |
| Solid | Liquid control | 205 ± 11.3 | 43 ± 1.2 | 372 ± 22.5 |
| Solid | Liquid ethanol | 191 ± 20.3 | 64 ± 1.5 | 399 ± 15.0 |
T cells and APC from unimmunized mice fed liquid ethanol diet, liquid control diet, or standard laboratory chow diet were cocultured with 18 μM of OVA. Cytokine production was measured in the culture supernatants at 48 h (IL-2, IL-12) and 72 h (IFN-γ). Boxed IFN-γ values are significantly lower than liquid control diet (P < 0.0001) and solid diet (P < 0.02) controls. Boxed IL-12 values are significantly lower than liquid control or solid diet (P < 0.0001). In all cultures, IL-4 production was undetectable. IFN-γ production in response to Con A stimulation was not diminished in any cell groups (data not shown).
Results from these studies clearly locate ethanol’s effects on IFN-γ production to the APC donor (Table 2). Cultures containing T cells from ethanol-fed donors and APC from control-fed mice show normal levels of IFN-γ. In contrast, cultures containing APC from ethanol-fed donors and T cells from control mice produce substantially less IFN-γ. IL-12 production by the APC in these cultures is also severely decreased. The presentation of antigen per se by cells derived from ethanol fed mice is not impaired, however, because IL-2 production and T cell proliferation (data not shown) are unaffected. Thus, ethanol consumption acts in vivo to decrease Th1-associated cytokine production by selectively impairing APC support for production of these cytokines.
Production of IFN-γ and IL-12 Is Regulated by APC GSH.
Pretreatment of BALB/c APC for 15 min with DEM (in vitro) decreases GSH in a dose-dependent fashion (Fig. 2). When these GSH-depleted APC are cocultured with purified OVA-specific transgenic T cells and OVA, IFN-γ production is significantly decreased. A 20% decrease in APC GSH is sufficient to markedly impair IFN-γ production, whereas IL-2 production and T cell proliferation are unaffected. Consistent with findings by Short et al. (26), extreme depletion of APC GSH (>70%) diminishes both T cell proliferation and cytokine production (data not shown). GSH depletion with DEM is sufficient to explain the decreased IFN-γ response in cells cultured from the ethanol-fed mice.
Figure 2.
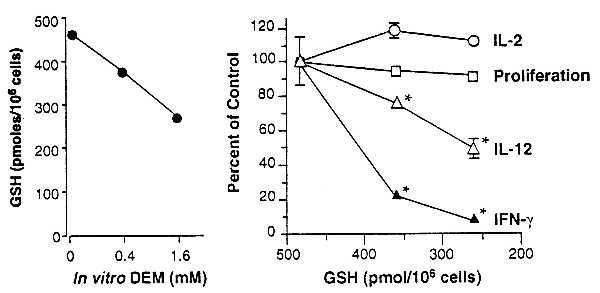
Decreases in APC GSH levels are accompanied by diminished OVA-specific IFN-γ production by DO11.10 transgenic T cells without affecting T cell proliferative or IL-2 responses. Erythrocyte-free spleen cells from unimmunized BALB/c mice were treated with 0, 0.4, or 1.6 mM DEM for 15 min and washed, and their intracellular GSH levels were determined. Points represent the mean of 6 replicate wells; SEM was <5% of the mean in all cases. Cultures were established with the DEM-treated APC, purified T cells from DO11.10 mice, and OVA. IL-2, T cell proliferation, IL-12, and IFN-γ content of the culture supernatants were determined. Points represent the means of duplicate wells ± SEM. Asterisks indicate significantly diminished (P < 0.005) cytokine levels. IFN-γ production stimulated by Con A was not decreased in cultures containing APC with depleted GSH (not shown).
The loss of support for IFN-γ production after depletion of APC GSH is readily reversible. APC GSH and IFN-γ production (Fig. 3) both recover to near normal levels when DEM-treated APC are cultured for 5 h in Click’s medium before the addition of OVA and OVA-specific transgenic T cells. Thus, rather than killing or permanently modifying APC function, moderate GSH depletion by DEM treatment temporarily renders APC incapable of supporting IFN-γ production. This reversibility, and the quantitative parallel between APC GSH levels and IFN-γ production observed in these experiments (Figs. 2 and 3), document APC GSH as a key regulator in the production of this cytokine.
Figure 3.
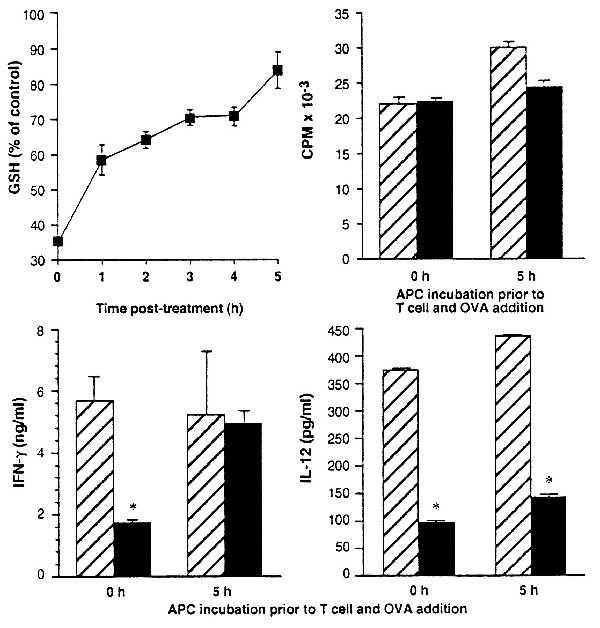
GSH depletion of APC and its effect on T cell cytokine production are rapidly reversed by conditions that allow recovery of GSH. Erythrocyte-free spleen cells from BALB/c mice were treated in vitro with 1.6 mM DEM in Click’s medium for 15 min and washed, and their intracellular GSH levels were determined. Points represent the mean GSH levels after 0–5 h in Click’s medium at 37°C as a percent of untreated controls ± SEM for six replicates. APC were untreated (hatched bars) or treated (solid bars) with 1.6 mM DEM for 15 min, and cultures were established (either after 5 h incubation in Click’s medium at 37°C or immediately after treatment) with purified T cells from DO11.10 mice and OVA. T cell proliferative, IFN-γ, and IL-12 responses were determined at 72 h in cultures established with APC immediately after DEM treatment and in cultures in which DEM-treated APC were incubated in Click’s medium for 5 h at 37°C before the addition of T cells and OVA. Asterisks indicate significantly diminished (P < 0.005) cytokine levels.
IL-12 Production Does Not Recover in Parallel with IFN-γ and GSH.
The Th1 immune response pattern is typified by T cell production of IFN-γ and APC production of IL-12. Consistent with this, we find that loss of IFN-γ production because of APC GSH depletion is accompanied by loss of IL-12 production (Fig. 3 and Table 2). Surprisingly, however, we find that although recovery of APC GSH in DEM-treated cells results in full recovery of support for IFN-γ production, IL-12 production does not recover. Instead, IL-12 levels in cultures containing DEM-treated APC that were allowed to recover before T cell and antigen addition remain low whether tested at 12 (data not shown) or 72 h of culture (Fig. 3).
These findings demonstrate that GSH need only be depleted from APC for the first few hours of culture to shift the response away from IFN-γ production. Thus, they suggest that the key events that determine whether IFN-γ is produced occur almost immediately after APC come into contact with responding T cells. Because previous studies have shown that IL-12 is required for IFN-γ production (30), these findings indicate either that the low IL-12 levels produced by the DEM-treated/GSH recovered APC are sufficient to support IFN-γ production in our cultures, or that IL-12 is not required under the culture conditions that we use. In any event, the discordance between IFN-γ and IL-12 levels that we observe suggests a looser dependence of IFN-γ production on IL-12 than previous findings would predict.
GSH-Depleted APC Support IL-4 Production.
Results from FγG immunization studies shown in Fig. 1 suggest that although GSH-depleted APC lose the ability to stimulate IFN-γ, they will still provide good stimulation for IL-4. This hypothesis is not testable when in vitro responses by splenic T cell populations from DO11.10 TCR-transgenic mice are measured, because such T cell populations are typically composed of more than 90% “naive” and 3–10% “memory/activated” populations and produce little or no IL-4 when stimulated in vitro by APC and OVA (4). Consistent with this, there is no detectable IL-4 produced by DO11.10 transgenic cells under our culture conditions. To obtain DO11.10 T cells capable of being stimulated to produce IL-4 in vitro, we used a modification of the method of Wenner et al. (31) to generate a short-term, uncloned DO11.10 transgenic T cell line that produces both IL-4 and IFN-γ when stimulated with OVA plus normal APC. We propagated this line for several rounds by stimulation with OVA presented by normal, unmanipulated APC and then evaluated its cytokine production after OVA presentation by GSH-depleted or untreated APC.
As predicted, GSH-depleted APC readily stimulate IL-4 production by this T cell line. Levels of IL-4 produced in response to this stimulation are the same as (or even slightly higher than) the levels of IL-4 stimulated by untreated APC (Fig. 4). Cell proliferation and IL-2 are also stimulated equally by GSH-depleted and the untreated APC (data not shown). Stimulation of IFN-γ production by the GSH-depleted APC, in contrast, is substantially decreased (Fig. 4). Thus, GSH-depleted APC fail to support production of IFN-γ production by this cell line but readily support the production of IL-4.
Figure 4.
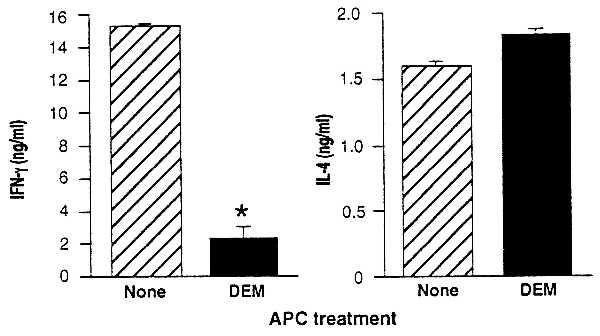
Decreases in APC GSH levels diminish IFN-γ without diminishing IL-4 production by an OVA-specific DO11.10 transgenic T cell line. Cultures were established with BALB/c APC untreated (hatched bars) or treated (solid bars) with 1.6 mM DEM for 15 min, T cells from a DO11.10 transgenic T cell line, and OVA. T cell proliferation and cytokine production of the culture supernatants were determined. IFN-γ and IL-4 are shown as the mean ± SEM. IFN-γ production was significantly (P < .002) diminished, IL-4 production was slightly enhanced (P < .02), and T cell proliferative responses were unaffected in cultures containing DEM-treated APC (not shown).
GSH Depletion Enables Antibody Production by a Genetic Nonresponder Animal.
Normally, the genetic composition of BALB/c mice does not permit antibody responses to the synthetic copolymer antigen poly(Glu50Tyr50) (GT, ref. 14). However, we have previously shown that strong anti-GT antibody responses are produced after a single treatment with CY before GT immunization (ref. 14 and Table 3). Likewise, normally unresponsive mice make an antibody response to GT immunization when fed ethanol (32). Although the immunomodulating effects of CY have been attributed to its alkylating metabolite aldophosphoramide mustard (14, 33), another CY metabolite, acrolein, is known to be a potent GSH depletor (33). Furthermore, GSH depletion is recognized as an important clinical consequence of CY treatment (33).
Table 3.
Anti-GT responses that follow CY treatment are abrogated by NAC
| Treatment | Antigen | n | GT-specific pfc per spleen | P value* | ||
|---|---|---|---|---|---|---|
| None | GT | 9 | 736 ± 232 | — | ||
| CY | GT | 10 | 9,840 ± 2,005 | .0005 | ||
| NAC | CY | GT | 10 | 1,010 ± 350 | .530 | |
| NAS | CY | GT | 5 | 7,400 ± 570 | <.0001 | |
| None | GTMBSA | 9 | 14,278 ± 2,411 | <.0001 | ||
Female BALB/c mice were immunized i.p. with 50 μg GT or 20 μg GT coupled to the immunogenic carrier-methylated BSA (GTMBSA) emulsified in CFA, as indicated. Seven days later, single-cell GT-specific plaque forming cells (pfc) were determined in a hemolytic plaque assay (14). Indicated groups were injected i.p. with CY (5 mg/kg) 24 h before immunization. Some mice were fed N-acetyl-l-cysteine (NAC, 1 mg/ml) or N-acetyl-l-serine (NAS, 1 mg/ml) in the drinking water 48 h before immunization and throughout the experiment. Mice consumed 3–4 ml (3–4 mg) of NAC or NAS per day.
Determined by Student’s t test.
In clinical settings, the toxic effects of CY are reversed by treating with NAC, which replenishes the cysteine required for synthesis and restoration of the depleted GSH (33). Similarly, we find that feeding NAC to CY-treated mice counteracts the effects of CY treatment on the immune system. Thus, CY treatment renders BALB/c mice capable of responding to GT and feeding NAC to the CY-treated mice restores their normal nonresponsiveness to this antigen (Table 3). Feeding CY-treated mice with a compound closely related to NAC, NAS, however, does not restore nonresponsiveness, demonstrating that a source of cysteine for GSH repletion is necessary to counteract the effect of CY. Because antibody responses are classified as Th2-associated, these data once again demonstrate that decreased GSH favors a Th2 response pattern whereas normal GSH levels favor Th1 response patterns.
DISCUSSION
Studies presented here demonstrate that GSH levels in APC play a central role in determining whether Th1 or Th2 cytokine response patterns predominate in immune responses. Using two immunologic models and three methods to deplete GSH, we show that in all cases, GSH depletion leads to a shift away from the typical Th1 cytokine profile and toward Th2 response patterns.
We used DO11.10 transgenic mice to define the cellular mechanism underlying this Th1–Th2 shift. Purified T cells from these mice normally produce substantial amounts of the prototypic Th1 cytokine, IFN-γ, when cocultured with normal BALB/c APC and OVA. However, we show here that the production of IFN-γ by the transgenic T cells is impaired when BALB/c APC donors are GSH-depleted by ethanol- or DEM-feeding or when APC are GSH-depleted in vitro with DEM before culture. Depletion of GSH in APC populations by l-buthionine sulfoximine (unpublished data), likewise, impairs IFN-γ production by transgenic T cells. In contrast, T cells from GSH-depleted mice cocultured with untreated BALB/c APC produce normal amounts of IFN-γ. Thus, the impairment of IFN-γ production is specifically due to the effects of GSH-depletion on APC population(s) rather than on T cells.
Consistent with the well known reciprocal relationship between the production of IFN-γ and IL-4, the decrease in IFN-γ responses by cells from GSH-depleted mice is accompanied by similar or elevated IL-4 levels in cells from such mice. This increase in IL-4 is apparent in the in vitro responses to FγG produced by LN taken from GSH-depleted BALB/c mice after these mice are immunized with FγG. However, it does not occur in cultures of OVA-stimulated spleen cells from GSH-depleted DO11.10 transgenic mice. This failure to produce IL-4 is not surprising, as T cells from DO11.10 transgenic mice produce IFN-γ, but little or no IL-4, upon antigen stimulation (5). As a practical matter, however, it means that responses from purified OVA-transgenic T cells cannot be used to reveal APC support for IL-4 production.
To determine whether GSH-depleted APC support IL-4 production, we therefore established a short-term DO11.10 T cell that produces both IL-4 and IFN-γ in response to OVA presented by normal (untreated) APC. T cell lines isolated by repeatedly stimulating cells from transgenic mice with (normal) APC and antigen typically produce both IFN-γ and IL-4 when initially isolated and tend to selectively lose the ability to produce IL-4 as they progress through repeated stimulation cycles. GSH-depleted APC present OVA in a way that stimulates impaired IFN-γ production by this cell line; however, these APC readily stimulate both proliferation and optimal IL-4 production by the line. These findings thus confirm that GSH-depleted APC support IL-4 production. Further, they suggest that repeated stimulation with GSH-depleted APC may provide a method for generating T cell lines producing IL-4 rather than IFN-γ (either because such stimulation would drive cells to produce IL-4 or because cells committed to producing IL-4 will be selectively propagated).
Recent studies in a system where cultured cells readily produce IL-4 have shown that increasing GSH levels in the cultures decreases IL-4 production in a dose-dependent manner (34). Our data complement this seminal observation by showing that IFN-γ production predominates when GSH levels are high and declines when APC GSH is depleted. In addition, our findings support these earlier observations by showing that Th2 response patterns are favored when APC GSH is depleted.
Defects in antigen processing as a result of GSH depletion do not per se account for these findings. Severe GSH depletion impairs APC ability to reduce antigen disulfide bonds required before antigen processing (26) and to decrease the activity of thiol proteases important in antigen processing and cleaving of the invariant chain from major histocompatibility complex class II (35). However, the moderate depletion of APC GSH under the conditions used here permits normal stimulation of T cell proliferation and production of IL-4. Thus, it is the outcome of antigen presentation, rather than the failure to present antigen, that changes when antigens are presented by GSH-depleted APC.
Current thinking would suggest that altered T cell responses to antigen presented by GSH-depleted APC reflect changes in the production of IL-12, which is produced by APC and known to regulate IFN-γ production. Indeed, we find that GSH depletion decreases IL-12 production. However, although IFN-γ production is lost and fully recovered in parallel with APC GSH, IL-12 production is lost when GSH is depleted but largely fails to recover under conditions that enable GSH and IFN-γ recovery. This difference is perhaps explainable by the production of other cytokines, such as IL-18 (36), capable of replacing or synergizing with low levels of IL-12 in the support of IFN-γ production. If so, then GSH depletion and repletion serve to shift responsiveness to dependence on these cytokines.
The dramatic changes that GSH depletion imposes on immune responses are consistent with the fundamental roles that GSH plays in cellular physiology. Leukocytes are especially sensitive to changes in GSH levels (34, 37, 38), and agents that deplete GSH, including those used in studies presented here, have been shown to alter immune function (24, 39, 40) in a fashion consistent with our findings. Ethanol, for example, down-regulates cell-mediated immune responses and up-regulates humoral immune responses (24). CY enables antibody production in animals that would not normally produce antibodies in response to certain antigens and, at higher doses, inhibits cell proliferation and down-regulates a number of immune functions (39). DEM binds to GSH and other reactive sulfhydryl groups, and, in large doses, it has been shown to severely impair immune function (40). Our data demonstrate that subtle changes in GSH levels may have profound effects on the immune response.
All of these agents display a wide variety of pharmacologic effects; however, they intersect in their ability to deplete GSH and to alter immune function. Furthermore, we have shown that treatment with NAC, a GSH prodrug, reverses the in vivo immunomodulating effects of low-dose CY; and others (34) have shown that supplementing cultures with NAC decreases IL-4 production. Together, these findings persuasively argue for a key role for APC GSH in determining whether antigenic simulation inducted a Th1 or Th2 response pattern.
In fact, the classical response-pattern differences to challenge with parasitic organisms that have led to the characterization of mouse strains as “Th2” or “Th1” may simply reflect a differential sensitivity to GSH depletion. BALB/c mice, a typical Th2 strain, are substantially more sensitive to x-irradiation and ethanol toxicity than C57BL/6 mice, a typical Th1 strain (41, 42). Similarly, the ethanol dose used here to alter immune responses in BALB/c mice is lower than the dose required to alter responsiveness in C57BL/6 mice (24). Because parasite infection may well result in modest GSH depletion, particularly in APC, there is good reason to suspect that differential responsiveness to infection could be mediated by the GSH-dependent mechanisms that we have described here.
A wide range of human diseases are associated with altered levels of GSH (43), including cancer (44) and AIDS (45). Indeed, we have recently shown that GSH deficiency in HIV-infected individuals correlates with decreased survival during a 2- to 3-year monitoring period (46). This diminished survival capacity could be due to any or all of the multiple metabolic and regulatory functions of GSH. Our findings here, however, suggest that alteration in immune function because of GSH depletion in APC populations may play a key role in exacerbating HIV and other infectious diseases in which Th2 predominance is an important aspect of the disease pathology.
Acknowledgments
We thank L. M. Cronin for technical assistance. This work was supported by National Institutes of Health Grants AA08275 and AA10058 to C.W.
ABBREVIATIONS
- APC
antigen-presenting cells
- IFN
interferon
- IL
interleukin
- Th
T helper
- GSH
glutathione
- OVA
ovalbumin
- DEM
diethyl maleate
- CY
cyclophosphamide
- NAC
N-acetyl-l-cysteine
- NAS
N-acetyl-l-serine
- GM-CSF
granulocyte/macrophage colony-stimulating factor
- LN
lymph nodes
- pfc
plaque-forming cells
References
- 1.Mosmann T R, Cherwinski H, Bond M W, Giedlin M A, Coffman R L. J Immunol. 1986;136:2348–2357. [PubMed] [Google Scholar]
- 2.Romagnani S. Annu Rev Immunol. 1994;12:227–257. doi: 10.1146/annurev.iy.12.040194.001303. [DOI] [PubMed] [Google Scholar]
- 3.Fiorentino D F, Bond M W, Mosmann T R. J Exp Med. 1989;170:2081–2095. doi: 10.1084/jem.170.6.2081. [DOI] [PMC free article] [PubMed] [Google Scholar]
- 4.Macatonia S E, Hosken N A, Litton M, Vieira P, Hsieh C S, Culpepper J A, Wysocka M, Trinchieri G, Murphy K M, O’Garra A. J Immunol. 1995;154:5071–5079. [PubMed] [Google Scholar]
- 5.Macatonia S E, Hsieh C S, Murphy K M, O’Garra A. Int Immunol. 1993;5:1119–1128. doi: 10.1093/intimm/5.9.1119. [DOI] [PubMed] [Google Scholar]
- 6.Mosmann T R. Ann N Y Acad Sci. 1991;628:337–344. doi: 10.1111/j.1749-6632.1991.tb17266.x. [DOI] [PubMed] [Google Scholar]
- 7.Fiorentino D F, Zlotnik A, Mosmann T R, Howard M, O’Garra A. J Immunol. 1991;147:3815–3822. [PubMed] [Google Scholar]
- 8.Romagnani S. J Clin Immunol. 1995;15:121–129. doi: 10.1007/BF01543103. [DOI] [PubMed] [Google Scholar]
- 9.Nabors G S, Farrell J P. J Infect Dis. 1996;173:979–986. doi: 10.1093/infdis/173.4.979. [DOI] [PubMed] [Google Scholar]
- 10.D’Andrea A, Aste-Amezaga M, Valiante N M, Ma X, Kubin M, Trinchieri G. J Exp Med. 1993;178:1041–1048. doi: 10.1084/jem.178.3.1041. [DOI] [PMC free article] [PubMed] [Google Scholar]
- 11.Tripp C S, Wolf S F, Unanue E R. Proc Natl Acad Sci USA. 1993;90:3725–3729. doi: 10.1073/pnas.90.8.3725. [DOI] [PMC free article] [PubMed] [Google Scholar]
- 12.Garcia-Ruiz C, Morales A, Ballesta A, Rodes J, Kaplowitz N, Fernandez-Checa J C. J Clin Invest. 1994;94:193–201. doi: 10.1172/JCI117306. [DOI] [PMC free article] [PubMed] [Google Scholar]
- 13.Meissner H C, Schlievert P M, Leung D Y. Immunol Rev. 1994;139:109–123. doi: 10.1111/j.1600-065x.1994.tb00859.x. [DOI] [PubMed] [Google Scholar]
- 14.Debre P, Waltenbaugh C, Dorf M E, Benacerraf B. J Exp Med. 1976;144:277–281. doi: 10.1084/jem.144.1.277. [DOI] [PMC free article] [PubMed] [Google Scholar]
- 15.Chiorazzi N, Fox D A, Katz D H. J Immunol. 1976;117:1629–1637. [PubMed] [Google Scholar]
- 16.Bass H, Mosmann T, Strober S. J Exp Med. 1989;170:1495–1511. doi: 10.1084/jem.170.5.1495. [DOI] [PMC free article] [PubMed] [Google Scholar]
- 17.Lieber C S. Adv Pharmacol. 1997;38:601–628. doi: 10.1016/s1054-3589(08)61001-7. [DOI] [PubMed] [Google Scholar]
- 18.Suthanthiran M, Anderson M E, Sharma V K, Meister A. Proc Natl Acad Sci USA. 1990;87:3343–3477. doi: 10.1073/pnas.87.9.3343. [DOI] [PMC free article] [PubMed] [Google Scholar]
- 19.Calabresi P, Parks R E., Jr . In: Goodman and Gilman’s Pharmacological Basis of Therapeutics. Goodman A G, Goodman L S, Rall T W, Murad F, editors. New York: Macmillan; 1985. pp. 1247–1306. [Google Scholar]
- 20.Bump E A, Brown J M. Pharmacol Ther. 1990;47:117–136. doi: 10.1016/0163-7258(90)90048-7. [DOI] [PubMed] [Google Scholar]
- 21.Packer L, Cadenas E. In: Biothiols in Health and Disease. Packer L, Fuchs J, editors. Vol. 2. New York: Dekker; 1995. [Google Scholar]
- 22.Lieber C S. Semin Liver Dis. 1993;13:136–153. doi: 10.1055/s-2007-1007345. [DOI] [PubMed] [Google Scholar]
- 23.Murphy K M, Heimberger A B, Loh D Y. Science. 1990;250:1720–1723. doi: 10.1126/science.2125367. [DOI] [PubMed] [Google Scholar]
- 24.Schodde H, Hurst S, Munroe M, Barrett T, Waltenbaugh C. Alcohol Clin Exp Res. 1996;20:890–899. doi: 10.1111/j.1530-0277.1996.tb05268.x. [DOI] [PubMed] [Google Scholar]
- 25.Tietze F. Anal Biochem. 1969;27:502–522. doi: 10.1016/0003-2697(69)90064-5. [DOI] [PubMed] [Google Scholar]
- 26.Short S, Merkel B J, Caffrey R, McCoy K L. Eur J Immunol. 1996;26:3015–3020. doi: 10.1002/eji.1830261229. [DOI] [PubMed] [Google Scholar]
- 27.Collins D S, Unanue E R, Harding C V. J Immunol. 1991;147:4054–4059. [PubMed] [Google Scholar]
- 28.Allen P M, Unanue E R. J Immunol. 1984;132:1077–1079. [PubMed] [Google Scholar]
- 29.Wedner H J, Simchowitz L, Stenson W F, Fischman C M. J Clin Invest. 1981;68:535–543. doi: 10.1172/JCI110285. [DOI] [PMC free article] [PubMed] [Google Scholar]
- 30.Trinchieri G, Wysocka M, D’Andrea A, Rengaraju M, Aste-Amezaga M, Kubin M, Valiante N M, Chehimi J. Prog Growth Factor Res. 1992;4:355–368. doi: 10.1016/0955-2235(92)90016-b. [DOI] [PubMed] [Google Scholar]
- 31.Wenner C A, Guler M L, Macatonia S E, O’Garra A, Murphy K M. J Immunol. 1996;156:1442–1447. [PubMed] [Google Scholar]
- 32.Waltenbaugh C, Mikszta J, Ward H, Hsiung L. Alcohol Clin Exp Res. 1994;18:1–7. doi: 10.1111/j.1530-0277.1994.tb00872.x. [DOI] [PubMed] [Google Scholar]
- 33.Colvin M. In: Pharmacologic Principles of Cancer Treatment. Chabner B A, editor. Philadelphia: Saunders; 1982. pp. 276–308. [Google Scholar]
- 34.Jeannin P, Delneste Y, Lecoanet-Henchoz S, Gauchat J F, Life P, Holmes D, Bonnefoy J Y. J Exp Med. 1995;182:1785–1792. doi: 10.1084/jem.182.6.1785. [DOI] [PMC free article] [PubMed] [Google Scholar]
- 35.Mizuochi T, Yee S T, Kasai M, Kakiuchi T, Muno D, Kominami E. Immunol Lett. 1994;43:189–193. doi: 10.1016/0165-2478(94)90221-6. [DOI] [PubMed] [Google Scholar]
- 36.Ahn H J, Maruo S, Tomura M, Mu J, Hamaoka T, Nakanishi K, Clark S, Kurimoto M, Okamura H, Fujiwara H. J Immunol. 1997;159:2125–2131. [PubMed] [Google Scholar]
- 37.Staal F J, Roederer M, Herzenberg L A, Herzenberg L A. Ann N Y Acad Sci. 1992;651:453–463. doi: 10.1111/j.1749-6632.1992.tb24645.x. [DOI] [PubMed] [Google Scholar]
- 38.Droge W. Pharmacology. 1993;46:61–65. doi: 10.1159/000139029. [DOI] [PubMed] [Google Scholar]
- 39.Kawabata T T, Chapman M Y, Kim D H, Stevens W D, Holsapple M P. Biochem Pharmacol. 1990;40:927–935. doi: 10.1016/0006-2952(90)90476-2. [DOI] [PubMed] [Google Scholar]
- 40.Robinson M K, Rodrick M L, Jacobs D O, Rounds J D, Collins K H, Saporoschetz I B, Mannick J A, Wilmore D W. Arch Surg. 1993;128:29–34. doi: 10.1001/archsurg.1993.01420130033006. [DOI] [PubMed] [Google Scholar]
- 41.Rodgers D A. Psychosom Med. 1966;28:498–513. doi: 10.1097/00006842-196601000-00005. [DOI] [PubMed] [Google Scholar]
- 42.Storer J B. In: Biology of the Laboratory Mouse. Green E L, editor. The Jackson Laboratory; 1966. pp. 427–446. [Google Scholar]
- 43.Uhlig S, Wendel A. Life Sci. 1992;51:1083–1094. doi: 10.1016/0024-3205(92)90509-n. [DOI] [PubMed] [Google Scholar]
- 44.Richie J P., Jr Exp Gerontol. 1992;27:615–626. doi: 10.1016/0531-5565(92)90015-r. [DOI] [PubMed] [Google Scholar]
- 45.Staal F J, Roederer M, Israelski D M, Bubp J, Mole L A, McShane D, Deresinski S C, Ross W, Sussman H, Raju P A, et al. AIDS Res Hum Retroviruses. 1992;8:305–311. doi: 10.1089/aid.1992.8.305. [DOI] [PubMed] [Google Scholar]
- 46.Herzenberg L A, De Rosa S, Dubs J G, Roederer M, Anderson M T, Ela S W, Deresinski C, Herzenberg L A. Proc Natl Acad Sci USA. 1997;94:1967–1972. doi: 10.1073/pnas.94.5.1967. [DOI] [PMC free article] [PubMed] [Google Scholar]