

Summary
Nutrient availability is one of the strongest determinants of cell size. When grown in rich media, single-celled organisms such as yeast and bacteria can be up to twice the size of their slow growing counterparts. The ability to modulate size in a nutrient-dependent manner requires cells to 1) detect when they have reached the appropriate mass for a given growth rate and 2) transmit this information to the division apparatus. We report the identification of a metabolic sensor that couples nutritional availability to division in Bacillus subtilis. A key component of this sensor is an effector, UgtP, which localizes to the division site in a nutrient-dependent manner and inhibits assembly of the tubulin-like cell division protein FtsZ. This sensor serves to maintain a constant ratio of FtsZ rings to cell length regardless of growth rate and ensures that cells reach the appropriate mass and complete chromosome segregation prior to cytokinesis.
Introduction
Cell size control is a fundamental yet poorly understood aspect of the cell cycle. All organisms coordinate division with growth to ensure that cells are the appropriate size for a given environmental condition or developmental fate. For many single-celled organisms, nutrient availability has the strongest influence on cell size. For example, yeast and bacteria are significantly larger in nutrient-rich media than in nutrient-poor media (Fantes and Nurse, 1977; Schaechter et al., 1958). In eukaryotes, proteins such as Wee1 and Cdc25 are responsible for cell size homeostasis (Jorgensen and Tyers, 2004; Russell and Nurse, 1987). In prokaryotes, however, little is known about the regulatory pathways governing cell size.
Bacillus subtilis cells growing in rich medium are approximately twice the length of cells cultured under nutrient-poor conditions (Sargent, 1975). Escherichia coli and Salmonella typhimurium also exhibit similar growth rate dependent changes in cell size (Donachie and Begg, 1989; Schaechter et al., 1958). Cell size stabilizes, however, under slow growth conditions. When the time it takes for cells to double in mass increases beyond a certain threshold (~60 minutes for B. subtilis), cell size becomes essentially constant (Sargent, 1975).
Growth rate dependent increases in cell size in bacteria are correlated with increases in DNA content generated by multifork replication. Multifork replication allows rapidly growing cells to sustain division cycle times that are shorter than the period required to complete chromosome replication and division [<55 minutes for B. subtilis (Sharpe et al., 1998)]. During multifork replication new rounds of DNA replication are initiated prior to completion of the previous round and cells are “born” with active replication forks (Cooper and Helmstetter, 1968). Thus, B. subtilis and E. coli cells grown in rich medium have four or even eight replication forks proceeding simultaneously and it is under these conditions that cell size becomes proportional to growth rate. In contrast, in nutrient-poor medium when the mass doubling time exceeds the time required to complete both chromosome replication and division [>55 minutes for B. subtilis (Sharpe et al., 1998)], there are never more than two replication forks in a cell and newborn cells have a single copy of the chromosome.
Increasing cell size during rapid growth may be a means of ensuring that division is coordinated with segregation of the fully replicated chromosome or nucleoid. B. subtilis cells maintain a constant ratio of cell mass to DNA content over a wide range of growth rates (Sharpe et al., 1998) and both E. coli and B. subtilis cells need to achieve a critical length prior to initiating chromosome segregation (Donachie and Begg, 1989; Sargent, 1975; Sharpe et al., 1998).
The mechanisms responsible for coordinating cell size with growth rate in bacteria likely exert their effect by modulating assembly of the highly conserved, tubulin-like GTPase FtsZ. In bacteria, archaea, chloroplasts and the mitochondria of certain algae, FtsZ self-assembles into a ring that establishes the location of the division site and serves as a framework for assembly of the division apparatus (Margolin, 2005). Growth rate affects both the timing of FtsZ assembly and the period between FtsZ ring formation and cytokinesis (the Z-period) (Den Blaauwen et al., 1999; Weart and Levin, 2003). A handful of proteins modulate the position or stability of the FtsZ ring (Margolin, 2005; Romberg and Levin, 2003), none of which appear to play a direct role in controlling either the timing of FtsZ assembly or the coupling of cell division to cell mass.
Here we show that a conserved metabolic pathway, glucolipid biosynthesis, functions as a metabolic sensor to coordinate cell size with growth rate in B. subtilis. This pathway transduces nutritional information directly to the division apparatus, delaying division until cells reach the appropriate mass for a given growth rate (defined here as “critical mass”). A key component of this pathway is an effector, the glucosyltransferase UgtP, which inhibits FtsZ assembly in vitro and modulates FtsZ ring formation in vivo. Importantly, both UgtP expression and localization to the nascent division site are dependent on nutrient availability, rendering division inhibition sensitive to growth rate. Defects in this metabolic sensor result in the formation of unusually small daughter cells and perturb the coupling of FtsZ ring assembly, cell division and chromosome segregation.
Results
B. subtilis cells maintain a constant ratio of length per FtsZ ring regardless of growth rate
Bacteria control the timing of FtsZ assembly to coordinate division with mass doubling time. (Weart and Levin, 2003). Somewhat paradoxically, despite dividing more frequently, fast growing cells can be up to twice as long as their slow growing counterparts (Sargent, 1975). Based on these observations, we sought to determine if there was a relationship between growth rate, cell length, and FtsZ ring formation.
Consistent with previous results (Weart and Levin, 2003), the proportion of cells with FtsZ rings varied inversely with doubling time, ranging from ~85% in LB to ~50% in minimal sorbitol (Figure 1A). Cells were significantly longer in rich medium (median=4.7 μm in LB, n=524) versus nutrient-poor medium (median=2.3 μm in minimal sorbitol, n=163), in agreement with earlier studies (Sargent, 1975; Sharpe et al., 1998). In support of previous work (Sharpe et al., 1998), we confirmed that B. subtilis cells maintain a constant diameter over a broad range of growth rates (Figure S1A and B). Thus, length is directly proportional to cell mass.
Figure 1. A regulator of FtsZ assembly that couples division to cell mass.
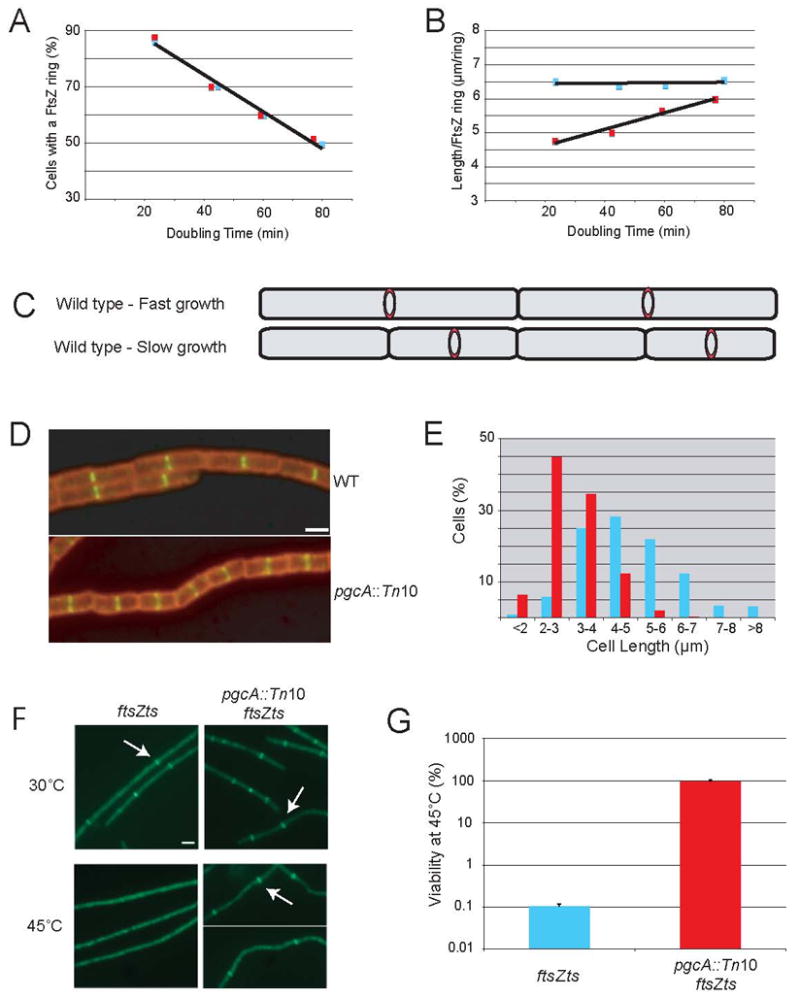
Wild type (blue) and pgcA::Tn10 (red) cells were grown in LB, minimal glucose, minimal glycerol and minimal sorbitol to produce a range of doubling times. The percentage of cells displaying an FtsZ ring and the average length per FtsZ ring (L/R) were determined for both strains under all conditions. (A) The incidence of FtsZ ring formation was identical for wild type (blue) and pgcA::Tn10 mutant cells (red) cultured in four different growth conditions. (B) The L/R ratio for wild type cells (blue) is constant regardless of growth rate. In contrast, the L/R ratio for pgcA::Tn10 cells (red) increases as a function of doubling time and differs significantly from wild type (P < 0.001). (C) Cartoon depicting constant L/R ratio in fast and slow growing cells. (D) Wild type and pgcA::Tn10 cells after growth in LB. Cell wall - red, FtsZ - green. Bar = 2 μm. (E) Histogram of wild type (blue) and pgcA::Tn10 (red) cell lengths after growth in LB. pgcA::Tn10 cells were significantly shorter than wild type cells (P < 0.001). (F) pgcA+ cells bearing the ftsZts allele (ftsZ-gfp) form FtsZ rings at 30° C but not at 45° C. Disruption of pgcA restores FtsZ ring assembly to ftsZts cells at 45° C. Arrows indicate examples of FtsZ rings. Bar = 2 μm. (G) Disruption of pgcA restores viability ~1000-fold to ftsZts cells at 45° C. Error bars = standard deviation.
We next determined the average cell length per FtsZ ring (L/R) at each growth rate. We calculated the sum of lengths from ~250 cells sampled from each culture condition and counted the total number of FtsZ rings in each population. Dividing the sum of cell lengths by the total number of FtsZ rings gave us the L/R ratio. Remarkably, we found that the L/R ratio remained constant regardless of growth rate (Figure 1B and C). The L/R ratio was 6.5 μm/ring for cells grown in either rich or poor media despite an approximately two-fold difference in both cell size and the incidence of FtsZ ring formation (Figure 1A). These results indicate that cells not only alter the frequency of division in response to changes in mass doubling time, but they also coordinate FtsZ ring formation with cell growth to maintain cell size homeostasis.
Identification of pgcA, a regulator of FtsZ assembly that couples cell division to cell mass
Maintaining a constant L/R ratio under different growth conditions requires cells to detect when they have reached critical mass for a particular growth rate and transmit this information to the division apparatus. We previously conducted a large-scale, transposon-based screen for inhibitors of FtsZ assembly in B. subtilis (Weart et al., 2005). [In vivo FtsZ ring formation most likely involves both the formation of single stranded polymers and the assembly of these polymers into stable bundles via lateral interactions (Romberg and Levin, 2003). We therefore use “FtsZ assembly” as a general term to refer to both steps in FtsZ ring formation.] We reasoned that some of the mutations isolated in this screen might identify genes responsible for coupling division to cell mass. Accordingly, we examined candidate Tn10 insertion strains to identify those exhibiting significantly altered cell size (wild type ± 15%) and normal FtsZ localization. This second criterion is important since mutations that disrupt FtsZ localization (e.g. insertions in minCD and ezrA) result in abnormally long cells and distort the L/R ratio without directly affecting the control of FtsZ assembly at midcell (Levin et al., 1998; Levin et al., 1999).
One gene identified in the screen, pgcA, met these criteria. pgcA encodes a phosphoglucomutase (PGM) that catalyzes the interconversion of glucose-6-phosphate (Glc-6-P) and glucose-1-phosphate (Glc-1-P) (Figure 2A). pgcA homologs are found in all domains of life. A Tn10 insertion in the first third of pgcA eliminated PGM activity (Figure 2B) and resulted in cells that were ~35% shorter than wild type cells following growth in LB, yet maintained normal FtsZ localization (Figure 1D and E). The mass doubling time of pgcA mutants was comparable to wild type cells, indicating that their reduced size was not due to growth defects (Figure 1A). Based on its loss of function phenotype as well as its role in sugar metabolism, we speculated that PgcA might be involved in communicating information regarding nutrient availability to the division apparatus in order to coordinate cell size with growth rate.
Figure 2. The last enzyme in the glucolipid biosynthesis pathway, UgtP, is an inhibitor of FtsZ assembly and cell division.

(A) Simplified schematic of glucose utilization in B. subtilis. Enzymes (bold) were tested for their role in regulating FtsZ assembly and cell division. Only enzymes involved in glucolipid biosynthesis (*) were required for coupling FtsZ assembly and cell division to cell mass. (B) PgcA activity as measured by the conversion of Glc-1-P to Glc-6-P (Lazarevic et al., 2005). PgcA activity in the lysates of wild type cells cultured in LB and minimal sorbitol were 25.1 ± 0.6 and 12.9 ± 0.7 nmol min−1 mg−1 respectively. There was no detectable PgcA activity in pgcA::Tn10 and pgcA(S146A) lysates from LB cultures. (C) Micrographs of various strains. Mutations in the DiGlcDAG biosynthesis pathway result in abnormally short cells (P < 0.001). Bar = 2 μm. (D) Mutations that disrupt the synthesis of DiGlcDAG suppress the lethality of minCD overexpression. Error bars = standard deviations. (E) Cell size increases with increasing levels of UgtP. Histogram of cell lengths for cells encoding ugtP::cat (n=154, light grey), ugtP-his (n=147, dark grey) and ugtP-his thrC::Pxyl-ugtP-his (n=192, black) following growth in LB plus 0.5% xylose. Cells expressing ugtP-his from the native ugtP promoter displayed wild type cell length, whereas cells overexpressing ugtP-his ~8.5-fold from the xylose-inducible Pxyl promoter were ~22% longer (P < 0.001).
pgcA is a genetic inhibitor of FtsZ assembly
In the absence of a growth rate defect, the reduced size of pgcA mutants suggests that PgcA normally inhibits FtsZ assembly through direct or indirect interactions. We confirmed this hypothesis in two ways. First, a loss of function mutation in pgcA (pgcA::Tn10) suppressed the heat sensitivity of an ftsZts (ftsZ-gfp) allele, restoring both FtsZ ring formation and cell division to ftsZts cells grown at 45°C (Figure 1F and G). Second, similar to mutations in other inhibitors of FtsZ assembly (Levin et al., 2001; Weart et al., 2005), a pgcA::Tn10 mutation suppressed the general block in cell division and lethality associated with >12-fold overexpression of the FtsZ assembly inhibitor MinCD (Figure 2D). The loss of pgcA did not interfere with the overexpression of MinCD, as indicated by MinD immunoblot (Figure S2A). FtsZ levels were also unaffected in pgcA::Tn10 cells (Figure S2B), supporting the idea that PgcA modulates FtsZ assembly dynamics rather than ftsZ expression or protein stability.
pgcA mutants fail to maintain a constant L/R ratio across different growth conditions
To ascertain whether the size defect of pgcA::Tn10 cells was due to an inability to coordinate FtsZ assembly with cell size, we determined the L/R ratio in pgcA mutant cells under a variety of growth conditions. Strikingly, we found that pgcA::Tn10 mutants had lost the ability to maintain a constant L/R ratio over a range of mass doubling times (Figure 1B). This situation was particularly pronounced during rapid growth, where the L/R value was ~4.8 μm/ring in pgcA mutants versus ~6.5 μm/ring for wild type cells. During slow growth the L/R ratio for pgcA mutants was ~6.0 μm/ring, suggesting that PgcA’s role in cell size homeostasis is largely dispensable in nutrient poor medium. Significantly, the percentage of cells with an FtsZ ring was unperturbed in pgcA mutants (Figure 1A), indicating that the timing of FtsZ assembly and the duration of the Z-period are normal in a steady state population (Den Blaauwen et al., 1999; Weart and Levin, 2003).
Defects in UDP-glucose synthesis are responsible for the pgcA cell division phenotype
PgcA serves as a bridge between glycolysis and glycosylation by interconverting Glc-6-P and Glc-1-P (Figure 2A). To understand how this metabolic enzyme and its products are involved in coordinating FtsZ assembly with critical mass, we examined FtsZ assembly dynamics and cell size in strains encoding mutations in pgcA and related pathways.
We first established that the enzymatic activity of PgcA was required for its ability to modulate FtsZ assembly by engineering a point mutation in the catalytic phosphoserine of PgcA, S146 (Shackelford et al., 2004). Although stably expressed (data not shown), lysates from the pgcA(S146A) strain possessed no detectable PGM activity (Figure 2B). pgcA(S146A) mutants were phenotypically identical to pgcA::Tn10 cells with regard to both reduced cell size (data not shown) and suppression of MinCD induced lethality (Figure 2D) demonstrating that the catalytic activity of PgcA is important for its role in cell size homeostasis.
Given PgcA’s role as a link between glycolysis and glycosylation (Figure 2A), we next determined if defects in either pathway were responsible for the pgcA cell division phenotype. We found that defects in pgi, whose gene product phosphohexose isomerase catalyzes the conversion of Glc-6-P to fructose-6-phosophate (Frc-6-P) during the first step of glycolysis, had no detectable effect on FtsZ assembly dynamics (Figure 2D). In contrast, a null mutation in gtaB (gtaB::spc), which is required to convert Glc-1-P to uridine-5′-diphosphoglucose (UDP-Glc) resulted in reduced cell size and suppressed MinCD induced lethality (Figure 2C and D). The loss of gtaB did not prevent the accumulation of MinCD, as indicated by MinD immunoblot, nor did it affect FtsZ levels (Figure S2A and B). These results indicate that the cell division defect associated with mutations in pgcA is due to the loss of an enzyme involved in glycosylation.
Enzymes in the glucolipid biosynthesis pathway couple division to cell mass
UDP-Glc is involved in the biosynthesis of the three types of teichoic acids that constitute the major anionic polymers in the Gram-positive cell envelope (Figure 2A) (Lazarevic et al., 2005). To identify the proximal cause of the pgcA::Tn10 cell division defect, we systematically tested null mutations in the three sugar transferases implicated in teichoic acid biosynthesis -- ugtP, tagE, and ggaAB -- for defects in FtsZ assembly and cell size.
Of the three sugar transferases, we found that only ugtP, which encodes the transferase responsible for synthesis of the diglucosyl diacylglycerol (DiGlcDAG) anchor for lipoteichoic acid (LTA), was a genuine inhibitor of FtsZ assembly. Not only did ugtP::cat suppress the lethality associated with MinCD overexpression, but ugtP mutant cells were also ~20% shorter than wild type B. subtilis (Figure 2C and D). The loss of ugtP did not prevent the accumulation of MinCD, as shown by MinD immunoblot, nor did it affect FtsZ levels (Figure S2A and B). Cell length was normal in ggaAB and tagE mutants and neither mutation suppressed MinCD induced lethality (Figure 2C and D). The reduced size of ugtP::cat cells is consistent with previous data (Price et al., 1997). The L/R ratio of ugtP::cat cells during growth in rich medium was intermediate between wild type and pgcA mutant cells at ~5.6 μm/ring and suppression of MinCD overexpression by ugtP::cat was one log unit less efficient than pgcA::Tn10 (Figure 2D). It is therefore likely that an additional UDP-Glc sensitive factor also modulates FtsZ assembly. Epistasis and complementation experiments indicate that all three genes--pgcA, gtaB and ugtP--act in concert to regulate FtsZ assembly (Figure S3A and B).
LTA is still present in ugtP mutants (Lazarevic et al., 2005) and a mutation that altered LTA structure (dlt::spc) (Cao and Helmann, 2004) did not alter FtsZ assembly dynamics (Figure 2D). Defects in LTA structure or stability are thus unlikely to be responsible for the cell division defect associated with mutations in the glucolipid biosynthesis pathway. With the exception of cell length, pgcA, gtaB and ugtP mutants were morphologically wild type in our hands (Figure 2C) despite reports of magnesium-dependent defects in cell shape (Lazarevic et al., 2005), presumably due to contaminating levels of magnesium in our growth medium. The diameters of pgcA, gtaB, and ugtP mutants were on par with wild type cells (Figure S1A and B).
UgtP inhibits FtsZ assembly in vitro
Of the three enzymes in the glucolipid biosynthesis pathway, UgtP is the best candidate for a direct regulator of FtsZ assembly. A membrane-associated protein, UgtP has been shown to localize to the division septum (Nishibori et al., 2005) supporting a model in which it inhibits FtsZ assembly through direct interactions. Consistent with this model, ~8.5-fold overexpression of a functional UgtP-his allele increased cell length ~22% (Figure 2E, Figure S2C).
To test whether UgtP inhibits FtsZ assembly directly, we examined the effect of UgtP on FtsZ assembly in vitro. For these experiments we employed native B. subtilis FtsZ and a thioredoxin-UgtP-6XHis fusion protein (Thio-UgtP). FtsZ assembly was measured using a 90° angle light scattering assay (Mukherjee and Lutkenhaus, 1999).
Using this approach we determined that UgtP inhibited FtsZ assembly in a concentration-dependent manner with ~90% inhibition at a 1:1 ratio of Thio-UgtP to FtsZ (Figure 3A and B). Thio-UgtP was able to inhibit FtsZ assembly at ratios as low as 1:5 (Figure 3B). The absence of UgtP’s substrate, UDP-Glc, resulted in a small but statistically significant reduction in its ability to inhibit FtsZ assembly in vitro (Figure 3C). Adding 6μM Thioredoxin-his or BSA had no effect on FtsZ assembly (Figure 3D). Quantitative immunoblotting indicated that there are ~2400 molecules of UgtP per cell in LB (Figure S2D). FtsZ is estimated to be at a concentration of ~5000 molecules per cell (Feucht et al., 2001). Thus, UgtP inhibits FtsZ assembly at ratios that are consistent with physiological concentrations.
Figure 3. UgtP inhibits FtsZ assembly in vitro.
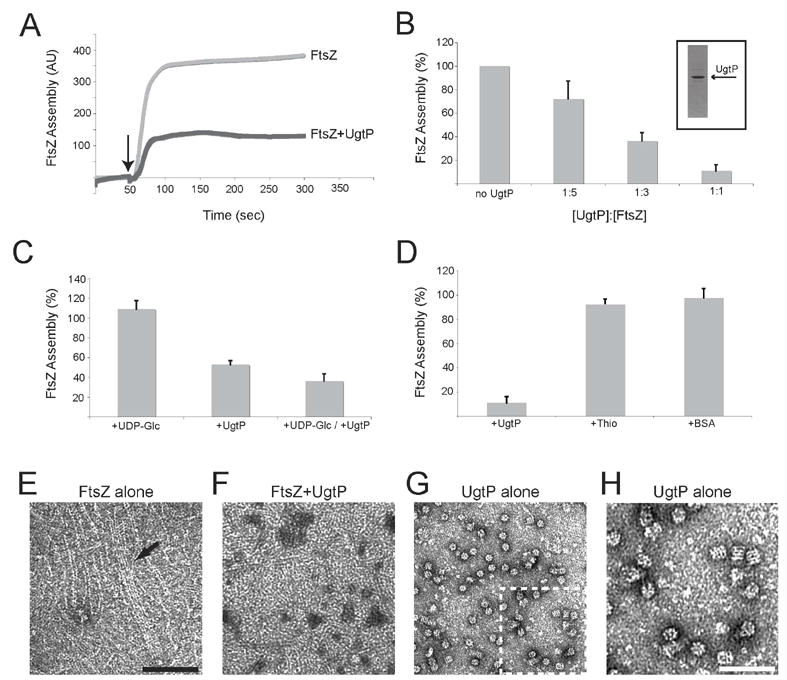
(A–D) Thio-UgtP blocks FtsZ assembly in a 90° angle light scattering assay. FtsZ is at 6 μM in all reactions. Unless noted, all reactions contain 1 mM UDP-Glc and 1 mM GTP. Error bars = standard deviations. FtsZ assembly in (B–D) is expressed as the assembly of FtsZ in the presence of the component indicated relative to the absence of the component indicated. (A) A representative light scattering trace showing FtsZ assembly ± 2 μM Thio-UgtP. AU = arbitrary units. Arrow indicates addition of 1 mM GTP. (B) Concentration-dependent inhibition of FtsZ assembly by UgtP. The ratio of Thio-UgtP to FtsZ is shown beneath each bar. Purified Thio-UgtP is shown inset. (C) Inhibition of FtsZ assembly by 2 μM Thio-UgtP is only mildly stimulated by 1mM UDP-Glc. (D) FtsZ assembly in the presence of either 6 μM Thio-UgtP, Thioredoxin-his, or BSA. (E–H) Electron micrographs of FtsZ and UgtP. FtsZ is 2 μM and Thio-UgtP is 1 μM. All reactions were conducted in the presence of 1 mM UDP-Glc and 1 mM GTP. Bar = 100 nm for (E–G) and 50 nm for (H). (E) FtsZ alone. Arrow indicates bundle of polymers running the length of the micrograph. (F) FtsZ assembled in the presence of Thio-UgtP. Only short polymers are present and little bundling is observed. (G) Thio-UgtP oligomers formed in the absence of FtsZ. The selected region in (G) is shown at 2-fold greater magnification in (H).
Electron micrographs of FtsZ assembled in the presence and absence of UgtP suggest that UgtP interferes with stabilizing lateral interactions between single stranded protofilaments. In the absence of UgtP, FtsZ formed large bundled structures, the consequence of lateral interactions between protofilaments (Figure 3E). However, we observed very few bundles at a 1:2 ratio of UgtP to FtsZ and protofilaments were significantly shorter, consistent with a decrease in polymer stability (Figure 3F). Intriguingly, UgtP itself formed higher order structures in FtsZ assembly buffer (Figure 3G and H). These structures, which appear to consist of closely stacked spirals of UgtP monomers (7 or 8 per turn), were less prevalent in the presence of FtsZ (Figure 3F), suggesting that UgtP inhibition of FtsZ assembly occurs at the expense of UgtP self-assembly. UgtP oligomerization was independent of UDP-Glc and GTP (data not shown).
Nutrient availability modulates UgtP levels and localization
In vivo the glucolipid biosynthesis pathway exerts its strongest effect on cell size under nutrient-rich conditions (Figure 1B), suggesting it functions as a growth rate dependent inhibitor of cell division. To determine the mechanism responsible for nutrient-dependent division inhibition, we examined UgtP expression and localization under nutrient-rich and nutrient-poor conditions.
Quantitative immunoblotting of lysate from cells encoding a functional ugtP-his allele under the control of the native ugtP promoter, indicated that full length UgtP levels are reduced ~6-fold in nutrient-poor minimal sorbitol relative to nutrient-rich LB (Figure 4A). The presence of a UgtP degradation product in cells cultured in minimal sorbitol (Figure 4A) suggests that nutrient-dependent regulation of UgtP levels may be post-transcriptional.
Figure 4. Localization of the division inhibitor UgtP is dependent on UDP-Glc levels and FtsZ.
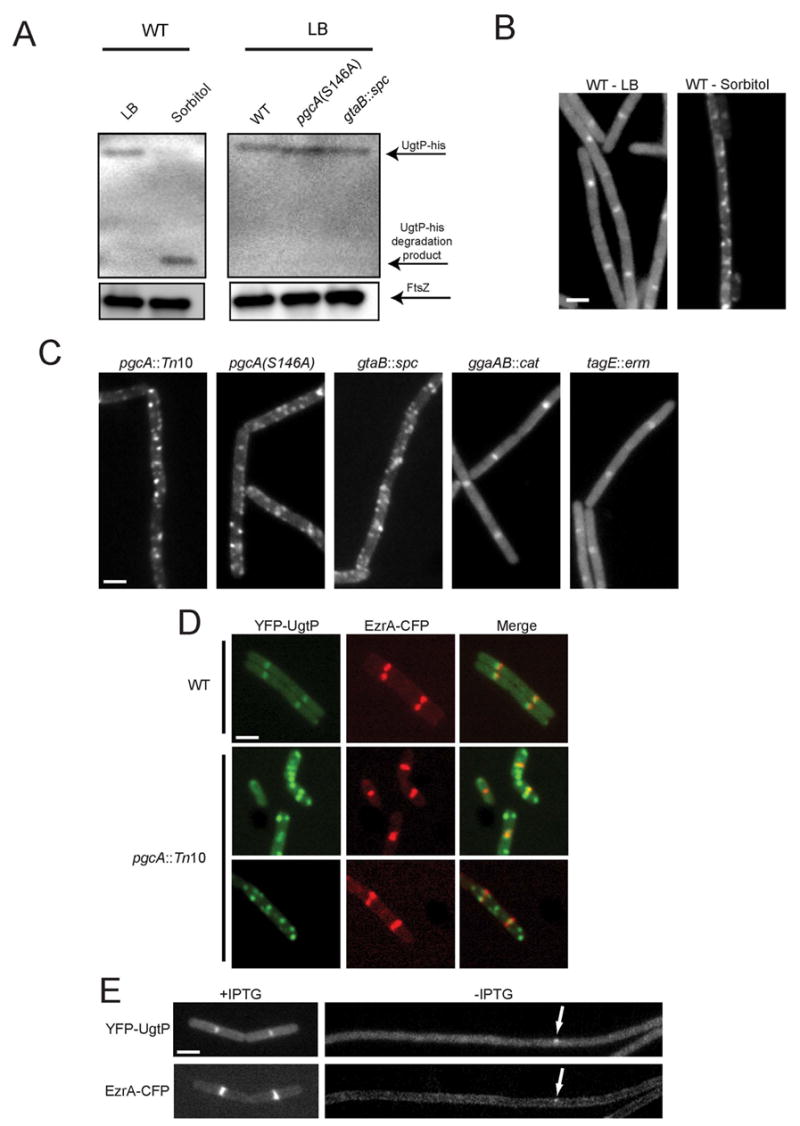
(A) Quantitative immunoblot of UgtP-his (top arrow) expressed from the native ugtP promoter. UgtP levels were ~6-fold lower in cells cultured in minimal sorbitol relative to LB (left). Middle arrow indicates UgtP degradation product in minimal sorbitol. UgtP-his levels were not decreased in pgcA(S146A) or gtaB::spc cells relative to wild type cells when grown in LB (right). FtsZ (bottom arrow) is shown as a loading standard. (B) YFP-UgtP localizes to midcell and the poles of wild type cells cultured in LB (left) but shows a punctate localization pattern and decreased cytoplasmic staining in minimal sorbitol (right). (C) YFP-UgtP localization in various strains cultured in LB. The loss of pgcA results in a punctate UgtP localization pattern similar to that observed in wild type cells cultured in minimal sorbitol. (D) Colocalization YFP-UgtP and EzrA-CFP in cells cultured in LB: YFP-UgtP (left), EzrA-CFP (middle), merged image (right). Wild type (top row), pgcA::Tn10 (bottom rows). In contrast to wild type cells, YFP-UgtP foci typically do not co-localize with EzrA-CFP in the pgcA mutants. (E) YFP-UgtP (top) and EzrA-CFP (bottom) localization in cells cultured in LB before (left) and after (right) FtsZ depletion. YFP-UgtP is diffusely cytoplasmic in the absence of FtsZ. Occasional remaining foci of YFP-UgtP (top arrow) correspond to remaining foci of EzrA-CFP (bottom arrow). Bars = 2 μm.
To further explore the growth rate regulation of UgtP activity, we localized a functional YFP-UgtP fusion in cells cultured in nutrient-rich and nutrient-poor medium. Consistent with previous results (Nishibori et al., 2005), YFP-UgtP was evenly distributed in the cytoplasm and concentrated at midcell in exponentially growing cells cultured in nutrient-rich medium (Figure 4B left). In cells cultured in minimal sorbitol, however, the majority of YFP-UgtP appeared to be sequestered in randomly distributed foci (Figure 4B right) where it is presumably unable to modulate FtsZ assembly. In contrast to YFP-UgtP, a functional PgcA-GFP fusion was distributed uniformly throughout the cytoplasm (data not shown).
Genetic analyses suggested that PgcA and GtaB exert their effect on FtsZ by controlling the synthesis of UgtP’s substrate UDP-Glc (Figure 2 and Figure S3B). PGM activity was reduced 2-fold in cells cultured in minimal sorbitol relative to those cultured in LB (Figure 2B). The reduction in PGM activity correlates with reduced UgtP localization to the septum and reduced division inhibition, supporting the idea that UDP-Glc synthesis might modulate UgtP activity. Since UDP-Glc did not have a potent effect on the ability of UgtP to inhibit FtsZ assembly in vitro (Figure 3D), we determined if PgcA and GtaB were required for UgtP production or localization in vivo.
While the loss of PgcA or GtaB did not prevent the accumulation of UgtP (Figure 4A), it did interfere with UgtP localization (Figure 4C). We observed punctate YFP-UgtP localization in pgcA::Tn10, pgcA(S146) and gtaB::spc mutant cells cultured in LB, similar to the pattern we observed in wild type cells cultured in minimal sorbitol (Figure 4B). YFP-UgtP levels were not affected by the pgcA and gtaB mutations (Figure S2E). YFP-UgtP localization was normal in ggaAB::cat and tagE::erm cells (Figure 4C). Co-localization of YFP-UgtP and a CFP fusion to the cell division protein EzrA [which functions as a proxy for FtsZ localization (Levin et al., 1999; Wu and Errington, 2004)] confirmed that 84% (42/50) of UgtP foci co-localize with FtsZ at midcell in wild type cells. In contrast, the majority of UgtP puncta in pgcA::Tn10 cells (67.2%, 45/67) are not associated with FtsZ (Figure 4D).
FtsZ depletion experiments demonstrated that YFP-UgtP localization at midcell is dependent on FtsZ (Figure 4E). YFP-UgtP was diffusely cytoplasmic in the absence of FtsZ indicating that the punctate localization pattern is not simply due to an inability to localize to midcell. Together these data indicate that nutrient availability alters both UgtP expression and localization, thereby ensuring that division inhibition is coupled to growth rate.
Coupling FtsZ assembly to cell mass ensures that division is coordinated with nucleoid segregation during multifork replication
The cell size defect of pgcA mutants was greatest under conditions that promote multifork replication (Figure 1B). We therefore speculated that coordinating cell size with growth rate serves to ensure that cells maintain a constant ratio of DNA to cell mass and prevent aberrant septation across unsegregated nucleoids during multifork replication. To test this possibility we examined the position of the FtsZ ring relative to the nucleoid in wild type and pgcA mutant cells. We conducted this analysis in pgcA mutants since they exhibited the greatest defect in cell size.
FtsZ assembly occurs prior to chromosome segregation in pgcA::Tn10 mutants cultured under nutrient-rich conditions (Figure 5A). This result supports a model in which division is initiated before these cells reach the critical mass required for nucleoid separation. In agreement with previous work (Den Blaauwen et al., 1999; Lin et al., 1997), we found that very few FtsZ rings (6.6%; 7/106) were formed over unsegregated nucleoids in wild type cells. In contrast, 23% (29/126) of pgcA mutant cells had an FtsZ ring over unsegregated chromosomal material, a 3.5-fold increase (Figure 5A and C). Notably, the number of FtsZ rings over unsegregated nucleoids approached wild type levels in pgcA::Tn10 mutants cultured in minimal sorbitol with a doubling time of 80 minutes (Figure 5B), suggesting pgcA’s role in division inhibition is dispensable under nutrient-poor conditions. Although nucleoid spacing was decreased by ~38% in the pgcA mutant, nucleoid length was identical to wild type cells (wild type: 1.96 μm, n=50; pgcA::Tn10 = 2.07 μm, n=50), ruling out the possibility that we were miscounting segregated nucleoids as unsegregated.
Figure 5. The loss of pgcA uncouples chromosome segregation from division but does not disrupt nucleoid segregation or DNA replication.

(A and B) The loss of pgcA promotes the formation of FtsZ rings over unsegregated nucleoids in LB (n=126) but not minimal sorbitol (n=59) relative to wild type cells (n=106 for LB, n=55 for minimal sorbitol, p < 0.001). (C) DNA (top) and FtsZ (bottom) in wild type (left) and pgcA::Tn10 (right) cells. Single arrows indicate FtsZ rings over segregated nucleoids. Double arrows indicate FtsZ rings over either unsegregated or partially segregated nucleoids. Bar = 2 μm. (D) Micrographs of pgcA::Tn10 spoIIIE::spc cells displaying chromosome bisection and anucleate phenotypes. Arrows indicate either bisected chromosomes or anucleate cells. Bar = 2 μm. (E) Histogram showing the number of foci of the origin binding protein Spo0J-GFP in wild type (blue, n=87) and pgcA::Tn10 (red, n=88) cells. (F and G) Flow cytometry of wild type and pgcA::Tn10 cells grown in the absence (F) or presence (G) of rifampicin to block replication initiation and cell division indicate that DNA replication is proceeding normally in the mutant strain. (H) Histogram indicating the number and conformation of nucleoids per cell for wild type (blue, n=50) and pgcA::Tn10 (red, n=50) cells. The reduced number of nucleoids in pgcA mutants suggests a delay in nucleoid segregation due to their short stature. (I) pgcA+ and pgcA::Tn10 cells depleted for FtsZ were stained for cell wall (red) and DNA (blue). Length per nucleoid was identical for both strains (~2.5 μm per nucleoid) indicating that nucleoid segregation is normal in the absence of septation in pgcA mutant cells.
We also observed an increase in nucleoid bisection in pgcA mutants, indicative of a defect in coupling division to chromosome segregation. Bisection of unsegregated chromosomes by the division septum is usually an extremely rare event, which we find occurs at a frequency of ≤ 0.087% in our strain background, consistent with previous work (Ireton et al., 1994; Lee and Grossman, 2006). In contrast, chromosome bisection occurred ≥ 5.5-fold more frequently in pgcA mutants cultured in LB (0.5%). The chromosome bisection phenotype of both pgcA::Tn10 and ugtP::cat mutants was enhanced in the presence of a null mutation in the DNA translocase spoIIIE (Figure 5D). SpoIIIE normally rescues chromosomes bisected by the division septa by pumping the trapped chromosomal material into the correct cell; in the absence of spoIIIE trapped chromosomes are severed and degraded, yielding anucleate cells (Britton and Grossman, 1999; Wu and Errington, 1994). Deleting spoIIIE thus has the effect of unmasking latent nucleoid segregation defects. While spoIIIE single mutants exhibited a very low frequency of bisected chromosomes, the chromosome segregation defect was enhanced ≥ 41.8-fold and ≥ 18.2-fold respectively in the presence of a second mutation in either pgcA or ugtP (Table 1). The difference between pgcA::Tn10 and ugtP::cat mutants with regard to chromosome segregation likely reflects the smaller size of pgcA::Tn10 mutant cells.
Table #1.
Bisection of the chromosome by the cell septum
| Genotype | Bisected Chromosomes | Anucleate Cells | Total (Bisected + Anucleate) | Fold Increase (Strain total/Reference total) |
|---|---|---|---|---|
| Wild type* | ≤ 0.087% (0/1156) | ≤ 0.087% (0/1156) | ≤ 0.087% (0/1156) | -- |
| pgcA::Tn10 | 0.48% (3/628) | ≤ 0.16% (0/628) | 0.48% (3/628) | ≥ 5.5-fold |
| spoIIIE::spc* | ≤ 0.061% (0/1634) | ≤ 0.061% (0/1634) | ≤ 0.061% (0/1634) | -- |
| spoIIIE::spc pgcA::Tn10 | 0.99% (7/706) | 1.56% (11/706) | 2.55% (18/706) | ≥ 41.8-fold |
| spoIIIE::spc ugtP::cat | 0.48% (3/630) | 0.63% (4/630) | 1.11% (7/630) | ≥ 18.2-fold |
- reference strain
The primary cell cycle defect in pgcA mutants is an inability to properly coordinate FtsZ ring formation and division with nucleoid segregation. Localization of a GFP fusion to the origin binding protein Spo0J (Lin et al., 1997), suggests that DNA replication is unaffected in pgcA mutants (Figure 5E, Supplemental Results), a situation confirmed by flow cytometry (Figure 5F and G). The short stature of the pgcA mutants appears to impede efficient chromosome segregation as the number of nucleoids per cell was lower in pgcA mutants relative to wild type cells (Figure 5H). However, the length to nucleoid ratio was normal in pgcA mutants depleted for FtsZ [~2.5 μm per nucleoid for both wild type and pgcA::Tn10 cells (Figure 5I)], indicating that nucleoid segregation proceeds normally in the absence of septation.
While it prevents premature division across unsegregated nucleoids, the glucolipid biosynthesis pathway does not appear to modulate FtsZ assembly through a form of nucleoid occlusion, a longstanding model in which the nucleoid and associated factors inhibit FtsZ assembly and cell division along the length of the cell. In contrast to SlmA and Noc, nucleoid occlusion proteins implicated in the spatial control of cell division in E. coli and B. subtilis (Bernhardt and de Boer, 2005; Wu and Errington, 2004), the loss of PgcA was not synthetically lethal with mutations in the positional regulators of FtsZ assembly MinC and MinD, nor was pgcA::Tn10 synthetic with a null mutation in noc itself (data not shown). In addition, although the E. coli pgcA homolog, pgm, has been implicated in maintaining chromosome domain structure (Hardy and Cozzarelli, 2005), we did not detect any evidence of supercoiling defects in pgcA::Tn10 cells following challenge with the antibiotics naladixic acid and novobiocin, indicating that chromosome topology is intact (data not shown).
Discussion
Coordinating cell size with growth rate requires that cells are able to detect nutrient availability and communicate this information to the division apparatus. Our data indicate that B. subtilis has co-opted a dispensable biosynthetic pathway—glucolipid biosynthesis—to act as a direct link between metabolism and cell division (Figure 6A). Based on these results we propose that the first two enzymes in the pathway, PgcA and GtaB, function as a conduit to transmit growth rate information as a function of carbon availability to an effector, the glucosyltransferase UgtP. UgtP in turn, inhibits FtsZ assembly and/or increases the length of the Z period to ensure that cells reach critical mass prior to initiating cytokinesis (Figure 6B). When the glucolipid biosynthesis pathway is intact, division is coupled to critical mass and cells maintain a constant ratio of cell length to FtsZ ring formation regardless of mass doubling time.
Figure 6. A metabolic sensor coupling FtsZ assembly to cell mass and chromosome segregation.
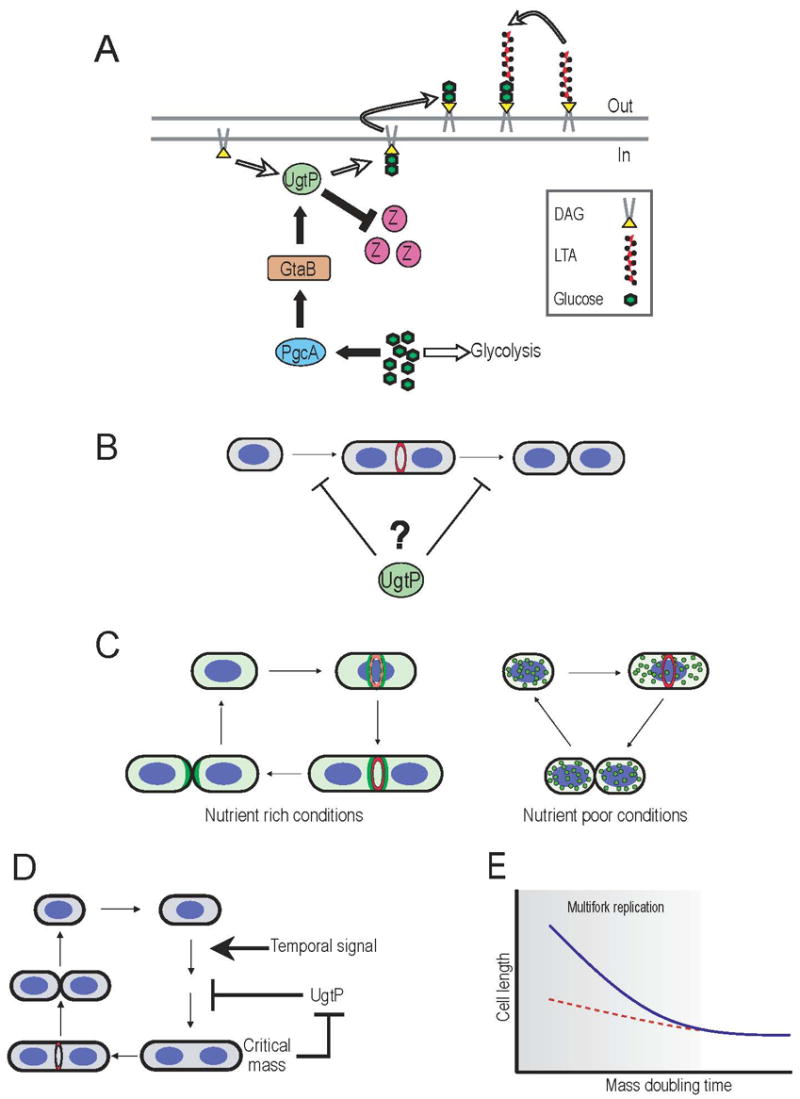
(A) In nutrient-rich media, abundant glucose results in high rates of flux through the glucolipid biosynthesis pathway (black arrows) driving UgtP to the septal site where it inhibits FtsZ assembly and delays maturation of the division apparatus. (B) UgtP delays division in short cells by inhibiting FtsZ assembly and/or extending the length of the Z period (C) Nutrient-dependent localization of UgtP couples maturation of the division apparatus to growth rate. Under nutrient-rich conditions (left), active UgtP (green) is distributed throughout the cytoplasm and concentrates at the cytokinetic ring (red) in an FtsZ-dependent manner. During growth in nutrient-poor medium (right), UgtP expression levels are reduced and the remaining protein is sequestered in randomly positioned foci. (D) A homeostatic circuit coordinates cell size with division on a cell autonomous level. A temporal signal “licenses” a bacterial cell to divide, however, UgtP-dependent inhibition of FtsZ assembly either delays FtsZ ring formation or extends the Z-period until the cell reaches critical mass. Once critical mass is achieved, a second nutrient-dependent sensor relieves division inhibition and permits progression through the remainder of the division cycle. (E) Carbon flow through the glucolipid biosynthesis pathway is responsible for the majority of the increase in cell size under conditions that promote multifork replication (shaded area). Wild type cells (blue line) cultured under nutrient-rich conditions are ~2-fold longer than their slow growing counterparts. In the absence of carbon flow through the glucolipid biosynthesis pathway (dashed red line) cell size remains relatively constant regardless of growth rate.
Our data support a model in which nutrient-dependent changes in UgtP levels, coupled with substrate-dependent localization (Figure 4), coordinate division with growth rate. When cells are cultured in rich media, UgtP is expressed at high levels, distributed throughout the cytoplasm and concentrated at the nascent septum in an FtsZ-dependent manner (Figure 6C left). UgtP may inhibit FtsZ assembly and/or extend the Z period though direct interactions at midcell. Alternatively, medial localization may simply be the result of residual interaction with FtsZ. In the latter case UgtP would likely act to reduce the cytoplasmic pool of FtsZ subunits available for exchange, thereby destabilizing the medial ring. In contrast, during growth on a poor carbon source, UgtP levels are reduced ~6-fold and the remaining protein is sequestered in punctate foci where it presumably has little effect on FtsZ assembly dynamics (Figure 6C right). Changes in UgtP localization are dependent on the intracellular concentration of its substrate, UDP-Glc, as we also observed punctate UgtP localization in pgcA and gtaB mutant cells cultured in rich media (Figure 4C and D).
Because the timing of FtsZ ring formation and the duration of the Z-period are unaffected in a population of cells defective for glucolipid biosynthesis (Figure 1A), we postulate that this system functions on a cell-autonomous level as part of a homeostatic circuit to coordinate size with division. Cells that are born “too short” inhibit FtsZ assembly and/or extend the length of the Z period until they reach critical mass, whereas cells that are longer than average at birth may initiate division earlier (Figure 6B and D). The inability to compensate for reduced size (e.g. in a pgcA mutant) leads to a steady state population of short cells that are otherwise normal for cell division. This system is analogous to the cell-autonomous system governing cell size homeostasis in fission yeast (Fantes and Nurse, 1977).
A circuit coupling growth rate to cell size requires not only nutrient-dependent inhibition of FtsZ assembly mediated through UgtP, but also a sensor for cell mass that relieves UgtP inhibition once cells reach critical mass. Although the identity of such a sensor is not apparent, like UgtP, it must also be sensitive to nutrient availability in order to accurately coordinate cell size with growth rate.
Coordinating division and chromosome segregation
Our results suggest that the primary reason for growth rate dependent increases in cell size is to permit efficient chromosome segregation during multifork replication (Figure 6D). We observed a high frequency of FtsZ assembly over unsegregated nucleoids in pgcA::Tn10 mutants only under conditions that promote multifork replication (Figure 5A, B and C). Moreover, the number of nucleoids per cell was lower in pgcA mutants (Figure 5H) although DNA content was identical to wild type (Figure 5F). Significantly, our data indicate that the presence of an unsegregated nucleoid is insufficient to prevent FtsZ assembly or division at midcell (Figure 5C and D) and argue against a role for the nucleoid as a temporal regulator of medial FtsZ ring formation.
Intriguingly, the timing of DNA replication is normal in pgcA mutants despite their reduced size (Figure 5E, F and G). This result suggests that DNA replication initiates at a lower mass in pgcA mutant cells to compensate for their short stature. The precise mechanism responsible for this reduction in initiation mass has yet to be determined.
While our work establishes the glucolipid biosynthesis pathway as a mechanism for coordinating cell size with nutrient availability under conditions that promote rapid growth, the mechanism(s) responsible for cell size homeostasis under nutrient-poor conditions remains elusive.
A conserved pathway for coupling cell size to growth rate
Strikingly, E. coli cells defective in pgm (the pgcA homolog) are ~70% of wild type length following growth in LB (Lu and Kleckner, 1994), a phenotype almost identical to the one we observed in B. subtilis pgcA mutants. This suggests that among the eubacteria, UDP-Glc biosynthesis may be a general mechanism for coordinating growth rate with cell division. It remains to be determined if null mutations in galU, the E. coli gtaB homolog encoding UTP-glucose-1-phosphate uridylyltransferase, result in a similar short cell phenotype. Moreover, the nature of the downstream effector is not apparent as there is no UgtP homolog in the E. coli genome. pgm is cotranscribed with the origin sequestering protein seqA in E. coli and a subset of other Gram-negative bacteria, suggesting that it may also play a role in cell cycle regulation in these organisms.
Experimental Procedures
General methods and bacterial strains
B. subtilis strains used in this study and details of their construction are described in the Supplemental Materials. Unless noted, cells were cultured in Luria-Bertani (LB) or S750 minimal media (Jaacks et al., 1989) with appropriate supplements at 37° C. Standard techniques were used for cloning and genetic manipulations.
Descriptions of the transposon-based screen for inhibitors of FtsZ assembly as well as the MinCD and FtsZts suppression assays can be found in (Weart et al., 2005). Quantitative immunoblotting and flow cytometry methods are described in the Supplemental Materials. PgcA activity was measured as described (Lazarevic et al., 2005) using a SPECTRAmax Plus (Molecular Devices) spectrophotometer.
Fluorescence Microscopy
Microscopy was performed using an Olympus BX51 microscope equipped with an OrcaERG camera. Openlabs version 4.0 (Improvision) was used for image capture and analysis. Images were processed with Adobe Photoshop CS (Adobe Systems).
Cells were fixed and stained for FtsZ, cell wall and DNA as described (Weart and Levin, 2003). Live cells were prepared for imaging as described (Levin, 2002).
Determination of cell length, FtsZ ring frequency and L/R ratio
Cell length was calculated as the distance between adjacent septa. Cell length was not affected by method of preparation (Figure S1C). FtsZ ring frequency was measured as the percentage of cells bearing an FtsZ ring. L/R ratio was calculated as the sum total length of a population of cells divided by the number of FtsZ rings in that population. This method was used previously to establish that overproduction of a division inhibitor blocks FtsZ ring formation (Wu and Errington, 2004). Measuring cell length as interseptal distance underestimates the average length of cells in a given population due to an inability to distinguish between partial and completed septa. Thus, it is not possible to accurately back-calculate average cell length from the L/R ratio, without compensating for immature septa (septa that co-localize with an FtsZ ring).
Significance of length distributions was established using a chi-squared analysis with a significance (α) of 0.001. The significance of FtsZ ring frequencies and L/R ratios were established using analysis of variance (ANOVA) with α=0.001 and Tukey pairwise analysis (α=0.01 and 0.05).
YFP-UgtP and EzrA-CFP localization
Cells encoding a xylose-inducible yfp-ugtP fusion were grown at 30° C in the presence of 0.5% xylose for ~3 hours prior to visualization. EzrA-CFP, when present, was expressed from the native ezrA promoter. For FtsZ depletion experiments, YFP-UgtP and EzrA-CFP were expressed in cells expressing FtsZ from an IPTG-inducible promoter. Cells were grown in the presence or absence of IPTG for ~4 hours prior to imaging.
Assessment of nucleoid segregation status
Without reference to the DNA image, mature FtsZ rings that had not yet initiated constriction were selected. Nucleoids were scored as fully segregated (observable separation between distinct DNA masses), partially segregated (a bilobed DNA mass with a medial constriction but no visible separation) or unsegregated (an unsegregated and unconstricted DNA mass).
Analysis of chromosome partitioning phenotypes
Cells were grown in LB and dried onto 0.1% poly-L-Lysine (Sigma) coated glass slides. Samples were rehydrated in PBS plus 1μg/μL DAPI. Septa were visualized by Nomarski optics.
Length to nucleoid ratio
Wild type and pgcA mutant cells encoding a xylose-inducible allele of ftsZ were cultured in LB in the absence of xylose for ~2 hours to prevent septation prior to fixation and staining.
Spo0J-GFP localization
Cells encoding spo0J-gfp were grown in LB, fixed and stained for cell wall. Cells were scored as containing 1, 2, 3, 4 or >4 Spo0J-GFP foci. Cell lengths for those cells with two or four clear Spo0J foci (~85% of the population) were measured as described above.
Protein Purification
Native B. subtilis FtsZ was expressed and purified as described (Haeusser et al., 2004). UgtP was cloned into pBad/Thio-TOPO vector (Invitrogen), creating a thioredoxin-UgtP-6XHis fusion (Thio-UgtP). Thio-UgtP was expressed in E. coli strain BB101(Chivers and Sauer, 1999), purified by nickel affinity chromatography, dialyzed into UgtP buffer (50mM Tris pH8.0, 100mM NaCl and 10% glycerol) and concentrated using a YM-30 Centricon (Fisher) filter. Thio-UgtP is ≥ 95% pure by densitometric analysis. A thioredoxin-6XHis control protein was expressed and purified using the same strategy.
90° angle light scattering assay
Light scattering assays were conducted essentially as described (Weart et al., 2005) using a DM-45 spectrofluorimeter (Olis). Readings were taken four times per second at 30°C, and a baseline was gathered for 1 min before the addition of 1 mM GTP to the cuvette. Reactions contained 50 mM MES pH 6.5, 5 mM MgCl, 1 mM EGTA, 6 μM FtsZ, and 1 mM UDP-Glc where appropriate. UgtP buffer, Thio-UgtP, Thioredoxin-his or BSA diluted in UgtP buffer were added prior to initiating FtsZ assembly. Baseline corrections were applied where necessary (UgtP concentrations of 2 μM and above).
Electron microscopy
Electron microscopy of FtsZ and Thio-UgtP was performed essentially as described (Haeusser et al., 2004). 2 μM FtsZ and 1 μM UgtP were assembled as for light scattering and samples were visualized using a JEOL 1200EX transmission electron microscope.
Supplementary Material
Acknowledgments
We would like to thank Vladimir Lazarevic, Fabrizio Arigoni, John Hellmann, Jeffery Errington, Roberto Kolter, Rich Losick, Kouji Matsumoto, and David Rudner for the gift of bacterial strains, plasmids, and reagents. Wandy Beatty and Darcy Gill provided invaluable assistance with electron microscopy. We are also indebted to Amy Buscher, Dorothy Gregg, Joe Vogel, Jim Skeath, Bob Kranz, David Rudner, Rich Losick, Ralph Quatrano, Christina Ambrosi, Victoria Sepulveda, Hsi-Ming Wang, Jenny Liu, and Mike Caparon for helpful discussions and insightful comments on the manuscript. We are grateful to Gene Lee for assistance with plating efficiencies. Finally, we would like to express our heartfelt gratitude to Ryosuke Kadoya and Dhruba Chattoraj for the flow cytometry data shown in Figure 5. AC is a Lee Foundation Fellow of the McDonnell International Scholars Academy. This work was supported by NIH Public Health Service grant GM64671 to PAL.
Footnotes
Publisher's Disclaimer: This is a PDF file of an unedited manuscript that has been accepted for publication. As a service to our customers we are providing this early version of the manuscript. The manuscript will undergo copyediting, typesetting, and review of the resulting proof before it is published in its final citable form. Please note that during the production process errors may be discovered which could affect the content, and all legal disclaimers that apply to the journal pertain.
References
- Bernhardt TG, de Boer PA. SlmA, a nucleoid-associated, FtsZ binding protein required for blocking septal ring assembly over Chromosomes in E. coli. Mol Cell. 2005;18:555–564. doi: 10.1016/j.molcel.2005.04.012. [DOI] [PMC free article] [PubMed] [Google Scholar]
- Britton RA, Grossman AD. Synthetic lethal phenotypes caused by mutations affecting chromosome partitioning in Bacillus subtilis. J Bacteriol. 1999;181:5860–5864. doi: 10.1128/jb.181.18.5860-5864.1999. [DOI] [PMC free article] [PubMed] [Google Scholar]
- Cao M, Helmann JD. The Bacillus subtilis extracytoplasmic-function sigmaX factor regulates modification of the cell envelope and resistance to cationic antimicrobial peptides. J Bacteriol. 2004;186:1136–1146. doi: 10.1128/JB.186.4.1136-1146.2004. [DOI] [PMC free article] [PubMed] [Google Scholar]
- Chivers PT, Sauer RT. NikR is a ribbon-helix-helix DNA-binding protein. Protein Sci. 1999;8:2494–2500. doi: 10.1110/ps.8.11.2494. [DOI] [PMC free article] [PubMed] [Google Scholar]
- Cooper S, Helmstetter CE. Chromosome replication and the division cycle of Escherichia coli B/r. J Mol Biol. 1968;31:519–540. doi: 10.1016/0022-2836(68)90425-7. [DOI] [PubMed] [Google Scholar]
- Den Blaauwen T, Buddelmeijer N, Aarsman ME, Hameete CM, Nanninga N. Timing of FtsZ assembly in Escherichia coli. J Bacteriol. 1999;181:5167–5175. doi: 10.1128/jb.181.17.5167-5175.1999. [DOI] [PMC free article] [PubMed] [Google Scholar]
- Donachie WD, Begg K. Cell length, nucleoid separation, and cell division of rod-shaped and spherical cells of Eschericia coli. J Bacteriol. 1989;171:4633–4639. doi: 10.1128/jb.171.9.4633-4639.1989. [DOI] [PMC free article] [PubMed] [Google Scholar]
- Fantes P, Nurse P. Control of cell size at division in fission yeast by a growth-modulated size control over nuclear division. Exp Cell Res. 1977;107:377–386. doi: 10.1016/0014-4827(77)90359-7. [DOI] [PubMed] [Google Scholar]
- Feucht A, Lucet I, Yudkin MD, Errington J. Cytological and biochemical characterization of the FtsA cell division protein of Bacillus subtilis. Mol Microbiol. 2001;40:115–125. doi: 10.1046/j.1365-2958.2001.02356.x. [DOI] [PubMed] [Google Scholar]
- Haeusser DP, Schwartz RL, Smith AM, Oates ME, Levin PA. EzrA prevents aberrant cell division by modulating assembly of the cytoskeletal protein FtsZ. Mol Microbiol. 2004;52:801–814. doi: 10.1111/j.1365-2958.2004.04016.x. [DOI] [PMC free article] [PubMed] [Google Scholar]
- Hardy CD, Cozzarelli NR. A genetic selection for supercoiling mutants of Escherichia coli reveals proteins implicated in chromosome structure. Mol Microbiol. 2005;57:1636–1652. doi: 10.1111/j.1365-2958.2005.04799.x. [DOI] [PubMed] [Google Scholar]
- Ireton KNWG, IV, Grossman AD. spo0J is required for normal chromosome segregation as well as the initiation of sporulation in Bacillus subtilis. J Bacteriol. 1994;176:5320–5329. doi: 10.1128/jb.176.17.5320-5329.1994. [DOI] [PMC free article] [PubMed] [Google Scholar]
- Jaacks KJ, Healy J, Losick R, Grossman AD. Identification and characterization of genes controlled by the sporulation-regulatory gene spo0H in Bacillus subtilis. J Bacteriol. 1989;171:4121–4129. doi: 10.1128/jb.171.8.4121-4129.1989. [DOI] [PMC free article] [PubMed] [Google Scholar]
- Jorgensen P, Tyers M. How cells coordinate growth and division. Curr Biol. 2004;14:R1014–1027. doi: 10.1016/j.cub.2004.11.027. [DOI] [PubMed] [Google Scholar]
- Lazarevic V, Soldo B, Medico N, Pooley H, Bron S, Karamata D. Bacillus subtilis alpha-phosphoglucomutase is required for normal cell morphology and biofilm formation. Appl Environ Microbiol. 2005;71:39–45. doi: 10.1128/AEM.71.1.39-45.2005. [DOI] [PMC free article] [PubMed] [Google Scholar]
- Lee PS, Grossman AD. The chromosome partitioning proteins Soj (ParA) and Spo0J (ParB) contribute to accurate chromosome partitioning, separation of replicated sister origins, and regulation of replication initiation in Bacillus subtilis. Mol Microbiol. 2006;60:853–869. doi: 10.1111/j.1365-2958.2006.05140.x. [DOI] [PubMed] [Google Scholar]
- Levin PA, Sansonetti PJ, Zychlinsky A. Molecular Cellular Microbiology. London: Academic Press, Ltd; 2002. Light Microscopy Techniques for Bacterial Cell Biology; pp. 115–132. [Google Scholar]
- Levin PA, Kurtser IG, Grossman AD. Identification and characterization of a negative regulator of FtsZ ring formation in Bacillus subtilis. Proc Natl Acad Sci U S A. 1999;96:9642–9647. doi: 10.1073/pnas.96.17.9642. [DOI] [PMC free article] [PubMed] [Google Scholar]
- Levin PA, Schwartz RL, Grossman AD. Polymer Stability Plays an Important Role in the Positional Regulation of FtsZ. J Bacteriol. 2001;183:5449–5452. doi: 10.1128/JB.183.18.5449-5452.2001. [DOI] [PMC free article] [PubMed] [Google Scholar]
- Levin PA, Shim JJ, Grossman AD. Effect of minCD on FtsZ ring position and polar septation in Bacillus subtilis. J Bacteriol. 1998;180:6048–6051. doi: 10.1128/jb.180.22.6048-6051.1998. [DOI] [PMC free article] [PubMed] [Google Scholar]
- Lin DCH, Levin PA, Grossman AD. Bipolar localization of a chromosome partition protein in Bacillus subtilis. Proc Natl Acad Sci USA. 1997;94:4721–4726. doi: 10.1073/pnas.94.9.4721. [DOI] [PMC free article] [PubMed] [Google Scholar]
- Lu M, Kleckner N. Molecular cloning and characterization of the pgm gene encoding phosphoglucomutase of Escherichia coli. J Bacteriol. 1994;176:5847–5851. doi: 10.1128/jb.176.18.5847-5851.1994. [DOI] [PMC free article] [PubMed] [Google Scholar]
- Margolin W. FtsZ and the division of prokaryotic cells and organelles. Nat Rev Mol Cell Biol. 2005;6:862–871. doi: 10.1038/nrm1745. [DOI] [PMC free article] [PubMed] [Google Scholar]
- Mukherjee A, Lutkenhaus J. Analysis of FtsZ assembly by light scattering and determination of the role of divalent metal cations. J Bacteriol. 1999;181:823–832. doi: 10.1128/jb.181.3.823-832.1999. [DOI] [PMC free article] [PubMed] [Google Scholar]
- Nishibori A, Kusaka J, Hara H, Umeda M, Matsumoto K. Phosphatidylethanolamine domains and localization of phospholipid synthases in Bacillus subtilis membranes. J Bacteriol. 2005;187:2163–2174. doi: 10.1128/JB.187.6.2163-2174.2005. [DOI] [PMC free article] [PubMed] [Google Scholar]
- Price KD, Roels S, Losick Rw. A Bacillus subtilis gene encoding a protein similar to nucleotide sugar transferases influences cell shape and viability. J Bacteriol. 1997;179:4959–4961. doi: 10.1128/jb.179.15.4959-4961.1997. [DOI] [PMC free article] [PubMed] [Google Scholar]
- Romberg L, Levin PA. Assembly dynamics of the bacterial cell division protein FtsZ: poised at the edge of stability. Annu Rev Microbiol. 2003;57:125–154. doi: 10.1146/annurev.micro.57.012903.074300. [DOI] [PMC free article] [PubMed] [Google Scholar]
- Russell P, Nurse P. Negative regulation of mitosis by wee1+, a gene encoding a protein kinase homologue. Cell. 1987;49:559–567. doi: 10.1016/0092-8674(87)90458-2. [DOI] [PubMed] [Google Scholar]
- Sargent MG. Control of cell length in Bacillus subtilis. J Bacteriol. 1975;123:7–19. doi: 10.1128/jb.123.1.7-19.1975. [DOI] [PMC free article] [PubMed] [Google Scholar]
- Schaechter M, Maaloe O, Kjeldgaard NO. Dependency on medium and temperature of cell size and chemical composition during balanced grown of Salmonella typhimurium. J Gen Microbiol. 1958;19:592–606. doi: 10.1099/00221287-19-3-592. [DOI] [PubMed] [Google Scholar]
- Shackelford GS, Regni CA, Beamer LJ. Evolutionary trace analysis of the alpha-D-phosphohexomutase superfamily. Protein Sci. 2004;13:2130–2138. doi: 10.1110/ps.04801104. [DOI] [PMC free article] [PubMed] [Google Scholar]
- Sharpe ME, Hauser PM, Sharpe RG, Errington J. Bacillus subtilis cell cycle as studied by fluorescence microscopy: constancy of cell length at initiation of DNA replication and evidence for active nucleoid partitioning. J Bacteriol. 1998;180:547–555. doi: 10.1128/jb.180.3.547-555.1998. [DOI] [PMC free article] [PubMed] [Google Scholar]
- Weart RB, Levin PA. Growth rate-dependent regulation of medial FtsZ ring formation. J Bacteriol. 2003;185:2826–2834. doi: 10.1128/JB.185.9.2826-2834.2003. [DOI] [PMC free article] [PubMed] [Google Scholar]
- Weart RB, Nakano S, Lane BE, Zuber P, Levin PA. The ClpX chaperone modulates assembly of the tubulin-like protein FtsZ. Mol Microbiol. 2005;57:238–249. doi: 10.1111/j.1365-2958.2005.04673.x. [DOI] [PMC free article] [PubMed] [Google Scholar]
- Wu L, Errington J. Bacillus subtilis SpoIIIE protein required for DNA segregation during asymmetric cell division. Science. 1994;264:572–575. doi: 10.1126/science.8160014. [DOI] [PubMed] [Google Scholar]
- Wu LJ, Errington J. Coordination of cell division and chromosome segregation by a nucleoid occlusion protein in Bacillus subtilis. Cell. 2004;117:915–925. doi: 10.1016/j.cell.2004.06.002. [DOI] [PubMed] [Google Scholar]
Associated Data
This section collects any data citations, data availability statements, or supplementary materials included in this article.