Abstract
Aims
To evaluate the impact of different equations for calculation of estimated glomerular filtration rate (eGFR) on general practitioner (GP) workload.
Methods
Retrospective evaluation of routine workload data from a district general hospital chemical pathology laboratory serving a GP patient population of approximately 250 000. The most recent serum creatinine result from 80 583 patients was identified and used for the evaluation. eGFR was calculated using one of three different variants of the four‐parameter Modification of Diet in Renal Disease (MDRD) equation.
Results
The original MDRD equation (eGFR186) and the modified equation with assay‐specific data (eGFR175corrected) both identified similar numbers of patients with stage 4 and stage 5 chronic kidney disease (ChKD), but the modified equation without assay specific data (eGFR175) resulted in a significant increase in stage 4 ChKD. For stage 3 ChKD the eGFR175 identified 28.69% of the population, the eGFR186 identified 21.35% of the population and the eGFR175corrected identified 13.6% of the population.
Conclusions
Depending on the choice of equation there can be very large changes in the proportions of patients identified with the different stages of ChKD. Given that according to the General Medical Services Quality Framework, all patients with ChKD stages 3–5 should be included on a practice renal registry, and receive relevant drug therapy, this could have significant impacts on practice workload and drug budgets. It is essential that practices work with their local laboratories.
Keywords: GMS, chronic kidney disease, eGFR, screening
A new General Medical Services (GMS) contract was agreed in 2003 between general practitioners (GPs) and the United Kingdom Department of Health. Many of the clinical quality indicators (550 of the 1050 points) are based on clinical biochemistry assays.1 Nine new areas totalling 138 points were introduced for 2006–07, including chronic kidney disease (ChKD). The four chronic kidney disease codes (ChKD1–ChKD4) make up 27 clinical points (table 1). The aim of ChKD1 is the production of a register of at‐risk adults with stages 3–5 ChKD based on the National Kidney Foundation Kidney Disease Outcomes Quality Initiative clinical practice guidelines for chronic kidney disease: evaluation, classification and stratification.2 These guidelines recommended that “the serum creatinine concentration alone should not be used to assess the level of kidney function”.2 The justification for this was that equations estimating glomerular filtration rate (GFR) based on serum creatinine and demographic data are more effective indicators of renal disease than serum creatinine alone.
Table 1 Quality outcome framework for chronic kidney disease (ChKD).
| Indicator | Points | Payment stages |
|---|---|---|
| ChKD1: The practice can produce a register of patients aged ⩾18 years with ChKD (US National Kidney Foundation: Stage 3–5 ChKD) | 6 | |
| ChKD2: The percentage of patients on the ChKD register whose notes have a record of blood pressure measurement in the previous 15 months | 6 | 40–90% |
| ChKD3: The percentage of patients on the ChKD register in whom the last blood pressure reading, measured in the previous 15 months, is ⩽140/85 mm Hg | 11 | 40–70% |
| ChKD4: The percentage of patients on the ChKD register who are treated with an ACE inhibitor or angiotensin receptor blocker (unless a contraindication or side effects are recorded) | 4 | 40–80% |
One potential equation for the derivation of estimated glomerular filtration rate (eGFR) is the four‐variable Modification of Diet in Renal Disease (MDRD) equation:
[eGFR = 186 × (creatinine result/88.4)−1.154 × Age−0.203 × [0.742 if female] × [1.212 if Afro‐Caribbean]3
(henceforth referred to as eGFR186). This was subsequently modified by changing the constant factor from 186 to 175 in December 2005 for use by those clinical laboratories which are using creatinine methods that have been calibrated to be traceable to isotope dilution mass spectroscopy4 (IDMS) (henceforth referred to as eGFR175). It was further suggested by the United Kingdom National External Quality Assessment Service (UKNEQAS) that assay‐specific parameters (that is, slope and intercept adjusters for the creatinine result) could be used to approximate non‐IDMS traceable creatinine results to an IDMS standardised method5 (henceforth referred to as eGFR175corrected).
In April 2006, the Department of Health advised that GPs should allow laboratories to calculate eGFR6 and that laboratories should employ the updated four‐variable MDRD equation.4 Reference was made to the UKNEQAS recommended correction factors for the MDRD equation5 to adjust for method‐related differences compared to the creatinine reference method. Accordingly, some UK laboratories have introduced eGFR using eGFR175corrected while others have continued to use eGFR186, pending evaluation of the impact of the new guidelines. In addition, some general practice surgeries are using their computer systems to directly calculate eGFR and may use eGFR175, on the assumption that this is the correct formula.
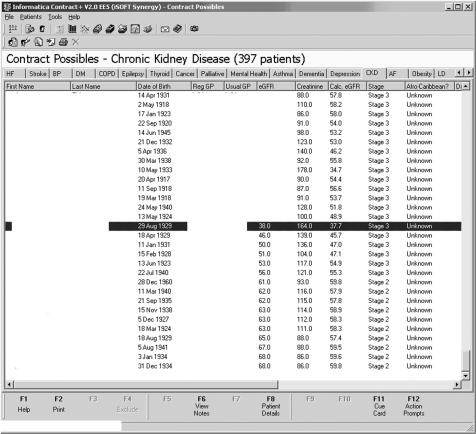
Figure 1 shows an anonymised screenshot from a GP computer system that was submitted to the Ipswich Hospital Department of Clinical Biochemistry as possible evidence that laboratory eGFR175 results (see below) were “incorrect” because they differed from those calculated within the GP system (eGFR186). We have previously shown that a change of creatinine assay method due to a change of analyser had little impact on prevalence of the different ChKD stages.7 However, as the use of different methods to derive eGFR could result in different prevalence rates of ChKD, we decided to investigate the degree of any such difference.
Figure 1 Screenshot from general practitioner (GP) computer system. The estimated glomerular filtration rate (eGFR) column represents the estimated GFR calculated by the laboratory (eGFR175) and the Calc. eGFR column represents the estimated GFR calculated by the GP system (eGFR186).
Methods and results
Using the laboratory computer in Queen's Hospital, Burton‐on‐Trent, we obtained the most recent serum creatinine result on every primary care patient that had had a creatinine requested between 18 August 2002 and 31 August 2005. Creatinine results were obtained for 80 583 individual patients. The creatinine method employed was a kinetic alkaline picrate assay (Olympus Diagnostica GmbH, Ireland) on an Olympus AU640 analyser (Olympus Diagnostica). Inter‐assay coefficients of variation for creatinine are 1.97% at 70 μmol/l, 1.74% at 180 μmol/l and 1.31% at 564 μmol/l. Using each creatinine concentration and the corresponding patient's age, ethnicity and gender, we calculated the eGFR186, eGFR175 and eGFR175corrected.
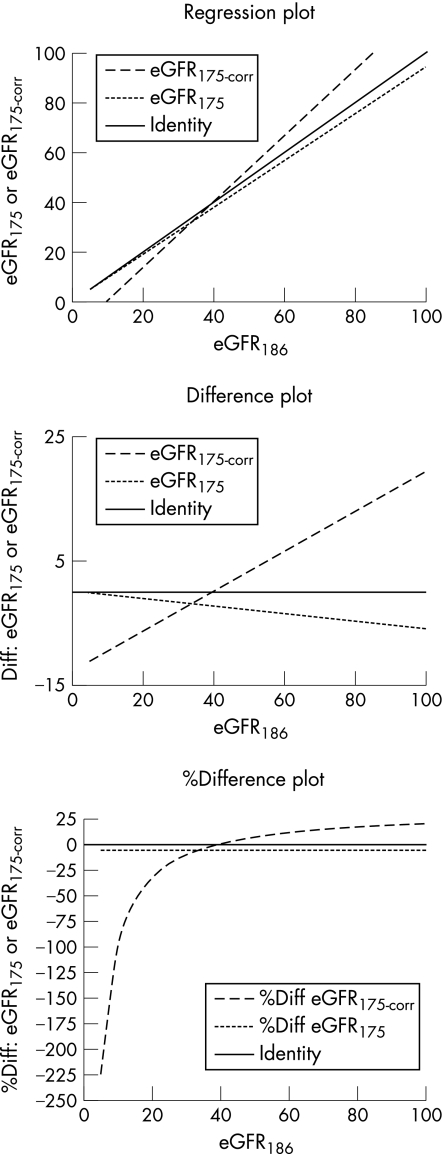
The assay specific parameters as defined by UKNEQAS5 employed for the Olympus creatinine were 0.955 and −16.14 for the slope and the intercept respectively. Pearson's least squares correlations between eGFR186–eGFR175, eGFR186–eGFR175corrected and eGFR175–eGFR175corrected were unsurprisingly good with r = 1.000, 0.986 and 0.986 respectively. Figure 2 shows regression, difference and %difference plots of eGFR186 versus eGFR175 and eGFR186 versus eGFR175corrected.9 The faint solid line is the line of identity. It is unsurprising but clear that eGFR175 gives lower results throughout the creatinine range while eGFR175corrected gives lower eGFR estimates in the lower regions of the scale, and that above approximately 40 ml/min, the eGFR175corrected is higher than the eGFR186 estimate. One might expect that the net effect of eGFR175corrected must be to increase the proportion of cases in which the eGFR175 indicates ChKD stages 4 (eGFR 15–30) and 5 (eGFR <15). However, table 2 shows that there is, in fact, little difference between eGFR186 versus eGFR175corrected with respect to ChKD stages 4 and 5. With respect to the prevalence of stage 3 however, the eGFR175corrected shows a significant reduction, with more patients being identified in stages 1 and 2. Use of eGFR175 significantly increases the prevalence of stage 3 such that over 30% of patients would require inclusion on the renal register.
Figure 2 Plots showing the relationship between eGFR186, and eGFR175 and eGFR175corrected. eGFR, estimated glomerular filtration rate.
Table 2 Prevalence of chronic kidney disease (ChKD) based on the three different versions of the four‐variable Modification of Diet in Renal Disease equation.
| ChKD stage | 5 | 4 | 3 | 2 | 1 |
|---|---|---|---|---|---|
| eGFR (ml/min) | <15 | 15–29 | 30–59 | 60–89 | >90 |
| eGFR186 | 176 (0.22%) | 848 (1.05%) | 17202 (21.35%) | 53222 (66.06%) | 9135 (11.34%) |
| eGFR175 | 196 (0.24%) | 1098 (1.36%) | 23121 (28.69%) | 51094 (63.41%) | 5074 (6.30%) |
| eGFR175corrected | 190 (0.24%) | 831 (1.03%) | 10956 (13.60%) | 43025 (53.41%) | 25581 (31.75%) |
eGFR, estimated glomerular filtration rate.
n = 80 583.
Conclusions
We conclude that significant population differences exist between the three equations studied. The initial MDRD equation is based on 1628 samples from people with ChKD analysed using a kinetic alkaline picrate creatinine method.8 Subsequent modifications of the four‐variable equation,3 such as changing the constant factor or the addition of multiple assay‐specific adjustment factors, have the potential to be a recipe for confusion. The advice currently on the Department of Health website recommends that the eGFR175 equation with the inclusion of adjustments provided by UKNEQAS should be used.6 We have shown that use of the wrong formula results in a greater number of patients in the at‐risk groups. We concur with the Department of Health that clinical biochemistry laboratories are best placed to produce eGFR results once they strictly adhere to the instructions of the manufacturer of the creatinine assay.
General practices that use their practice computer system may potentially diagnose more patients with ChKD than actually have it, and thus significantly and needlessly increase the work they have to perform to achieve quality targets. Furthermore, since quality targets also define prescription of ACE inhibitors or angiotensin receptor blockers, this also has the potential to seriously impact on primary care trust budgets. Perhaps more importantly, in addition to the possibility of receiving incorrect/unnecessary treatment, there are many potential disadvantages to the individual (psychological, financial, and so forth) of being given the diagnosis “chronic kidney disease”. We cannot therefore stress more highly the importance of using the correct equation for calculation.
Take‐home messages
Estimated glomerular filtration rate (eGFR) is not a simple value that can easily be calculated.
Different formulae for calculation of eGFR lead to different chronic kidney disease (ChKD) identification outcomes.
Use of the “wrong” eGFR formula can significantly increase the screen positive rate (ie, numbers of patients with ChKD stage 3).
Identifying more patients with ChKD3 increases general practitioner (GP) workload and costs, and also increases problems for patients.
Laboratories and not GPs should calculate eGFR.
Acknowledgements
We are grateful to Dr William McKee for supplying the image for fig 1.
Abbreviations
ChKD - chronic kidney disease
eGFR - estimated glomerular filtration rate
GFR - glomerular filtration rate
GP - general practitioner
GMS - General Medical Services
IDMS - isotope dilution mass spectroscopy
MDRD - Modification of Diet in Renal Disease
UKNEQAS - United Kingdom National External Quality Assessment Service
Footnotes
Competing interests: None.
References
- 1.Twomey P J, Wierzbicki A S, Reynolds T M. Chemical pathology and the new contract for GPs. J Clin Pathol 2004571022–1024. [DOI] [PMC free article] [PubMed] [Google Scholar]
- 2.National Kidney Foundation Kidney Disease Outcomes Quality Initiative K/DOQI Clinical Practice Guidelines for Chronic Kidney Disease: Evaluation, classification, and stratification. American Journal of Kidney Diseases 200239(2)S7–266. [PubMed] [Google Scholar]
- 3.Levey A S, Greene T, Kusek J W.et al A simplified equation to predict glomerular filtration rate from serum creatinine [abstract]. J Am Soc Nephrol 200011A0828 [Google Scholar]
- 4.National Kidney Disease Education Program (NKDEP) Suggestions for laboratories (December 2005). http://www.nkdep.nih.gov/resources/laboratory_reporting.htm (accessed 1 June 2006)
- 5.Mackenzie F. UKNEQAS of GFR estimations [pilot]. http://www.ukneqas.org.uk/GFR%20Estimations.pdf (accessed 1 June 2006)
- 6.Department of Health Estimating glomerular filtration rate : information for laboratories. http://www.dh.gov.uk/en/Publicationsandstatistics/Publications/PublicationsPolicyAndGuidance/DH_4133024 (accessed 5 July 2007)
- 7.Reynolds T M, Twomey P J. Prevalence of kidney disease and estimated GFR in routine practice. Ann Clin Biochem 20064384–85. [DOI] [PubMed] [Google Scholar]
- 8.Levey A S, Bosch J P, Lewis J B.et al A more accurate method to estimate glomerular filtration rate from serum creatinine: a new prediction equation. Ann Int Med 1999130461–470. [DOI] [PubMed] [Google Scholar]
- 9.Twomey P J. How to use difference plots in quantitative method comparison studies. Ann Clin Biochem 200643124–129. [DOI] [PubMed] [Google Scholar]


