Abstract
The cell adhesion molecule L1 mediates axonal guidance during neural development and mutations in its gene result in severe neurological defects. In previous studies, we identified the promoter for the L1 gene and showed that a neural restrictive silencer element (NRSE) was critical for preventing ectopic expression of L1 during early embryonic development. In the present study, we have investigated the role of the NRSE in the regulation of L1 expression during postnatal development. In gel mobility shift experiments, the NRSE formed DNA–protein complexes with nuclear extracts prepared from the brains of postnatal mice. To examine the influence of the NRSE on postnatal patterns of L1 expression in vivo, we compared the expression of two lacZ transgene constructs, one containing the native L1 gene regulatory sequences (L1lacZ) and another (L1lacZΔN) lacking the NRSE. Newborn mice carrying the L1lacZΔN showed enhanced β-galactosidase expression relative to L1lacZ in the brain and ectopic expression in nonneural tissues. In contrast to L1lacZ mice, however, L1lacZΔN mice showed an unexpected loss, during postnatal development and in the adult, of β-galactosidase expression in several neural structures, including the neural retina, cerebellum, cortex, striatum, and hippocampus. These data support the conclusion that the NRSE not only plays a role in the silencing of L1 expression in nonneural tissues during early development but also can function as a silencer and an enhancer of L1 expression in the nervous system of postnatal and adult animals.
Cell adhesion molecules (CAMs) play fundamental roles in the development of the nervous system. During embryogenesis, CAMs participate in axonal guidance, fasciculation, and synapse formation (1, 2). L1 is an integral membrane CAM containing six Ig domains and five fibronectin type III repeats (3). Other proteins with this overall domain structure include Ng-CAM, Nr-CAM, neurofascin, chL1, and neuroglian (4–8). L1 mediates homophilic neuron–neuron adhesion and is expressed predominantly by postmitotic neurons and by peripheral glia (9–12). Recent studies have revealed that mutations within the human L1 gene result in several congenital disorders including X chromosome-linked hydrocephalus, mental retardation, aphasia, shuffling gait, and adducted thumbs, and agenesis of the corpus callosum (13–15).
In an effort to identify factors that control neural patterns of L1 gene expression, we have characterized (16) the promoter of the mouse L1 gene and found that a single neural restrictive silencer element (NRSE) composed of no more than 21 nucleotides repressed the expression of the L1 gene in nonneural cells but had little or no effect on L1 promoter activity in neuroblastoma cells. In experiments using transgenic mice, a native L1lacZ gene construct containing an 18-kb segment of the L1 gene (spanning the region from the promoter to the fourth exon) produced a tissue-specific pattern of expression that was neurally restricted. However, a similar construct lacking the NRSE called L1lacZΔN, although generating a neural pattern that was similar to the native L1 transgene, also showed extensive ectopic expression in several nonneural tissues, primarily in mesenchymal derivatives of the neural crest (16).
The NRSE has been shown to silence several genes whose expression is restricted to the nervous system (17). A transcription factor that binds to the NRSE called the neural restrictive silencer factor (NRSF), also known as the RE-1 silencing transcription factor (REST), (18, 19) has been characterized. REST/NRSF is a member of the Gli–Kruppel family of zinc-finger proteins. During early neural development, REST/NRSF is expressed ubiquitously in nonneural cells and in neuronal precursors but is not expressed in postmitotic neurons (18, 19). These observations suggest that REST/NRSF silences neurally expressed genes containing the NRSE in nonneural cells and in neural progenitors up to the time of neural differentiation. In postmitotic neurons, repression of NRSE-containing genes would be released in the absence of REST/NRSF, allowing local activators of transcription to induce expression of these genes.
Although the L1 cell adhesion molecule is first expressed during the differentiation of postmitotic neurons from neuroepithelial precursors (20), the most abundant expression of L1 mRNA and protein occurs during the period of postnatal development (21). At this time, there is an extensive outgrowth of neurons and formation of synaptic connections. In the present study, we examine the expression of the native and NRSE-mutated L1 transgenes during postnatal development of the mouse nervous system. We show that the NRSE is a silencer of L1 gene expression in nonneural tissues but behaves as both a silencer and enhancer of L1 expression in different cells of the nervous system during postnatal development.
MATERIALS AND METHODS
Nuclear extracts from P3 and P16 mouse brains were prepared as described (22). To generate a probe for gel mobility shift analyses, a pair of complementary oligonucleotides containing the NRSE from the L1 gene (5′-ggccgcTCCAGCACCACGGACAGCAGAgc-3′) was annealed to form duplex DNA. Additional nucleotides (shown in lowercase type) were included to create NotI 5′ protruding ends. Five picomoles of NRSE probe were labeled by using the Klenow fragment of Escherichia coli DNA polymerase and [32P]dCTP (3,000 Ci/mmol; 1 Ci = 37 GBq; DuPont/NEN). The probe was separated by electrophoresis on a 10% polyacrylamide gel, eluted, and resuspended in water at 20,000 cpm/μl. Binding reactions and electrophoresis of DNA–protein complexes were performed as described (23).
The construction of L1lacZ and L1lacZΔN transgenes have been described (16) and the constructs are diagrammed in Fig. 1. L1 transgenes were excised from plasmids by digestion with restriction enzymes XmaI and SnaBI. Transgenic mice were established by standard oocyte microinjection techniques (24). Genomic DNA isolated from tails of progeny was screened for the presence of either transgene by PCR using the TissueAmp kit (Qiagen, Chatsworth, CA). Animals positive for the transgenes were mated to establish individual lines. Males from these transgenic lines were then mated with C57BL/6 females and postnatal day 1 (P1), P5, P10, and adult mice were sacrificed and analyzed for the presence of either transgene. At least six offspring from two transgenic lines carrying a single copy of either the L1lacZ or L1lacZΔN transgenes were analyzed to ensure that the lacZ expression patterns observed were consistent and stable at different sites of transgene integration.
Figure 1.
Diagram of L1–lacZ gene constructs. L1lacZ contains an 18-kb region of the L1 gene that includes a 2,943-bp segment of the promoter and the first four exons (E1–4) with their introns. An E. coli lacZ gene cassette containing a nuclear localization signal from the simian virus 40 large tumor antigen (nbgal) was inserted between the 5′ untranslated (open box) and coding (solid box) regions of exon 2. L1lacZΔN is identical to L1lacZ except that the NRSE sequence (TCCAGCACCACGGACAGCAGA) within the second intron was deleted by PCR.
Sagittal and transverse sections were taken and examined for expression of β-galactosidase. Embryos were fixed in 0.2% glutaraldehyde/1% formaldehyde in PBS, transferred through an ascending gradient of sucrose to 24% sucrose/PBS, frozen in Tissue-Tek (Miles), and sectioned (20 μm) on a cryomicrotome. Sections were attached to poly-(l-lysine)-coated slides and stained for β-galactosidase in PBS containing 3 mM K3Fe(CN)6, 3 mM K4Fe(CN)6, and 5-bromo-4-chloro-3-indolyl β-d-galactoside (1 mg/ml), mounted with 50% glycerol, and photographed with bright-field optics. To adequately evaluate differences in the intensity of lacZ expression produced by L1lacZ and L1lacZΔN constructs, reaction times for the histochemical staining procedure were kept constant for each set of sections that were compared.
RESULTS
To examine whether neural tissue from the postnatal mouse brain had NRSE-binding activity, nuclear extracts were prepared from mice at P3 and P16 and tested for their ability to bind the NRSE from the mouse L1 gene in gel mobility shift assays. As shown in Fig. 2, nuclear extracts prepared from the brains of mice staged at either P3 or P16 formed two distinct complexes in binding reactions with the 32P-labeled NRSE probe (Fig. 2, lanes 2, 4, 6, and 8, see complexes 1 and 2). The formation of the smaller complex (complex 1) was completely inhibited when a 200-fold molar excess of unlabeled NRSE was added to the binding reaction. A complete block of the formation of the larger complex (complex 2) could be achieved only in the presence of a 500-fold excess of unlabeled competitor DNA (data not shown).
Figure 2.
DNA–protein complexes formed between brain nuclear extracts and the NRSE from the L1 gene. Nuclear extracts were prepared from the brains of four different mice, two staged at P3 (animals 7.5 and 7.7) and two staged at P16 (animals 25–4 and 25–5). Binding reactions with the 32P-labeled NRSE probe were performed in the absence (lane 1) or presence (lanes 2–9) of nuclear extract. In binding reactions labeled C, a 200-fold molar excess of unlabeled competitor NRSE probe was included.
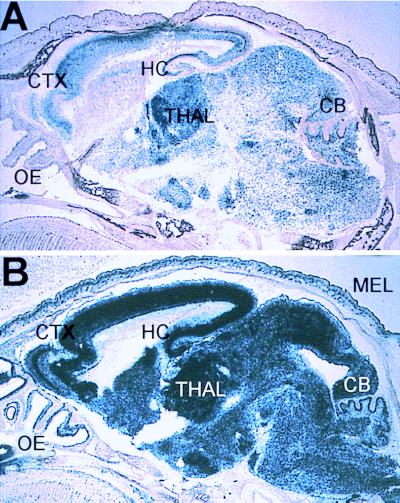
To evaluate the influence of the NRSE on L1 expression in vivo, the patterns of L1lacZ and L1lacZΔN transgenes were compared at different stages during postnatal development of the mouse. At P1, the L1lacZ transgene showed widespread expression of β-galactosidase in neurons of the cerebral cortex, hippocampus, thalamus, inferior colliculus, basal ganglia, cerebellum, and pons (Fig. 3A). The L1lacZΔN transgene showed significantly greater lacZ expression than L1lacZ at P1 in all of these regions of the brain (Fig. 3, compare B to A).
Figure 3.
L1lacZ (A) and L1lacZΔN (B) expression in sagittal sections of the mouse brain at P1. CB, cerebellum; CTX, cortex; HC, hippocampus; MEL, melanocytes; OE, olfactory epithelium; THAL, thalamus.
In the olfactory system of mice at P1, the L1lacZ transgene was expressed within the cell bodies of sensory neurons in the olfactory epithelium and along axons that project to the olfactory bulb (Fig. 4A). Within the olfactory bulb, the L1lacZ transgene was expressed only in the mitral cell layer (Fig. 4A). In contrast, expression of the L1lacZΔN transgene was observed in both the mitral cell layer and the olfactory nerve layer (Fig. 4B). This additional layer of β-galactosidase expression appeared to be in the nuclei of olfactory ensheathing cells surrounding the axons of sensory neurons. At P5, L1lacZ was expressed in a two-layered pattern by cells of the mitral and glomerular layers. In contrast, expression of L1lacZΔN appeared in a three-layered pattern within cells of the mitral, glomerular, and olfactory nerve layers (Fig. 4, compare D to C). Outside of the olfactory bulb, both transgenes were expressed at comparable levels in the cell bodies of olfactory sensory neurons; however, the L1lacZΔN transgene was expressed in a greater proportion of olfactory ensheathing cells than was L1lacZ (Fig. 4 E and F).
Figure 4.
Expression of L1lacZ (A, C, and E) and L1lacZΔN (B, D, and F) during development of olfactory sensory structures at P1 (A and B) and P5 (C–F). G, glomerular layer, M, mitral cell layer; OE, olfactory epithelium; OEC, olfactory ensheathing cells; ON, olfactory nerve layer.
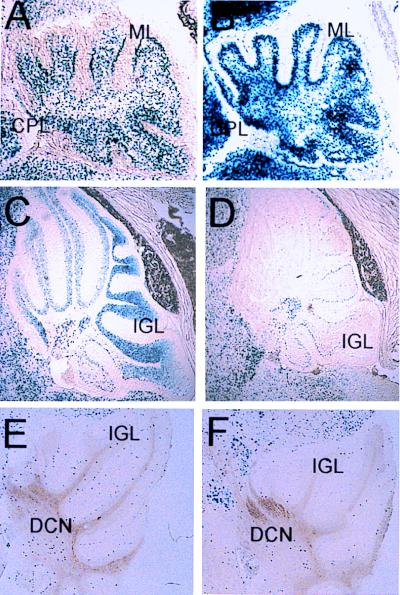
In the cerebellum at P1, L1lacZ was strongly expressed in the nuclei and along axons of cells within the molecular layer (Fig. 5A). Deletion of the NRSE appeared to have little effect on the pattern of expression of β-galactosidase at P1, although the level of L1lacZΔN transgene expression was more intense than that of L1lacZ (Fig. 5, compare B to A). Unlike L1lacZ, L1lacZΔN was expressed in the meninges surrounding the cerebellum (see the lower portion of B) and in the nuclei of cells within the choroid plexus (Fig. 5B). At P10 during the period of granule cell migration, expression of L1lacZ was intense within the internal granule layer (Fig. 5C). In the adult, however, the level of expression in the internal granule layer was reduced dramatically (Fig. 5E). By P10 and continuing into the adult, L1lacZ was also expressed within the deep cerebellar nuclei (Fig. 5 C and E). By P10, expression of L1lacZΔN was considerably weaker than L1lacZ within the internal granule layer (Fig. 5, compare D to C). In the adult, expression of L1lacZΔN within the internal granule layer was barely detectable and comparable to the level observed with the L1lacZ construct (Fig. 5, compare F to E).
Figure 5.
L1lacZ (A, C, and E) and L1lacZΔN (B, D, and F) expression in the cerebellum of the mouse at P1 (A and B), P5 (C and D), and in the adult (E and F). CPL, choroid plexus; DCN, deep cerebellar nuclei; IGL, internal granule layer; ML, molecular layer.
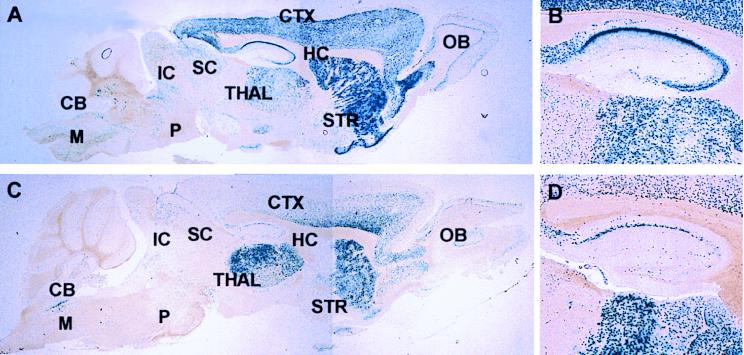
In the adult brain, intense expression of L1lacZ was observed within the cortex, striatum, thalamus, and hippocampus (Fig. 6A). Expression of the L1lacZΔN transgene was consistently weaker than that of L1lacZ in the cortex, striatum, and hippocampus but not in the thalamus where it was more intense than that of L1lacZ (Fig. 6, compare C to A). The reduction of lacZ expression upon deletion of the NRSE was particularly apparent within the CA3 region of the hippocampus (Fig. 6, compare D to B).
Figure 6.
Expression of L1lacZ (A and B) and L1lacZΔN (C and D) in sagittal sections of the adult (30 week old) mouse brain (A and C). (B and D) Higher magnification views of expression of the two transgenes in the hippocampus. CB, cerebellum; CTX, cortex; HC, hippocampus; IC, inferior colliculus; M, medulla; OB, olfactory bulb; P, pons; SC, superior colliculus; STR, striatum; THAL, thalamus.
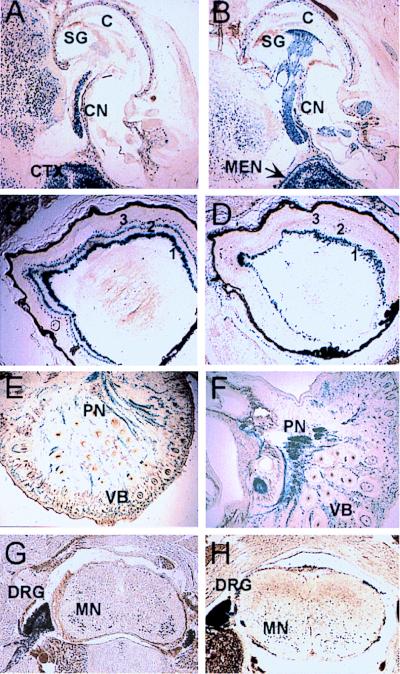
Deletion of the NRSE in the L1 gene also affected the level of lacZ expression in peripheral sensory structures other than the olfactory system. For instance, during development of the ear, although both L1lacZ and L1lacZΔN transgenes were expressed in the cochlear nerve (Fig. 7 A and B), L1lacZΔN was also expressed in the nuclei of cells ensheathing the cochlear nerve within the spiral ganglion (Fig. 7B). In the eye, the L1lacZ transgene was expressed in a three-layered pattern within the ganglion, amacrine, and photoreceptor cell layers (Fig. 7C). In contrast, L1lacZΔN was expressed only in the ganglion cell layer and within the connective tissue surrounding the eye (Fig. 7D). Both L1lacZ and L1lacZΔN were expressed in sensory nerves from the trigeminal ganglion that innervate the face and vibrissae (Fig. 7 E and F), in dorsal root ganglia, and in the nuclei of neurons of the spinal cord, primarily within motoneurons (Fig. 7 G and H).
Figure 7.
Expression of L1lacZ (A, C, and E) and L1lacZΔN (B, D, and F) in transverse or coronal sections of mice staged at P1 during development of the ear (A and B), eye (C and D), peripheral nerves of the face (E and F), and the dorsal root ganglia and spinal cord (G and H). C, cochlea; CN, cochlear nerve; DRG, dorsal root ganglion; PN, peripheral nerve; SC, spinal cord; SG, spiral ganglion; VB, vibrissae; 1, ganglion cell layer; 2, amacrine cell layer; 3, photoreceptor cell layer.
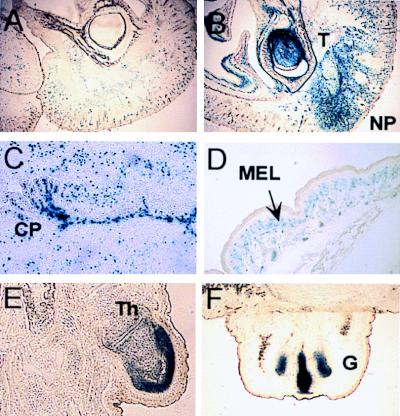
Throughout postnatal development, expression of L1lacZΔN was observed in several nonneural tissues that did not show any expression of the L1lacZ transgene (Fig. 8, compare B and D to A). For instance, L1lacZΔN expression was found in mesenchymal derivatives of the neural crest, including the facial mesenchyme of the nasal placode, the developing dentition, and in the melanocytes of the skin (Fig. 8 B and D). Expression of L1lacZΔN was also observed in the meninges, the choroid plexus (Fig. 8C), and the mesenchyme of the growth plate of the bone of the first digit (Fig. 8E) and the genital tubercle (Fig. 8F), all areas where L1lacZ is not expressed.
Figure 8.
Expression of L1lacZ (A) and L1lacZΔN (B–F) at P5 in the nasal process (NP) and teeth (T) (A and B), the choroid plexus (CP) (C), melanocytes of the skin (D), and in mesenchymal condensations in the thumb (Th) (E) and the genital tubercle (F).
DISCUSSION
The L1 CAM is an important regulator of axonal outgrowth and fasciculation during neural development and its expression is confined primarily to neurons of the central nervous system and peripheral nervous system and in the glia that ensheath peripheral nerves. To better understand the factors that control the tissue-specific expression of L1, we have been studying the regulatory regions of its gene and examining the expression patterns of L1 gene–lacZ reporter constructs during development of transgenic mice. In a previous study (16), we found that a construct called L1lacZ containing an 18-kb segment of the mouse L1 gene produced a neurally restricted pattern of β-galactosidase expression. This pattern was in accord with previous immunohistochemical and in situ hybridization studies that localized the protein and mRNA expression for L1 during early neural development (12, 20, 25, 26). L1lacZΔN, a construct similar to L1lacZ but lacking the NRSE normally found in the second intron of the L1 gene, showed ectopic L1 promoter activity in several nonneural tissues between days 8.5 and 13.5 of embryonic development (16). However, few differences between the spatial patterns of L1lacZ and L1lacZΔN were found within the central nervous system and peripheral nervous system.
Given the observation that L1 expression is most abundant during postnatal development of the mouse and rat (11, 21), in the present study, we wished to compare the expression patterns of L1lacZ and L1lacZΔN transgenes to the known pattern of L1 expression during postnatal development and also to assess the role of the NRSE in the control of L1 gene expression at these times. The native L1 transgene L1lacZ produced a β-galactosidase expression pattern that was in good agreement with the reported pattern of L1 in during postnatal development (11, 21, 26). L1lacZ was expressed in neurons of the central nervous system and peripheral nervous system and in glia of the peripheral nervous system, with most abundant expression in the cortex and thalamus of the postnatal brain. At P10 in the cerebellum, the L1lacZ transgene showed a dramatic increase in expression within the internal granule layer, an observation that is in accord with previous studies showing strong L1 expression in migrating granule cells (27).
Consistent with our previous observations of nonneural expression of L1lacZΔN during early development (16), deletion of the NRSE led to ectopic expression of β-galactosidase in several nonneural tissues during postnatal development, including the meninges, choroid plexus, melanocytes of the skin, teeth, facial mesenchyme, connective tissue surrounding the eye, and mesenchymal condensations such as the limbs and the genital tubercle.
An unexpected finding, however, was that deletion of the NRSE in the L1 gene resulted in a postnatal alteration in both the pattern and level of expression of β-galactosidase in particular neural structures. The effects of NRSE removal on the expression of L1 in different neural structures are summarized in Table 1. Operationally, a gain in expression upon removal of the NRSE was defined as a silencer effect and a loss of expression was defined as an enhancer effect. This definition is neutral with respect to the actual mechanisms involved, which may be various.
Table 1.
Effect of NRSE removal on L1 gene expression
| Stage | Tissue | Effect on expression | Silencer or enhancer |
|---|---|---|---|
| P1 | Entire brain | ↑ | S |
| P1 | Cerebellum: molecular layer | ↑ | S |
| P1 | Ear: spiral ganglion | ↑ | S |
| P1 | Eye: amacrine, photoreceptor layers | ↓ | E |
| P5 | Cerebellum: internal granule layer | ↓ | E |
| Adult | Cortex, striatum, hippocampus | ↓ | E |
| P1, P5 | Olfactory nerve layer in bulb | ↑ | S |
| Adult | Thalamus | ↑ | S |
| All stages | Nonneural tissues | ↑ | S |
S, silencer; E, enhancer.
In some cases, deletion of the NRSE led to a dramatic increase in L1 promoter activity, consistent with its silencer activity. Such enhancement of lacZ expression upon deletion of the NRSE was observed in neurons throughout the brain at birth, in peripheral glia surrounding the nerve bundles at the spiral ganglion of the ear, and in olfactory ensheathing cells. In other cases, primarily later in postnatal development and in the adult, deletion of the NRSE led to a reduction of L1 promoter activity in certain neural structures. In these contexts, the NRSE acted as an enhancer of L1 promoter activity. For example, deletion of the NRSE in the L1 gene led to a loss of β-galactosidase expression in the nuclei of the innermost layers of the neural retina at P1, in the internal granule layer of the cerebellum at P10, and in the cortex, striatum, and hippocampus of the adult (Table 1). The combined data support the conclusion that the NRSE can function both as a silencer and enhancer of L1 gene expression in the nervous system, depending on the anatomical location, cell type, and stage of development.
In gel mobility shift experiments, nuclear extracts prepared from the brains of postnatal mice showed ample NRSE-binding activity. It remains to be determined whether the observed complexes (Fig. 2) contain the NRSE-binding factor REST/NRSF. Recent studies from other laboratories have detected REST/NRSF in several brain regions during postnatal development including the cortex, striatum, and hippocampus (28). Moreover, a truncated form of REST/NRSF has been identified that contains the most amino-terminal five zinc fingers and it is expressed abundantly in neuroblastoma cells and in particular regions of the developing brain (29). These findings are consistent with the notion that the NRSE and REST/NRSF play interactive roles in the modulation of L1 gene expression during postnatal development of the nervous system.
The NRSE has been implicated in silencing the transcription of neurally expressed genes in nonneural cells. Among the genes that contain NRSEs in which silencer activity has been demonstrated are SCG10, the type II sodium channel, synapsin I, BDNF, Ng-CAM, and the m4 muscarinic acetylcholine receptor (30–35). A recent study has previously suggested that the NRSE plays a dual role as silencer and enhancer of gene expression in the nervous system and that its enhancer function may depend on the proximity of the NRSE to the promoter (36). In that study, elimination of the NRSE in the gene encoding the β2 subunit of the neuronal nicotinic acetylcholine receptor did not result in ectopic nonneural expression of the gene but led to a loss of β-galactosidase expression in the spinal cord and dorsal root ganglia and a gain of expression in anterior brain regions. By preparing synthetic promoter constructs in which the NRSE was placed at different distances from an simian virus 40 promoter and testing the activity of such constructs in neuroblastoma cells, it was suggested that the NRSE needed to be close to a promoter to function as an enhancer (36).
The present study indicates that the NRSE does not necessarily have to be close to the promoter to function as an enhancer. Even though the NRSE is approximately 10 kb downstream of the L1 promoter (16), it can still function as an enhancer in certain contexts. Furthermore, our studies indicate that the developmental lineage of a particular cell may be a primary determinant of whether an NRSE within a gene acts as a silencer or an enhancer. It will thus be necessary to examine further the various cellular contexts in which the NRSE and REST/NRSF function together to silence or enhance gene expression. It will also be important to determine how these activities depend on the expression of particular variants of the REST/NRSF protein in combination with other local activators and repressors of neural gene transcription.
Acknowledgments
We are grateful to Nicole Fach and Jill Cleary for excellent technical assistance. We thank Drs. Kathryn Crossin, Bruce Cunningham, Ralph Greenspan, and Joe Gally for critical reading of the manuscript. This work was supported by U.S. Public Health Service Grants NS34493 to F.S.J. and HD33576 to G.M.E. G.M.E. is a consultant to Becton Dickinson and Company.
ABBREVIATIONS
- NRSE
neural restrictive silencer element
- REST/NRSF
neural restrictive silencer factor/RE-1 silencing transcription factor
- P
day of postnatal development
- CAM
cell adhesion molecule
References
- 1.Edelman G M, Crossin K L. Annu Rev Biochem. 1991;60:155–190. doi: 10.1146/annurev.bi.60.070191.001103. [DOI] [PubMed] [Google Scholar]
- 2.Fields D, Itoh K. Trends Neurosci. 1996;19:473–480. doi: 10.1016/S0166-2236(96)30013-1. [DOI] [PubMed] [Google Scholar]
- 3.Moos M, Tacke R, Scherer H, Teplow D, Fruh K, Schachner M. Nature (London) 1988;334:701–703. doi: 10.1038/334701a0. [DOI] [PubMed] [Google Scholar]
- 4.Burgoon M P, Grumet M, Mauro V, Edelman G M, Cunningham B A. J Cell Biol. 1991;112:1017–1029. doi: 10.1083/jcb.112.5.1017. [DOI] [PMC free article] [PubMed] [Google Scholar]
- 5.Grumet M, Mauro V, Burgoon M P, Edelman G M, Cunningham B A. J Cell Biol. 1991;113:1399–1412. doi: 10.1083/jcb.113.6.1399. [DOI] [PMC free article] [PubMed] [Google Scholar]
- 6.Volkmer H, Hassel B, Wolff J M, Frank R, Rathjen F G. J Cell Biol. 1992;118:149–161. doi: 10.1083/jcb.118.1.149. [DOI] [PMC free article] [PubMed] [Google Scholar]
- 7.Holm J, Hillenbrand R, Steuber V, Bartsch U, Moos M, Lubbert H, Montag D, Schachner M. Eur J Neurosci. 1996;8:1613–1629. doi: 10.1111/j.1460-9568.1996.tb01306.x. [DOI] [PubMed] [Google Scholar]
- 8.Bieber A J, Snow P M, Hortsch M, Patel N H, Jacobs J R, Traquina Z R, Schilling J, Goodman C S. Cell. 1989;59:447–460. doi: 10.1016/0092-8674(89)90029-9. [DOI] [PubMed] [Google Scholar]
- 9.Lindner J, Rathjen F G, Schachner M. Nature (London) 1983;305:427–430. doi: 10.1038/305427a0. [DOI] [PubMed] [Google Scholar]
- 10.Lemmon V, McLoon S C. J Neurosci. 1986;6:2987–2994. doi: 10.1523/JNEUROSCI.06-10-02987.1986. [DOI] [PMC free article] [PubMed] [Google Scholar]
- 11.Beasley L, Stallcup W B. J Neurosci. 1987;7:708–715. doi: 10.1523/JNEUROSCI.07-03-00708.1987. [DOI] [PMC free article] [PubMed] [Google Scholar]
- 12.Moscoso L M, Sanes J R. J Comp Neurol. 1995;352:321–334. doi: 10.1002/cne.903520302. [DOI] [PubMed] [Google Scholar]
- 13.Rosenthal A, Jouet M, Kenwrick S. Nat Genet. 1992;2:107–112. doi: 10.1038/ng1092-107. [DOI] [PubMed] [Google Scholar]
- 14.Jouet M, Rosenthal A, Armstrong G, MacFarlane J, Stevenson R, Paterson J, Metzenberg A, Ionasescu V, Temple K, Kenwrick S. Nat Genet. 1994;7:402–407. doi: 10.1038/ng0794-402. [DOI] [PubMed] [Google Scholar]
- 15.Wong E V, Kenwrick S, Willems P, Lemmon V. Trends Neurosci. 1995;18:168–172. doi: 10.1016/0166-2236(95)93896-6. [DOI] [PubMed] [Google Scholar]
- 16.Kallunki P, Edelman G M, Jones F S. J Cell Biol. 1997;138:1343–1354. doi: 10.1083/jcb.138.6.1343. [DOI] [PMC free article] [PubMed] [Google Scholar]
- 17.Schoenherr C J, Paquette A J, Anderson D J. Proc Natl Acad Sci USA. 1996;93:9881–9886. doi: 10.1073/pnas.93.18.9881. [DOI] [PMC free article] [PubMed] [Google Scholar]
- 18.Schoenherr C J, Anderson D J. Science. 1995;267:1360–1363. doi: 10.1126/science.7871435. [DOI] [PubMed] [Google Scholar]
- 19.Chong J A, Tapia-Ramírez J, Kim S, Toledo-Aral J J, Zheng Y, Boutros M C, Altshuller Y M, Frohman M A, Kraner S D, Mandel G. Cell. 1995;80:949–957. doi: 10.1016/0092-8674(95)90298-8. [DOI] [PubMed] [Google Scholar]
- 20.Stallcup W B, Beasley L L, Levine J M. J Neurosci. 1985;5:1090–1101. doi: 10.1523/JNEUROSCI.05-04-01090.1985. [DOI] [PMC free article] [PubMed] [Google Scholar]
- 21.Liljelund P, Ghosh P, Van den Pol A N. J Biol Chem. 1994;269:32886–32895. [PubMed] [Google Scholar]
- 22.Pöpperl H, Bienz M, Studer M, Chan S-K, Aparicio S, Brenner S, Mann R S, Krumlauf R. Cell. 1995;81:1031–1042. doi: 10.1016/s0092-8674(05)80008-x. [DOI] [PubMed] [Google Scholar]
- 23.Copertino D W, Edelman G M, Jones F S. Proc Natl Acad Sci USA. 1997;94:1846–1851. doi: 10.1073/pnas.94.5.1846. [DOI] [PMC free article] [PubMed] [Google Scholar]
- 24.Hogan B, Costantini F, Lacy E. Manipulating the Mouse Embryo. Plainview, NY: Cold Spring Harbor Lab. Press; 1986. [Google Scholar]
- 25.Mirsky R, Jessen K R, Schachner M, Goridis C. J Neurocytol. 1986;15:799–815. doi: 10.1007/BF01625196. [DOI] [PubMed] [Google Scholar]
- 26.Miragall F, Kadmon G, Husmann M, Schachner M. Dev Biol. 1988;129:516–531. doi: 10.1016/0012-1606(88)90397-1. [DOI] [PubMed] [Google Scholar]
- 27.Persohn E, Schachner M. J Cell Biol. 1987;105:569–576. doi: 10.1083/jcb.105.1.569. [DOI] [PMC free article] [PubMed] [Google Scholar]
- 28.Timmusk T, Palm K, Lendahl U, Metsis M. Soc Neurosci Abstr. 1997;23:2241. [Google Scholar]
- 29.Mori N, Naruse Y, Kojima T. Soc Neurosci Abstr. 1997;23:355. [Google Scholar]
- 30.Mori N, Schoenherr C, Vandenbergh D J, Anderson D J. Neuron. 1992;9:45–54. doi: 10.1016/0896-6273(92)90219-4. [DOI] [PubMed] [Google Scholar]
- 31.Kraner S D, Chong J A, Tsay H-J, Mandel G. Neuron. 1992;9:37–44. doi: 10.1016/0896-6273(92)90218-3. [DOI] [PubMed] [Google Scholar]
- 32.Li L, Suzuki T, Mori N, Greengard P. Proc Natl Acad Sci USA. 1993;90:1460–1464. doi: 10.1073/pnas.90.4.1460. [DOI] [PMC free article] [PubMed] [Google Scholar]
- 33.Timmusk T, Palm K, Metsis M, Reintam T, Paalme V, Saarma M, Persson H. Neuron. 1993;10:475–489. doi: 10.1016/0896-6273(93)90335-o. [DOI] [PubMed] [Google Scholar]
- 34.Kallunki P, Jenkinson S, Edelman G M, Jones F S. J Biol Chem. 1995;270:21291–21298. doi: 10.1074/jbc.270.36.21291. [DOI] [PubMed] [Google Scholar]
- 35.Wood I C, Roopra A, Buckley N J. J Biol Chem. 1996;271:14221–14225. doi: 10.1074/jbc.271.24.14221. [DOI] [PubMed] [Google Scholar]
- 36.Bessis A, Champtiaux N, Chatelin L, Changeux J P. Proc Natl Acad Sci USA. 1997;94:5906–5911. doi: 10.1073/pnas.94.11.5906. [DOI] [PMC free article] [PubMed] [Google Scholar]


