

Abstract
Hyperhomocyst(e)inemia is a metabolic derangement that is linked to the distribution of folate pools, which provide one-carbon units for biosynthesis of purines and thymidylate and for remethylation of homocysteine to form methionine. In humans, methionine synthase deficiency results in the accumulation of methyltetrahydrofolate at the expense of folate derivatives required for purine and thymidylate biosynthesis. Complete ablation of methionine synthase activity in mice results in embryonic lethality. Other mouse models for hyperhomocyst(e)inemia have normal or reduced levels of methyltetrahydrofolate and are not embryonic lethal, although they have decreased ratios of AdoMet/AdoHcy and impaired methylation. We have constructed a mouse model with a gene trap insertion in the Mtrr gene specifying methionine synthase reductase, an enzyme essential for the activity of methionine synthase. This model is a hypomorph, with reduced methionine synthase reductase activity, thus avoiding the lethality associated with the absence of methionine synthase activity. Mtrrgt/gt mice have increased plasma homocyst(e)ine, decreased plasma methionine, and increased tissue methyltetrahydrofolate. Unexpectedly, Mtrrgt/gt mice do not show decreases in the AdoMet/AdoHcy ratio in most tissues. The different metabolite profiles in the various genetic mouse models for hyperhomocysteinemia may be useful in understanding biological effects of elevated homocyst(e)ine.
Keywords: Homocysteine, Hyperhomocyst(e)inemia, Folate metabolism, Gene trap, Methionine synthase reductase, Methionine metabolism, Hypomethioninemia, Methyl trap, S-adenosylmethionine, S-adenosylhomocysteine
Introduction
Methionine synthase catalyzes the conversion of homocysteine (Hcy) to methionine (Met), using a methyl group derived from methyltetrahydrofolate (CH3-THF). It is the only ubiquitously expressed enzyme responsible for homocysteine remethylation in mammals [1,2]. This reaction links the methylation cycle, in which methionine serves as a precursor for the universal methyl donor S-adenosylmethionine (AdoMet), to folate metabolism (Fig. 1A). During primary turnover, methionine synthase acquires methyl groups from methyltetrahydrofolate, which is generated by the reduction of methylenetetrahydrofolate (CH2=THF) catalyzed by methylenetetrahydrofolate reductase. The methylenetetrahydrofolate reductase reaction is irreversible under physiological conditions and is inhibited allosterically by the presence of AdoMet [3,4]. In this way, methyl groups from the folate pathway are committed as needed to the production of methionine for AdoMet biosynthesis and other processes requiring methionine. Methionine synthase is the only enzyme in mammals that uses methyltetrahydrofolate as a substrate and is thus solely responsible for returning tetrahydrofolate to the active folate pool, which provides one-carbon units for de novo synthesis of purines and thymidylate. Severe methionine synthase deficiency causes accumulation of methyltetrahydrofolate at the expense of methylenetetrahydrofolate and tetrahydrofolate [5], and the resultant blockade of de novo thymidylate and purine biosynthesis leads to apoptosis of rapidly dividing cells and the development of megaloblastic anemia in humans [6,7]. A complete lack of methionine synthase in the mouse results in embryonic lethality [8].
Fig. 1.

(A) Intracellular folate and methionine metabolic pathways intersect at the methionine synthase reaction. MTRR supports this critical biochemical step. While folate interconversions and steps in the methionine cycle are shown explicitly, the other participating substrates are omitted except where they will be discussed. (B) Methionine synthase, which contains a cobalamin (B12) cofactor, catalyzes the methyl group transfer from methyltetrahydrofolate to cob(I)alamin producing methylcobalamin, and utilizes the methyl group to methylate homocysteine to form methionine. Approximately once in every thousand turnovers, the cob(I)alamin cofactor of methionine synthase becomes oxidized by molecular oxygen forming the inactive cob(II)alamin form. MTRR provides the electron that, along with transfer of a methyl group from AdoMet, returns methionine synthase to the active methylcobalamin form. DHF, dihydrofolate; THF, tetrahydrofolate; 5-CH3-THF, methyltetrahydrofolate; 10-CHO-THF, 10-formyltetrahydrofolate; 5-CHO-THF, 5-formyltetrahydrofolate; 5,10-CH+=THF, methenyltetrahydrofolate; 5,10-CH2=THF, methylenetetrahydrofolate; DMG, dimethylglycine; Sarc, sarcosine; Met, methionine; Hcy, homocysteine; AdoMet, S-adenosylmethionine; AdoHcy, S-adenosylhomocysteine; Gly, glycine; Ser, serine; Cob, cobalamin; CH3-Cob, methylcobalamin; MTHFR, methylenetetrahydrofolate reductase; MS, methionine synthase; MTRR, methionine synthase reductase; GNMT, glycine N-methyltransferase.
Methionine synthase reductase (MTRR, EC 1.16.1.8) is required for the NADPH-dependent reductive reactivation of methionine synthase (Fig. 1B). Every thousand or so turnovers, the active cob(I)alamin cofactor of methionine synthase becomes oxidized by molecular oxygen producing cob(II)alamin [9,10]. Cob(II)alamin is incapable of accepting a methyl group from methyltetrahydrofolate and must be reactivated by reductive methylation; the one-electron reduction is catalyzed by MTRR [1] and transfer of a methyl group from AdoMet [11] then regenerates the active methylcobalamin form of the enzyme (Fig. 1B). The reductase acquires reducing equivalents from NADPH, transferring electrons through non-covalently bound flavin cofactors, flavin adenine dinucleotide (FAD) and flavin mononucleotide (FMN) [1].
MTRR is a member of a family of related dual flavoproteins that, in mammals, includes NADPH-cytochrome P450 oxidoreductase, the flavoprotein domains of the nitric oxide synthase family of enzymes and NADPH-dependent diflavin oxidoreductase 1 (NR1). This family of enzymes contains an N-terminal FMN-binding domain with sequence similarity to prokaryotic flavodoxins and a C-terminal FAD-binding domain with sequence similarity to ferredoxin (flavodoxin)-NADP+ oxidoreductases, and probably arose due to an ancestral gene fusion event [12]. In Escherichia coli, reactivation of cobalamin-dependent methionine synthase requires the action of both flavodoxin and flavodoxin NADP+ oxidoreductase [13,14]. In mammals, MTRR is believed to be absolutely required for methionine synthase activity in vivo, although activation through an alternative electron-donating protein, NR1, was reported in vitro [15].
Complementation studies using fibroblasts cultured from patients affected by defective cobalamin-related metabolism had previously identified distinct genetic syndromes. Patients were assigned to complementation groups (cblA-H, mut) based on the outcome of cell fusion experiments and the apparent biochemical defect involved [16–18]. The cblE complementation group was shown to result from defective reactivation of methionine synthase [19]. The human methionine synthase reductase gene was identified by predicting functional sites based on the orthologous E. coli reducing system and then searching for homology to protein sequences harboring similar active sites. The identity of the deduced gene was confirmed by detection of mutations in methionine synthase reductase in cblE patients [20]. Human patients with inherited syndromes of impaired methionine synthase activity caused by defective methionine synthase reductase are characterized by elevated plasma total homocysteine or hyperhomocyst(e)inemia, decreased plasma methionine, megaloblastic anemia and delayed development, as well as a variety of other neurological ailments, including neuropathy, movement disorders, nystagmus, seizures and dementia [21–25].
Although several other genetic mouse models for hyperhomocyst(e)inemia have been reported, the metabolic abnormalities generated by these models were expected to be quite different from those induced by a deficiency in methionine synthase. While methionine synthase deficiency is predicted to lead to methyl trapping, or elevated levels of methyltetrahydrofolate in the folate pool, absence of methylenetetrahydrofolate reductase leads to lowered levels of methyltetrahydrofolate [26] and absence of cystathionine-β-synthase is not expected to have any effect on folate pools. Absence of methylenetetrahydrofolate reductase or cystathionine-β-synthase also leads to a decreased intracellular AdoMet/AdoHcy ratio and reduced capacity for biological methylation [26,27]. The present study was initiated to determine whether the phenotype associated with methionine synthase deficiency would be different from that seen in other animal models of hyperhomocyst(e)inemia. Since the absence of MTRR might be lethal, in that it would be expected to result in a complete lack of active methionine synthase, we chose to study an Mtrr gene trap model. We hypothesized that this model would be useful for the investigation of pathologies associated with hyperhomocyst(e)inemia and imbalances in folate pools.
We show that the presence of a gene trap in the Mtrr gene leads to a significant reduction in the activity of methionine synthase with consequent metabolic derangement in the folate and methionine cycles. Tissue-specific skipping of the gene trap to generate wild type Mtrr mRNA occurs to different extents in various tissues and results in a mouse that is hypomorphic (deficient) in MTRR rather than completely lacking the enzyme. This incomplete reduction in the level of Mtrr expression results in homozygous mutant mice that are viable, as our preliminary unpublished studies indicate that a true knockout of Mtrr does indeed result in embryonic lethality.
Materials and methods
Generation of Mtrr deficient mice
All animal procedures were carried out in accordance with protocols approved by the University Committee on Use and Care of Animals at the University of Michigan. Mouse embryonic stem cells (E14Tg2a) containing a gene trap vector insertion between exons 9 and 10 (+398bp downstream of exon 9 as determined by PCR and subsequent sequencing, data not shown) of one allele of the Mtrr gene (cell line XG334) were obtained from BayGenomics. The presence of the gene trap vector (pGT1Lxf) containing the Engrailed 2 splice acceptor sequence, β-geo (β-galactosidase/neomycin phosphotransferase fusion gene) and a SV40 poly(A) signal sequence leads to a mature Mtrr (exons 1–9) – β-geo mRNA as first determined by 5′ RACE PCR at BayGenomics. XG334 embryonic stem cells were expanded and injected into C57Bl/6 mouse blastocysts at the University of Michigan Transgenic Animal Model Core. Blastocysts were implanted into pseudopregnant females, producing nine male chimeras, which were then mated to C57Bl/6J females. Five chimeras bred successfully, and three produced germ line transmission of the gene trap insertion. The Mtrrgt allele was maintained by continuous backcrossing onto the C57Bl/6J background.
Genotyping of Mtrr deficient mice
Routine genotyping was carried out by PCR of genomic DNA utilizing a three-primer PCR strategy (Fig. S1 in supplementary material). To detect the 5′ end of the gene trap insertion, the primers were C, 5′-GAGATTGGGTCCCTCTTCCAC-3′, B, 5′-CGACTTCCGGAGCGGATCTC-3′, and X, 5′-GCTGCGCTTCTGAATCCACAG-3′. For detection of the 3′ end of the gene trap insertion, the primers were A, 5′-CTGCCAGCCTCCGCTCAGC-3′, D, 5′-CACAGCTTGTCTGTAAGCGG-3′, and Z, 5′-CCTTTAATCCCAGCACTCAG-3′. Genomic DNA was isolated from tail tissue using the DNeasy DNA purification kit (Qiagen). The annealing temperatures were 52 °C for 5′-targeted and 58 °C for 3′-targeted PCR.
Relative quantitative reverse transcription-PCR of mouse tissue Mtrr RNA
Whole liver, heart, kidney and brain tissues were excised from two Mtrr+/+ and two Mtrrgt/gt mice of each sex for quantitative reverse transcription-PCR in mice derived from matings of Mtrr+/gt mice from the fourth generation of backcrosses into the C57Bl/6J background (N4F2 mice). Total RNA was extracted from tissues of each animal using 1.0 mL RNA-Bee (Teltest) per 50 mg tissue. Purity was verified by UV spectroscopy of RNA in water. Reverse transcription reactions were carried out with 250 ng RNA using the RETROscript kit (Ambion). Relative quantitative PCR was carried out for Mtrr 5′ of the gene trap insertion spanning exons 8 and 9, using the primers 5′-GCGTTCTCTCCAGTTCATCC-3′ and 5′-CAGCCTCCGCTTTTCAGT-3′, generating a 115 bp amplicon, and for Mtrr 3′ of the gene trap insertion spanning exons 10 and 11, using primers 5′-CATTCCTTCAGCCAAACACA-3′ and 5′-ACGGGTCCTCTGGTAAGTGG-3′, generating a 114 bp amplicon. Control PCR reactions were carried out for the β-actin mRNA, using the primers 5′-TGTTACCAACTGGGACGACA-3′ and 5′-GGGGTGTTGAAGGTCTCAAA-3′, generating a 165 bp amplicon. All primers were designed using Primer3 software. Formation of double-stranded DNA during PCR was monitored using Brilliant SYBR Green QPCR Master Mix (Stratagene) and an annealing temperature of 60 °C with a concentration of 100 nM for forward and reverse primers in 25 μL total reaction volume. Measurements were carried out in triplicate on an Mx4000 multiplex quantitative PCR system (Stratagene). The data were normalized to β-actin for comparison of the relative abundance of wild type and total Mtrr mRNA between Mtrr+/+ and Mtrrgt/gt animals using the comparative CT method. CT, or threshold cycle, is the cycle at which double stranded DNA-binding SYBR Green I dye fluorescence reaches a statistically significant value above baseline, in the region of exponential amplification across all the amplification plots that are compared. ΔCT values for each sample were calculated using the formula ΔCT = CT,X − CT,R, where CT,X is the CT value for the 5′- or 3′-specific Mtrr target and the CT,R is the CT value for the β-actin reference gene. The efficiencies of amplications with 5′ Mtrr-, 3′ Mtrr- and β-actin-specific primers were approximately equal, as determined by serial template dilution (data not shown). Therefore, the amount of wild type and total Mtrr mRNA in Mtrrgt/gt mice can be normalized to the amount of β-actin in the same samples and expressed as the fold-change relative to Mtrr+/+ control samples using the formula 2−ΔΔCT, where ΔΔCT is ΔCT,Xa − ΔCT,Xb, in which ΔCT,Xa is the ΔCT for Mtrrgt/gt or Mtrr+/+ samples and ΔCT,Xb is the mean ΔCT for Mtrr+/+ samples only. The value of 2−ΔΔCT for Mtrr+/+ mRNAs is thus equal to one. For Mtrrgt/gt tissues, fold-change values greater than one indicate increased mRNA expression and values less than one indicate decreased mRNA expression, compared to wild type controls.
Western blotting
Polyclonal antibodies were generated to highly purified recombinant human methionine synthase reductase expressed in SF9 insect cells infected with baculovirus containing the cDNA for human methionine synthase reductase fused in frame to an amino-terminal hexahistidine tag [28]. Antibodies were applied as serum. Fifty μg of tissue supernatants (100,000 × g) from mice backcrossed into the fourth generation of the C57Bl/6J background were separated by reducing SDS-PAGE on a 4–12% gradient gel (Invitrogen) and transferred to a PVDF membrane (Millipore). After blocking in TBS-T with 5% blocking agent (Bio-Rad), rabbit serum (1:5000) was applied in TBS-T containing 5% blocking agent overnight at 4 °C. After washing, blots were incubated with goat anti-rabbit peroxidase-conjugated antibodies (GE Healthcare) for one hour at room temperature. Blots were visualized using ECL-Plus chemical luminescence (GE Healthcare) on a Typhoon phosphorimager (GE Healthcare). To check for equal protein loading, blots were stripped and re-probed with polyclonal primary antibodies to the β-actin protein raised in rabbit (Sigma).
MTRR enzyme activity assays
MTRR activity assays were carried out in tissues derived from from N6F2 offspring as previously described [2]. Reactions contained 50 mM potassium phosphate buffer (pH 7.2), 100 mM KCl, 500 μM L-Hcy, 20 μM AdoMet, 250 μM (6-R,S)-5-[14C-methyl]methyltetrahydrofolate (GE Healthcare) diluted with unlabeled (6-R,S)-5-methyltetrahydrofolate (Schircks) to a specific activity of 1,765 dpm/nmol, and 100,000 × g tissue supernatants (0.12 mg protein) in a final volume of 0.1 mL. Physiological assays used to measure MTRR-dependent methionine synthase activity contained 1 mM NADPH as reductant. For the measurement of maximal attainable methionine synthase activity, the assays employed a chemical reducing system consisting of 25 mM DTT and 50 μM hydroxocobalamin. Argon was passed over reaction components in separate serum vials (National Scientific) fitted with caps containing rubber seals for at least 30 min while maintaining temperature at 4 °C. Reaction components, except for 5-[14C-methyl]methyltetrahydrofolate, were added to serum vials in a glove box on ice, with tissue supernatants added last, and fitted with caps. Using a Hamilton syringe, 5 μL aliquots of 5-[14C-methyl]methyltetrahydrofolate were injected through septa into each vial. Reactions were carried out for one hour at 37 °C. Vials were heated for two minutes at 95 °C to stop reactions, and then cooled on ice. After addition of 200 μL deionized water, precipitated reaction components were separated by centrifugation in a micro-centrifuge (16,000 × g) at room temperature. Supernatants were loaded onto Dowex AG1X8-200 (Bio-Rad) anion exchange columns and eluted with 2.0 mL of deionized water. Eluates were mixed with 10 mL scintillation cocktail (ICN) and radioactivity was measured in a liquid scintillation counter (Beckman Coulter).
Determination of growth curves
Mtrr+/+, Mtrr+/gt, and Mtrrgt/gt mice representing both sexes of the F2 generation (n=93) were weighed at two weeks of age, and weekly thereafter until ten weeks of age. Mice were fed a standard 5001-lab chow (LabDiet) ad libitum upon weaning.
Plasma metabolite measurements
Plasma Hcy was measured in F2 mice (Mtrr+/+, n=8; Mtrr+/gt, n=12; Mtrrgt/gt, n=8) and plasma Met was measured in F2 mice (Mtrr+/+, n=6; Mtrr+/gt, n=10; Mtrrgt/gt, n=6) after overnight fasting. Approximately 150 μL of blood was drawn via retroorbital sinus venipuncture into Microtainer (Becton Dickinson) tubes containing EDTA as an anticoagulant. Plasma was separated by centrifugation at 4 °C at 4,000 × g in a micro-centrifuge for 5 min and stored at −80 °C for later analysis. Plasma Hcy was measured by HPLC fractionation coupled to fluorescence detection [29]. Plasma Met was measured by HPLC with coulometric electrochemical detection as previously described [27].
Determination of tissue AdoMet and AdoHcy concentrations
Following overnight fasting, liver and brain tissues were removed from N4F2 mice (Mtrr+/+, n=9; Mtrrgt/gt, n=11) and immediately deproteinized in 0.4 M perchloric acid. In a second experiment, livers were removed from N8F2 mice (Mtrr+/+, n=3; Mtrrgt/gt, n=4) also backcrossed into the C57Bl/6J background. In a third experiment, livers, hearts, kidneys and brains were removed from N8F2 mice (Mtrr+/+, n=4; Mtrrgt/gt, n=4). Following deproteinization, homogenates were clarified by centrifugation at 16,000 × g for 10 min at 4 °C, and supernatants were flash frozen in liquid nitrogen and stored at −80 °C for later analysis. AdoMet and AdoHcy concentrations were measured by fluorescence detection following HPLC fractionation with UV detection [30].
Measurement of folate concentrations
Analyses of folate forms were carried out in duplicate in liver, heart, kidney, and brain tissues from three Mtrr+/+ and three Mtrrgt/gt mice. Tissue samples were collected from animals after overnight fast, rinsed in 1xPBS and immediately stored at −80° C. For folate analyses, tissue samples were thawed on ice. Sections of about 100 mg were cut from each sample and homogenized manually using a Dounce homogenizer in 2 ml of ice-cold extraction buffer containing 50 mM Tris-HCl and 50 mM sodium ascorbate, pH 7.4. Tissue homogenates were placed in pre-chilled microfuge tubes and protein concentrations were determined using the Bradford assay. Homogenates were placed in a 95 °C water bath for 3 minutes, then subjected to centrifugation at 14,000 × g for 5 minutes at 4 °C to remove precipitated protein. The supernatant fractions were used to measure reduced folate pools by the ternary complex assay as described elsewhere [31].
Dissection and X-gal staining of conceptuses
Wild type C57Bl/6J dams were mated to heterozygous F1 Mtrr+/gt sires. Conceptuses were dissected at embryonic day E9.5 in phosphate buffered saline (PBS). Embryos and placentas were fixed in PBS, pH 7.3, containing 0.2% gluteraldehyde, 100 mM MgCl2, and 50 mM EGTA for four hours at 4 °C and washed in lacZ wash buffer consisting of 2 mM MgCl2, 0.01% sodium deoxycholate, and 0.02% NP-40 in PBS. β-Galactosidase expression was determined by staining embryos and placentas with 1 mg/mL 4-chloro-5-bromo-3-indoyl-β-D-galactopyranoside (X-gal; Invitrogen), 100 mM potassium ferrocyanide, 100 mM potassium ferricyanide, in lacZ wash buffer overnight at 4 °C. A Leica MZ95 dissection microscope with Photometrics Coolsnap cf camera and Open Lab 2.2.2 imaging software program were used to obtain micrographs.
Results
Generation of Mtrr deficient mice
Mtrr-mutant mice were generated using a gene trapped embryonic stem cell line (XG334) obtained from BayGenomics. Southern blotting (Fig. S1A, supplemental material) confirmed insertion of the pGT1Lxf vector between exons 9 and 10 of the Mtrr gene, and the exact position of the insertion was deduced by DNA sequencing (not shown) to be +398bp downstream of exon 9. The Mtrr gene, which contains 15 exons, specifies an N-terminal FMN-binding domain, a linker region that orients flavin-binding domains for electron transfer, and a C-terminal FAD/NADPH-binding domain. Exon 9 of Mtrr specifies the end of the linker region and exon 10 specifies includes the beginning of the FAD/NADPH domain. Thus, incorporation of the gene trap generates a fusion between the FMN and partial-linker domain of MTRR and the β-galactosidase/neomycin phosphotransferase gene products. The removal of exons 10 – 15 eliminates binding determinates for FAD and NADPH, disrupting the critical electron transfer elements and most likely leads to loss of reductase function. We cannot, however, eliminate the possibility that the isolated FMN domain might retain some limited ability to be reduced by an alternate electron-donating source.
PCR genotyping (Fig. S1B, supplemental material) of F2 offspring from heterozygous F1 intercross mating revealed a Mendelian distribution of Mtrr+/+, Mtrr+/gt and Mtrrgt/gt genotypes, indicating that the gene trap insertion does not lead to embryonic lethality. Given that methionine synthase-null embryos implant into the uterus, but die prior to embryonic day E9.5 [8], the Mendelian distribution suggested that the acceptor splice site of the cryptic exon containing the gene trap is sometimes skipped by the RNA splicing machinery, thereby generating a mixture of wild type and gene trap-containing mRNA in Mtrrgt/gt mice. If the gene trap were spliced out, wild type mRNA in Mtrrgt/gt mice should be detectable.
Analysis of Mtrr mRNA and protein expression in Mtrr deficient mice
Reverse transcription-PCR using primers specific for the 3′ end of the wild type Mtrr mRNA indicated the presence of wild type transcript in liver, heart, kidney and brain tissues of Mtrrgt/gt mice. In order to determine the contribution of wild type Mtrr mRNA in each tissue, relative quantitative reverse transcription-PCR was performed for each of the four tissues using primers specific for the 3′ end of the wild type Mtrr mRNA (Fig. 2A). The gene trap lowers the expression of the wild type Mtrr mRNA to 20% in liver, 23% in kidney and 37% in brain of Mtrrgt/gt tissues as compared to wild type tissues. In the heart, only 0.8% of the wild type Mtrr mRNA transcript was detectable in mice homozygous for the gene trap. In addition to detecting changes in wild type Mtrr mRNA expression levels, the total amount of Mtrr mRNA transcript (wild type form plus gene trapped form) was measured using primers specific for the 5′ end of the Mtrr mRNAs, which is shared by both wild type and gene trapped mRNAs (Fig. 2B). The total level of Mtrr mRNA transcript in Mtrr+/+ and Mtrrgt/gt animals was not statistically different in heart, liver, or kidney. However, total Mtrr mRNA levels were increased ~3-fold in brain tissues of gene trapped animals as compared to wild type animals, an indication that some cell types may compensate for decreased levels of MTRR expression by upregulating Mtrr transcriptionally.
Fig. 2.

Relative quantitative reverse transcription-PCRs were carried out to determine (A) the fold-difference between wild type Mtrr mRNA present in Mtrr+/+ and Mtrrgt/gt mice (wild type Mtrr mRNA only), or (B) the fold-difference of total Mtrr mRNA present in Mtrr+/+ and Mtrrgt/gt mice (wild type form plus gene trapped form). CT measurements were carried out in triplicate after reverse transcription of RNA purified from liver, heart, kidney and brain tissues of both Mtrr+/+ mice (2 males and 2 females) and Mtrrgt/gt mice (2 males and 2 females). No differences were detected based on gender. CT values were determined by monitoring SYBR Green fluorescence in real time. PCR products were evaluated for homogeneity using dissociation analysis and post-PCR gel electrophoresis. Values are the mean fold-changes between Mtrrgt/gt animals versus Mtrr+/+ reference animals. Asterisks indicate a statistically significant difference from wild type, p<0.05, using a Student’s t-test.
In order to determine if changes in wild type Mtrr mRNA levels correlated with the amount of MTRR protein, Western blotting was performed with 100,000 × g supernatants of homogenates from Mtrr+/+ and Mtrrgt/gt liver, heart, kidney and brain tissues (Fig. 3). A qualitative decrease in MTRR was detected in all four tissues, in general agreement with decreases in mRNA expression seen in Fig. 2. MTRR was estimated to be present at low pg quantities on blots. Thus, background variability made quantification of protein levels by image analysis unreliable. A band consistent with the 198.6 kDa fusion protein (exons 1–9 of MTRR and β-galactosidase/neomycin phosphotransferase gene products) was visualized in Mtrrgt/gt tissues under some conditions (not shown).
Fig. 3.
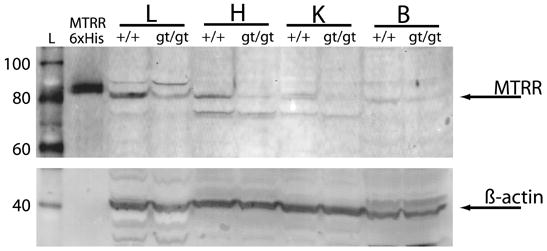
Western blotting of 100,000 × g supernatants of liver (L), heart (H), kidney (K) and brain (B) tissue homogenates from Mtrr+/+ and Mtrrgt/gt female mice was performed to assess the impact of the gene trap insertion on protein levels. The response to polyclonal antibody specific for MTRR protein was assessed (top panel). Mouse MTRR migrates at the correct molecular mass of 77.6 kDa. The purified recombinant human methionine synthase reductase with N-terminal hexahistidine tag (MTRR 6xHis) migrates at 81.1 kDa. The blot was stripped and re-probed with antibody specific for the 42.1 kDa mouse β-actin protein (lower panel), in order to confirm equal protein loading, as shown in the bottom panel.
MTRR specific activity in Mtrr deficient mice
To assess the functional consequences of lowered mRNA and protein expression in Mtrrgt/gt mice, MTRR-dependent reactivation of methionine synthase was determined in liver, heart, kidney and brain tissue homogenates by monitoring transfer of a radiolabeled methyl group from [14C]methyltetrahydrofolate to methionine (Table 1). For these assays, the endogenous MTRR in the tissue is required for sustained activity of methionine synthase, and no chemical reducing system is present. As a control, methionine synthase specific activity was also measured using a chemical reducing system (DTT and hydroxocobalamin), in which the requirement for MTRR is eliminated. This assay, which requires no accessory protein, is an accurate measure of the amount of active methionine synthase in the tissue being examined, and would reveal any changes in methionine synthase expression and holoenzyme formation that might result from decreased levels of MTRR. As indicated in Table 1, levels of active MS determined using the chemical reducing system did not vary significantly between Mtrr+/+ and Mtrrgt/gt mice in any tissue, although there was some variation from one animal to another. MTRR-dependent methionine synthase assay values were expressed as a percentage of the activity measured using the chemical reducing system in that mouse tissue. MTRR-dependent methionine synthase specific activities were significantly decreased in all tissues of Mtrrgt/gt mice as compared to wild type controls.
Table 1.
Methionine synthase specific activity measured in the tissues of MTRR deficient mice
| Tissue | Assay | Specific activity Mtrr+/+ | Specific activity Mtrrgt/gt | Specific activity Mtrrgt/gt/Mtrr+/+(%) |
|---|---|---|---|---|
| Liver | DTT+HOCbla
+NADPH(%)b |
4.4±1.4
21±4 |
4.6±0.4
13±2c |
62 |
| Heart | DTT+HOCbla
+NADPH(%)b |
5.5±1.3
8±1 |
7.8±0.8
3±1c |
38 |
| Kidney | DTT+HOCbla
+NADPH(%)b |
11±4
28±4 |
12±1
13±7c |
46 |
| Brain | DTT+HOCbla
+NADPH(%)b |
7.7±2.5
16±4 |
8.0±1.0
8±1c |
50 |
nmol of methionine formed per mg tissue per hr (mean ± standard deviation)
MTRR-dependent MS activity as a percent of DTT-HOCbl value (mean ± standard deviation)
Statistically significant difference from wild type, p<0.05, using an unpaired t-test
The reader will note that the MTRR-dependent specific activities measured using the physiological reducing system were consistently lower than those measured using the chemical reducing system. In order to measure the specific activities listed in Table 1, crude tissue homogenates were diluted to a single protein concentration attainable for all tissue types (3.0 mg/ml) in homogenization buffer and further diluted 2.5-fold into the assay mixture. We have conducted a series of experiments in which we measured the physiological activity of wild type liver homogenates prepared with varying amounts of homogenization buffer (Table S1 in supplementary material), and found that the specific activities measured using the MTRR-dependent methionine synthase assay decrease with increasing dilution, while those measured using the chemical reducing system do not change. This observation may indicate that a complex is formed between MTRR and methionine synthase, and that this complex dissociates when tissue extracts are diluted. Consequently, for the experiments shown in Table 1, homogenates were prepared at the same concentration of total protein (3.0 mg protein/ml, 0.12 mg protein/assay). For this reason, we do not interpret the results in Table 1 as indicating that the concentration of MTRR is necessarily limiting for the activity of methionine synthase in wild type mice, in vivo.
Growth curves for male and female Mtrr deficient mice
Disrupted methionine biosynthesis leading to limited availability of methionine might be expected to impair growth in rodents even when they are fed a methionine-replete diet [32]. We monitored the weights of Mtrr+/+, Mtrr+/gt, and Mtrrgt/gt mice of both sexes beginning at 2 weeks of age and weekly thereafter until mice reached 10 weeks of age (Fig. 4). Males, but not females, of the Mtrrgt/gt genotype showed reduced weight gain. Mtrrgt/gt male mice were 10% smaller than male Mtrr+/+ littermates, with Mtrrgt/gt males averaging only 25.1 g compared to 28.0 g for wild type males at week 10. The trend was evident at the first weighing, and became statistically significant by 7 weeks of age. The average weight of Mtrr+/gt male mice was essentially equivalent to that of wild type males. Female mice of all genotypes had similar weights throughout maturation. Gross pathological analyses and sectioning of Mtrrgt/gt neonates indicated normal development of major organ systems.
Fig. 4.
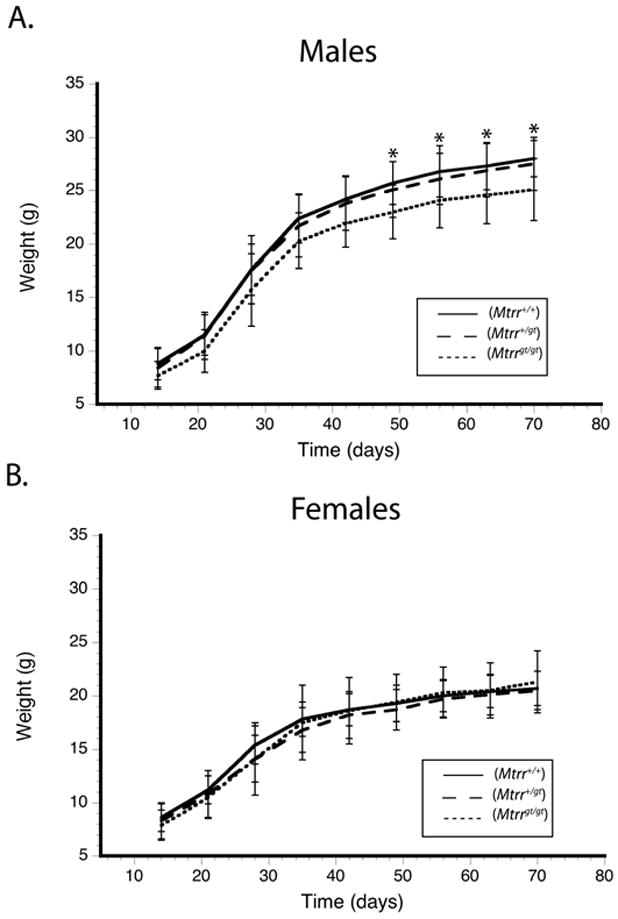
Growth curves of F2 animals (total n=93), determined for male (A) and female (B) Mtrr+/+, Mtrr+/gt, and Mtrrgt/gt mice. The first weight measurements were taken at 14 days of age. Animals were weighed weekly thereafter until 10 weeks of age. Error bars represent standard deviation of the mean. Asterisks indicate a statistically significant difference in the gene trapped animals from wild type, p<0.05, using a one-way ANOVA, followed by the Tukey post-hoc test.
Plasma total homocysteine and methionine concentrations
In contrast to the apparently mild morphological phenotype observed in Mtrrgt/gt mice, biochemical indicators demonstrated a significantly altered metabolic phenotype (Table 2). Mice homozygous for the Mtrrgt allele had plasma total Hcy concentrations of 18.4±5.5 μM (mean ± standard deviation), heterozygotes had values of 5.5±1.8 μM, and Mtrr+/+animals had values of 4.6±0.8 μM. We also detected a 32% decrease in plasma methionine in Mtrrgt/gt mice (values were 40.4±6.6 mM for Mtrrgt/gt, 48.9±10.5 μM for Mtrr+/gt and 59.4±7.4 for Mtrr+/+mice). The differences in plasma total Hcy and Met were significantly different between Mtrrgt/gt and Mtrr+/+mice, but not between heterozygotes and wild type mice.
Table 2.
Metabolite concentrations in plasma and liver tissue of genetic mouse models for hyperhomocysteinemia
| Mouse modela genotype | Hcyb | Metb | AdoMetc | AdoHcyc,g | AdoMet/AdoHcyd | 5-MethylTHF |
|---|---|---|---|---|---|---|
| Mtrr | ||||||
| +/+ | 4.6±0.8 | 59.4±7.4 | 45.9±4.5 | 60.6±8.3g | 0.9±0.2 | 42±5 |
| +/gt | 5.5±1.8 | 48.9±10.5 | ND | ND | ND | ND |
| gt/gt | 18.4±5.5f | 40.4±6.6f | 64.1±6.4f | 30.7±4.7f | 2.9±0.6f | 60±19 |
| Mtr | ||||||
| +/+ | 4.1h | 78h | 33.1±4.7i | 22.4±2.2i | 1.5±0.2i | ND |
| +/− | 6.1 | 102 | 42.1±4.4 | 20.2±2.2 | 2.3±0.3 | ND |
| −/− | NA | NA | NA | NA | NA | NA |
| Mthfr | ||||||
| +/+ | 3.3±1.0j | ND | 27.7±0.3j | 13.8±0.3j | 2.0j | 22.6±11.5j |
| +/− | 5.3±0.8 | ND | 36.3±0.7 | 36.3±0.5 | 1.0 | 13.0±6.2 |
| −/− | 32.3±5.5 | ND | 19.0±0.7 | 55.4±0.9 | 0.3 | 0.9±1.3 |
| Cbs | ||||||
| +/+ | 6.1±0.8k | 22.8±1.6l | 42.9±8.8l | 27.4±2.9l | 1.7±0.2l | ND |
| +/− | 13.5±3.2 | 30.6±2.5 | 41.9±3.1 | 45.7±5.1 | 1.0±0.1 | ND |
| −/− | 203.6±65.3 | ND | ND | ND | ND | ND |
values for a column, for each model, are from the same report
μM Hcy and Met in plasma
nmol per g liver
ratio of AdoMet/AdoHcy
5-methyltetrahydrofolate as a percent of total folates in liver
statistically significant difference between Mtrr+/+ and Mtrr−/− values (mean ±SD) as determined using an unpaired t-test, p<0.05
AdoHcy values from wild type Mtrr liver tissues are higher than those observed from wild type mice in other studies. This difference is probably due to overnight fasting of animals before sample collection for all metabolite analyses carried out in this study, which was utilized to decrease variability between sample measurements.
Swanson, et al. (2001)
Dayal, et al. (2005)
Chen, et al. (2001)
Watanabe, et al. (1995)
Dayal, et al. (2001)
AdoMet and AdoHcy measurements in tissues
Methylenetetrahydrofolate reductase (Mthfr)-null mice have hyperhomocysteinemia, along with elevated AdoHcy and depressed AdoMet concentrations in liver and brain tissues [26]. Hyperhomocysteinemia in Mtrrgt/gt mice is comparable to that in Mthfr−/− mice (Table 2), suggesting that a similar result might also be expected for AdoMet and AdoHcy levels in Mtrr-gene trapped mice. The levels of AdoMet and AdoHcy measured in liver, kidney, heart, and brain tissues of wild type and Mtrrgt/gt mice are shown in Table 3. In heart tissue, the expected trend is seen, with higher levels of AdoHcy in the Mtrrgt/gt mice than in the wild type mice, and lower AdoMet/AdoHcy ratios. However, AdoMet and AdoHcy levels showed an unexpected trend in livers of Mtrrgt/gt mice, with AdoMet levels significantly higher in Mtrrgt/gt liver than in wild type, and AdoHcy concentrations lower in Mtrrgt/gt mice. These effects were measured in mice backcrossed four generations into the C57Bl/6J background, and confirmed in mice backcrossed eight generations into the same strain. In brain and kidney, AdoMet and AdoHcy concentrations were not different between Mtrrgt/gt mice and wild type controls.
Table 3.
AdoMet and AdoHcy concentrations and ratios in tissues of wild type and MTRR deficient mice
| AdoMet (nmol/g)a | AdoHcy (nmol/g)a | AdoMet/AdoHcya,b | ||||
|---|---|---|---|---|---|---|
| Tissue | +/+ | gt/gt | +/+ | gt/gt | +/+ | gt/gt |
| liverd | 45.9±4.5 | 64.1±6.4c | 60.6±8.3 | 30.7±4.7c | 0.9±0.2 | 2.9±0.6c |
| livere | 41.7±5.3 | 70.2±3.7c | 63.0±5.3 | 32.1±2.5c | 0.7±0.2 | 2.2±0.2c |
| liverf | 38.0±4.3 | 69.0±0.2c | 55.3±7.6 | 34.5±7.0 | 0.8 ±0.2 | 2.2±0.4c |
| heartf | 37.6±7.0 | 34.8±2.6 | 0.9±0.2 | 2.0±0.3c | 46.9±7.2 | 18.4±1.4c |
| kidneyf | 55.3±4.7 | 59.0±3.0 | 4.4±0.6 | 6.0±0.2 | 13.1±1.3 | 9.9±0.8 |
| braind | 18.7±1.2 | 17.8±1.1 | 3.9±1.0 | 3.4±1.2 | 16.2±5.5 | 19.7±5.0 |
| brainf | 21.4±0.9 | 21.8±1.5 | 2.6±0.3 | 2.2±0.2 | 8.5±1.1 | 9.9±0.5 |
values are expressed as mean ± standard error of the mean to facilitate comparison with measurements on other genetic mouse models with hyperhomocyst(e)inemia
AdoMet/AdoHcy values (mean ± SEM) were calculated using AdoMet/AdoHcy ratios determined for each individual tissue sample
statistically significant difference between Mtrr+/+ and Mtrrgt/gt values (mean ±SEM) as determined by unpaired t-test, p<0.05
N4F2 mice (9 wild type and 11 gt/gt)
N8F2 mice (3 wild type and 4 gt/gt)
N8F2 mice (4 of each genotype)
Analyses of folate pools in MTRR deficient mice
Mtrrgt/gt animals showed a trend towards elevated methyltetrahydrofolate in kidney, liver, and heart tissues compared to wild type mice, although this trend did not reach statistical significance (p=0.19, p=0.19, p=0.25, respectively) as determined by the two sample T test (Table 4). This pool was increased ~1.6-fold in kidney of Mtrrgt/gt mice as compared to Mtrr+/+ mice, and there was a concomitant 31% decrease in the levels of methylenetetrahydrofolate plus tetrahydrofolate. Since, in humans, methyl trapping (an elevated percentage of methyltetrahydrofolate/total folate) is associated with megaloblastic anemia, we analyzed red blood cell count and red blood cell morphology in Mtrrgt/gt mice. Red blood cell counts were normal in Mtrrgt/gt mice, and megaloblastic anemia was not detected (data not shown).
Table 4.
Folate concentrations in liver, heart, kidney and brain tissues of wild type and MTRR deficient micea
| Tissue genotype | 5,10-methyleneTHF + THFb | 5-methylTHFb | 10-formylTHFb | DHF + Fb | Total folatesb |
|---|---|---|---|---|---|
| Liver | |||||
| +/+ | 90±18 | 42±5 | 19±6 | 6.9±6.1 | 158±20 |
| gt/gt | 90±9 | 60±19 | 19±6 | 4.5±3.1 | 173±6 |
| Heart | |||||
| +/+ | 1.2±0.1 | 7.2±0.8 | 0.3±0.2 | 0.1±0.1 | 8.7±0.7 |
| gt/gt | 1.1±0.3 | 8.1±0.8 | 0.3±0.2 | 0.1±0.1 | 9.5±0.7 |
| Kidney | |||||
| +/+ | 40±14 | 21±3 | 4.1±3.5 | 1.4±1.2 | 67±11 |
| gt/gt | 31±5 | 34±14 | 4.6±4.6 | 0.9±0.8 | 70±13 |
| Brain | |||||
| +/+ | 5.7±0.9 | 3.1±0.6 | 0.5±0.9 | 0.4±0.2 | 9.8±0.9 |
| gt/gt | 5.7±0.7 | 3.1±0.4 | 0.3±0.6 | 0.2±0.1 | 9.4±0.5 |
values are given as mean ± standard deviation
pmol of folate per g of protein
Analyses of Mtrr expression in E9.5 embryos
Polymorphisms in the human methionine synthase reductase gene have been found to correlate with an increased risk of neural tube defects [33–37]. If MTRR is functionally important for proper neural tube closure in mice, Mtrr expression would be expected in or around the neural tube between days E8.5 to E10.5 [38]. Using β-galactosidase activity driven from the Mtrr gene trap allele in E9.5 Mtrr+/gt embryos as a marker for Mtrr expression, we detected ubiquitous Mtrr expression throughout the entire embryo (Fig. 5). Intense β-galactosidase expression was observed in the optic eminence, forebrain (telencephalon and diencephalon), midbrain, the 2nd and 4th rhombomeres of the hindbrain and the neural tube, consistent with a role for Mtrr in brain and neural tube development. Histological sectioning of these embryos also revealed β-galactosidase staining within the notochord (data not shown). A high level of Mtrr expression was also detected within the first brachial arch, splanchnic mesoderm, hindgut, foregut and the labyrinth layer of the placenta.
Fig. 5.

MTRR is highly expressed at E9.5 within the developing neural tube and placenta. Expression of β-galactosidase is shown in an Mtrr+/gt embryo (A) and the labyrinth layer of the Mtrr+/gt placenta (C) at E9.5, and in an Mtrr+/+ littermate embryo (B) and Mtrr+/+ placenta (D). The dams were Mtrr+/+ in all cases. b1, first brachial arch; b2, second brachial arch; op, optic eminence; ot, otic vesicle; nt, neural tube; te, telencephalon; di, diencephalon; mb, midbrain; r2, rhombomere 2; r4, rhombomere 4; da, dorsal aorta; sm, splanchnic mesoderm; he, heart; sp, spongiotrophoblast; la, labyrinth; al, allantois.
Discussion
In this report, we have generated and characterized a mouse model for methionine synthase reductase deficiency. In Mtrrgt/gt mice, the gene trap causes a hypomorphic expression pattern of wild type Mtrr mRNA that varies by tissue, but that is similar between males and females of the same genotype. Wild type Mtrr mRNA levels in Mtrrgt/gt mice varied between 37% and <1% of those of wild type mice, indicating tissue-specific skipping of the gene trap cassette. Western blot analyses of liver, heart, kidney and brain tissues prepared from Mtrr+/+ and Mtrrgt/gt mice show decreases in MTRR protein in all tissues analyzed (see Fig. 3). The ability of endogenous MTRR to activate endogenous methionine synthase was also measured. These experiments demonstrated a significant genotype-dependent decrease in methionine synthase activity in all tissues examined. As might be expected from the relative quantitative reverse transcription-PCR measurements, the decrease in activity was most pronounced in heart tissue. Male Mtrrgt/gt mice were 10% smaller by week 10 after birth than their heterozygous and wild type littermates. Wild-type male mice show an increased rate of growth compared to females as they approach adulthood. Therefore, disruption of methionine biosynthesis, which would lead to limited availability of methionine, might be expected to impair growth in mice, as demonstrated by a vitamin B12-deficient rat model [32].
Disruption of the Mtrr gene in embryonic stem cells was carried out at BayGenomics using gene trapping methodology, as pioneered by Skarnes and colleagues [39]. Gene trapping has provided thousands of new genetic models, the majority of which emulate their targeted deletional mutant counterparts. However, a substantial number of gene trap models produce some level of wild type mRNA in homozygotes carrying the gene trap [40–42]. Nonetheless, hypomorphic models may prove useful, especially if targeted deletion of a gene causes embryonic lethality. Homozygous deletion of the methionine synthase gene leads to embryonic lethality in mice, but the phenotype of heterozygous animals is quite mild [8]. Because methionine synthase reductase is believed to be required for reactivation of methionine synthase, and because the phenotype of cblE patients with low methionine synthase reductase levels is so severe, we hypothesize that complete suppression of methionine synthase reductase activity likely leads to embryonic lethality as well. A deletional model for the Mtrr gene has been generated in one of our laboratories. Heterozygous F1 intercross matings have thus far not resulted in any animals that are homozygous for the deletion (R. Gravel, unpublished results).
The Mtrrgt/gt animals show significant hyperhomocysteinemia and hypomethionemia, but surprisingly their intracellular AdoMet/AdoHcy ratios range from high to slightly below normal. The AdoMet/AdoHcy ratio in heart tissue is mildly decreased in heart, where the severest reduction of MTRR expression and activity is seen, and is maintained at approximately normal levels in kidney and brain. In liver, the AdoMet/AdoHcy ratio is actually significantly higher than that in wild type littermates (Table 3).
In this respect, Mtrr deficiency produces a very different profile from the well-characterized mouse model for Mthfr deficiency (Table 2). In the Mthfr−/− mouse, AdoMet/AdoHcy ratios in liver are about 6-fold lower than in the wild-type controls, while in brain they are about 5-fold lower [26]. The distinction between hyperhomocysteinemia produced by MTRR and/or methionine synthase deficiency and that produced by MTHFR deficiency has not been noted before. However, an examination of the literature provides hints that the very different AdoMet/AdoHcy ratios seen at roughly equivalent levels of hyperhomocysteinemia and hypomethionemia may be common to methionine synthase deficiency regardless of the method by which it is induced.
As shown in Table 2, mice heterozygous for the Mtr deletion (Mtr+/−), with reduced expression of methionine synthase, have AdoMet levels in liver that are higher than those in wild type littermates are by 25%. Additionally, their AdoHcy levels were 90% of those in wild type animals, leading to an AdoMet:AdoHcy ratio that was ~1.5x higher than in wild type littermates [43]. Similarly, in rats fed a vitamin B12 deficient diet for 5 weeks, which also leads to diminished methionine synthase activity, hepatic AdoMet levels increased 41%, and the AdoMet/AdoHcy ratio increased from 2.5 to 2.7, even as plasma homocysteine increased by ~2.4-fold [44]. The similar profiles seen when methionine synthase levels are reduced by genetic means or by vitamin B12-deficiency suggest that a compensatory mechanisms exist to spare intracellular AdoMet levels whenever methionine synthase activity is reduced, regardless of the mechanism by which decreased activity is induced.
The mechanisms by which mice with a functional methionine synthase deficiency maintain their cellular AdoMet/AdoHcy ratios in the face of their hyperhomocysteinemia and hypomethioninemia remain unclear. In tissues where betaine-homocysteine methyltransferase is expressed, such as liver and to a lesser extent kidney, this enzyme may compensate for the reduced level of MTRR and help to maintain the AdoMet/AdoHcy ratio in these tissues. Glycine-N-methyl transferase (GNMT) may also play an important role in this compensation, in those tissues where it is expressed. GNMT catalyzes the AdoMet-dependent methylation of glycine to produce sarcosine and AdoHcy. This methylation is thought to provide a means of regulating the level of AdoMet in cells, since the product sarcosine is rapidly reoxidized to glycine in mitochondria. Confirming this role for GNMT, mice completely lacking GNMT due to gene deletion exhibit a ~35-fold increase in AdoMet, with a ~3-fold decrease in AdoHcy [45]. Tissues with high levels of GNMT, such as liver or kidney [46], typically exhibit lower ratios of AdoMet/AdoHcy than do tissues like brain with very low levels of GNMT activity [47]. As shown in Table 3, the lowest AdoMet/AdoHcy ratios in wild type mice are found in liver, while those in kidney and brain are higher, and those in heart the highest of all. GNMT activity is allosterically inhibited by methyltetrahydrofolate. In the liver of the Mthfr−/− mouse, with only 4% of the methyltetrahydrofolate found in the wild-type littermates [26] GNMT activity should be nearly maximal. In contrast, when hyperhomocysteinemia is induced by methionine synthase deficiency, methyltetrahydrofolate levels in tissues will be normal to high, and GNMT activity would be expected to be strongly inhibited, thus preserving the AdoMet/AdoHcy ratio.
While these arguments would explain the observation of normal AdoMet/AdoHcy ratios in mice with a functional methionine synthase deficiency, it would not explain the elevated levels we observe in liver, unless methyl-trapping leads to more inhibition of liver GNMT than in the wild-type littermates. Inspection of Table 4 reveals that the absolute concentrations of methyltetrahydrofolate are higher in liver than in other tissues, in both wild type and Mthfrgt/gt mice. GNMT specific activity is normally highest in liver, so the sparing effect may be greatest in this tissue if it is indeed due to inhibition of GNMT activity. The concentration of methyltetrahydrofolate observed in the livers of Mtrrgt/gt mice is 142% of that in wild type littermates. However, other factors may also contribute to the observed increase in the AdoMet/AdoHcy ratio in the livers of our gene trapped mice.
Regardless of its origin, the very different ratios of AdoMet/AdoHcy in the various genetic mouse models for hyperhomocysteinemia have potentially important medical implications. The different folate distributions in the Mtrrgt/gt and the Mthfr−/− mice may be useful in understanding how the distribution rather than the amount of folate affects various pathologies associated with folate deficiency. The dramatic effect of maternal dietary supplementation with folic acid in protecting against neural tube defects in the fetus has been known for some time [48,49]. What is not yet known is why neural crest cells are particularly vulnerable to folate deficiency, or what forms of folate are protective. Do neural tube defects arise because of apoptosis of neural crest cells due to an insufficient supply of methylenetetrahydrofolate, or because of pathologies arising from altered AdoMet/AdoHcy ratios [50]? If the incidence of neural tube defects in the progeny of the Mthfr−/− mouse were found to be different from that in the progeny of the Mtrrgt/gt mouse, important insights into the role of folate in preventing neural tube defects would be obtained.
Similarly, comparison of hyperhomocyst(e)inemic mouse models may be useful in understanding pathologies associated with elevated plasma homocysteine. Homocysteine has emerged as a significant risk factor for adverse cardiovascular events, including heart disease and stroke [51–55]. It is interesting to note that MTRR function in the heart is particularly impacted in Mtrrgt/gt mice. Future study of heart tissues may reveal subtle phenotypic differences and clarify the effects of decreased MTRR function and hyperhomocysteinemia in the hearts of these mice. Detailed studies of embryonic abnormalities induced by MTRR deficiency and of cardiac function in the adult Mtrrgt/gt mouse are currently underway in the Rozen and Gravel laboratories. Not all people with elevated plasma homocysteine may be equally at risk for the development of cardiovascular disease. To date, there are four genetic mouse models with hyperhomocyst(e)inemia, the three mentioned above and a model with a disruption in cystathionine-β-synthase (Cbs), which results in the inability to convert homocysteine to cysteine [56]. The metabolite levels in these four mouse models are summarized in Table 2. While all of these models cause hyperhomocyst(e)inemia, in two of these mouse models (Cbs and Mthfr), the AdoMet/AdoHcy ratios are lower in the mutant animals than in wild type, while in the remaining two models (Mtr and Mtrr), the AdoMet/AdoHcy values are the same or higher in the mutant animals than in wild type. Careful studies of the incidence of cardiovascular pathology in each of these models may allow us to determine whether it is the low intracellular AdoMet:AdoHcy ratio that is associated with cardiovascular disease or the high level of total homocysteine in the blood.
Supplementary Material
Acknowledgments
This research was funded by National Institutes of Health Grants HL58955 (to RAG, RGM, RR) and DK54388 (to SAK), and the Canadian Institutes of Health Research. We thank Dr. Kazuhiro Yamada for purified recombinant human methionine synthase reductase and purified recombinant human methionine synthase, Sha Huang for partially purified pig methionine synthase from pig liver used in preliminary activity assays with animal tissue homogenates, and Rebecca Lynch for tissue sample preparations and mouse colony management. We would like to express gratitude to Dr. David Ginsburg, Randall Westrick and Dr. David Motto for the many constructive discussions and guidance concerning genetic mouse model generation and characterization. We also thank Dr. Ruma Banerjee and Carmen Gherasim for anti-MTRR antibodies used to confirm Western results. We are grateful to Dr. Thom Saunders and the University of Michigan Transgenic Animal Model Core for mouse generation, and the NIH funded BayGenomics Gene Trap Consortium of Bay Area Universities for generation, identification and distribution of Mtrr+/gt XG334 embryonic stem cells.
Footnotes
Publisher's Disclaimer: This is a PDF file of an unedited manuscript that has been accepted for publication. As a service to our customers we are providing this early version of the manuscript. The manuscript will undergo copyediting, typesetting, and review of the resulting proof before it is published in its final citable form. Please note that during the production process errors may be discovered which could affect the content, and all legal disclaimers that apply to the journal pertain.
References
- 1.Olteanu H, Banerjee R. Human methionine synthase reductase, a soluble P-450 reductase-like dual flavoprotein, is sufficient for NADPH-dependent methionine synthase activation. J Biol Chem. 2001;276:35558–35563. doi: 10.1074/jbc.M103707200. [DOI] [PubMed] [Google Scholar]
- 2.Gulati S, Chen Z, Brody LC, Rosenblatt DS, Banerjee R. Defects in auxiliary redox proteins lead to functional methionine synthase deficiency. J Biol Chem. 1997;272:19171–19175. doi: 10.1074/jbc.272.31.19171. [DOI] [PubMed] [Google Scholar]
- 3.Jencks DA, Matthews RG. Allosteric inhibition of methylenetetrahydrofolate reductase by adenosylmethionine. Effects of adenosylmethionine and NADPH on the equilibrium between active and inactive forms of the enzyme and on the kinetics of approach to equilibrium. J Biol Chem. 1987;262:2485–2493. [PubMed] [Google Scholar]
- 4.Kutzbach C, Stokstad EL. Mammalian methylenetetrahydrofolate reductase. Partial purification, properties, and inhibition by S-adenosylmethionine. Biochim Biophys Acta. 1971;250:459–477. doi: 10.1016/0005-2744(71)90247-6. [DOI] [PubMed] [Google Scholar]
- 5.Smulders YM, Smith DE, Kok RM, Teerlink T, Swinkels DW, Stehouwer CD, Jakobs C. Cellular folate vitamer distribution during and after correction of vitamin B12 deficiency: a case for the methylfolate trap. Br J Haematol. 2006;132:623–629. doi: 10.1111/j.1365-2141.2005.05913.x. [DOI] [PubMed] [Google Scholar]
- 6.Koury MJ, Horne DW, Brown ZA, Pietenpol JA, Blount BC, Ames BN, Hard R, Koury ST. Apoptosis of late-stage erythroblasts in megaloblastic anemia: association with DNA damage and macrocyte production. Blood. 1997;89:4617–4623. [PubMed] [Google Scholar]
- 7.Koury MJ, Price JO, Hicks GG. Apoptosis in megaloblastic anemia occurs during DNA synthesis by a p53-independent, nucleoside-reversible mechanism. Blood. 2000;96:3249–3255. [PubMed] [Google Scholar]
- 8.Swanson DA, Liu ML, Baker PJ, Garrett L, Stitzel M, Wu J, Harris M, Banerjee R, Shane B, Brody LC. Targeted disruption of the methionine synthase gene in mice. Mol Cell Biol. 2001;21:1058–1065. doi: 10.1128/MCB.21.4.1058-1065.2001. [DOI] [PMC free article] [PubMed] [Google Scholar]
- 9.Drummond JT, Huang S, Blumenthal RM, Matthews RG. Assignment of enzymic function to specific protein regions of cobalamin-dependent methionine synthase from Escherichia coli. Biochemistry. 1993;32:9290–9295. doi: 10.1021/bi00087a005. [DOI] [PubMed] [Google Scholar]
- 10.Fujii K, Galivan JH, Huennekens FM. Activation of methionine synthase: further characterization of flavoprotein system. Arch Biochem Biophys. 1977;178:662–670. doi: 10.1016/0003-9861(77)90238-7. [DOI] [PubMed] [Google Scholar]
- 11.Banerjee RV, Harder SR, Ragsdale SW, Matthews RG. Mechanism of reductive activation of cobalamin-dependent methionine synthase: an electron paramagnetic resonance spectroelectrochemical study. Biochemistry. 1990;29:1129–1135. doi: 10.1021/bi00457a005. [DOI] [PubMed] [Google Scholar]
- 12.Porter TD, Kasper CB. NADPH-cytochrome P-450 oxidoreductase: flavin mononucleotide and flavin adenine dinucleotide domains evolved from different flavoproteins. Biochemistry. 1986;25:1682–1687. doi: 10.1021/bi00355a036. [DOI] [PubMed] [Google Scholar]
- 13.Fujii K, Huennekens FM. Activation of methionine synthetase by a reduced triphosphopyridine nucleotide-dependent flavoprotein system. J Biol Chem. 1974;249:6745–6753. [PubMed] [Google Scholar]
- 14.Osborne C, Chen LM, Matthews RG. Isolation, cloning, mapping, and nucleotide sequencing of the gene encoding flavodoxin in Escherichia coli. J Bacteriol. 1991;173:1729–1737. doi: 10.1128/jb.173.5.1729-1737.1991. [DOI] [PMC free article] [PubMed] [Google Scholar]
- 15.Olteanu H, Banerjee R. Redundancy in the pathway for redox regulation of mammalian methionine synthase: reductive activation by the dual flavoprotein, novel reductase 1. J Biol Chem. 2003;278:38310–38314. doi: 10.1074/jbc.M306282200. [DOI] [PubMed] [Google Scholar]
- 16.Rosenblatt DS, Cooper BA. Inherited disorders of vitamin B12 utilization. Bioessays. 1990;12:331–334. doi: 10.1002/bies.950120705. [DOI] [PubMed] [Google Scholar]
- 17.Raff ML, Crane AM, Jansen R, Ledley FD, Rosenblatt DS. Genetic characterization of a MUT locus mutation discriminating heterogeneity in mut0 and mut- methylmalonic aciduria by interallelic complementation. J Clin Invest. 1991;87:203–207. doi: 10.1172/JCI114972. [DOI] [PMC free article] [PubMed] [Google Scholar]
- 18.Watkins D, Matiaszuk N, Rosenblatt DS. Complementation studies in the cblA class of inborn error of cobalamin metabolism: evidence for interallelic complementation and for a new complementation class (cblH) J Med Genet. 2000;37:510–513. doi: 10.1136/jmg.37.7.510. [DOI] [PMC free article] [PubMed] [Google Scholar]
- 19.Wilson A, Leclerc D, Rosenblatt DS, Gravel RA. Molecular basis for methionine synthase reductase deficiency in patients belonging to the cblE complementation group of disorders in folate/cobalamin metabolism. Hum Mol Genet. 1999;8:2009–2016. doi: 10.1093/hmg/8.11.2009. [DOI] [PubMed] [Google Scholar]
- 20.Leclerc D, Wilson A, Dumas R, Gafuik C, Song D, Watkins D, Heng HH, Rommens JM, Scherer SW, Rosenblatt DS, Gravel RA. Cloning and mapping of a cDNA for methionine synthase reductase, a flavoprotein defective in patients with homocystinuria. Proc Natl Acad Sci USA. 1998;95:3059–3064. doi: 10.1073/pnas.95.6.3059. [DOI] [PMC free article] [PubMed] [Google Scholar]
- 21.Rosenblatt DS, Cooper BA, Pottier A, Lue-Shing H, Matiaszuk N, Grauer K. Altered vitamin B12 metabolism in fibroblasts from a patient with megaloblastic anemia and homocystinuria due to a new defect in methionine biosynthesis. J Clin Invest. 1984;74:2149–2156. doi: 10.1172/JCI111641. [DOI] [PMC free article] [PubMed] [Google Scholar]
- 22.Watkins D, Rosenblatt DS. Genetic heterogeneity among patients with methylcobalamin deficiency. Definition of two complementation groups, cblE and cblG. J Clin Invest. 1988;81:1690–1694. doi: 10.1172/JCI113507. [DOI] [PMC free article] [PubMed] [Google Scholar]
- 23.Steen C, Rosenblatt DS, Scheying H, Braeuer HC, Kohlschutter A. Cobalamin E (cblE) disease: a severe neurological disorder with megaloblastic anaemia, homocystinuria and low serum methionine. J Inherit Metab Dis. 1997;20:705–706. doi: 10.1023/a:1005382627986. [DOI] [PubMed] [Google Scholar]
- 24.Fowler B, Schutgens RB, Rosenblatt DS, Smit GP, Lindemans J. Folate-responsive homocystinuria and megaloblastic anaemia in a female patient with functional methionine synthase deficiency (cblE disease) J Inherit Metab Dis. 1997;20:731–741. doi: 10.1023/a:1005372730310. [DOI] [PubMed] [Google Scholar]
- 25.Zavadakova P, Fowler B, Suormala T, Novotna Z, Mueller P, Hennermann JB, Zeman J, Vilaseca MA, Vilarinho L, Gutsche S, Wilichowski E, Horneff G, Kozich V. cblE type of homocystinuria due to methionine synthase reductase deficiency: functional correction by minigene expression. Hum Mutat. 2005;25:239–247. doi: 10.1002/humu.20131. [DOI] [PubMed] [Google Scholar]
- 26.Chen Z, Karaplis AC, Ackerman SL, Pogribny IP, Melnyk S, Lussier-Cacan S, Chen MF, Pai A, John SWM, Smith RS, Bottiglieri T, Bagley P, Selhub J, Rudnicki MA, James SJ, Rozen R. Mice deficient in methylenetetrahydrofolate reductase exhibit hyperhomocysteinemia and decreased methylation capacity, with neuropathology and aortic lipid deposition. Hum Mol Genet. 2001;10:433–443. doi: 10.1093/hmg/10.5.433. [DOI] [PubMed] [Google Scholar]
- 27.Dayal S, Bottiglieri T, Arning E, Maeda N, Malinow MR, Sigmund CD, Heistad DD, Faraci FM, Lentz SR. Endothelial dysfunction and elevation of S-adenosylhomocysteine in cystathionine beta-synthase-deficient mice. Circ Res. 2001;88:1203–1209. doi: 10.1161/hh1101.092180. [DOI] [PubMed] [Google Scholar]
- 28.Yamada K, Gravel RA, Toraya T, Matthews RG. Human methionine synthase reductase is a molecular chaperone for human methionine synthase. Proc Natl Acad Sci USA. 2006;103:9476–9481. doi: 10.1073/pnas.0603694103. [DOI] [PMC free article] [PubMed] [Google Scholar]
- 29.Ubbink JB, Hayward Vermaak WJ, Bissbort S. Rapid high-performance liquid chromatographic assay for total homocysteine levels in human serum. J Chromatogr. 1991;565:441–446. doi: 10.1016/0378-4347(91)80407-4. [DOI] [PubMed] [Google Scholar]
- 30.Bottiglieri T. Isocratic high performance liquid chromatographic analysis of S-adenosylmethionine and S-adenosylhomocysteine in animal tissues: the effect of exposure to nitrous oxide. Biomed Chromatogr. 1990;4:239–241. doi: 10.1002/bmc.1130040606. [DOI] [PubMed] [Google Scholar]
- 31.Priest DG, Schmitz JC, Bunni MA, Stuart RK. Pharmacokinetics of leucovorin metabolites in human plasma as a function of dose administered orally and intravenously. J Natl Cancer Inst. 1991;83:1806–1812. doi: 10.1093/jnci/83.24.1806. [DOI] [PubMed] [Google Scholar]
- 32.Kawata T, Tashiro A, Tamiki A, Suga K, Kamioka S, Yamada K, Wada M, Tadokoro T, Maekawa A. Utilization of dietary protein in the vitamin B12-deficient rats. Int J Vitam Nutr Res. 1995;65:248–254. [PubMed] [Google Scholar]
- 33.Wilson A, Platt R, Wu Q, Leclerc D, Christensen B, Yang H, Gravel RA, Rozen R. A common variant in methionine synthase reductase combined with low cobalamin (vitamin B12) increases risk for spina bifida. Mol Genet Metab. 1999;67:317–323. doi: 10.1006/mgme.1999.2879. [DOI] [PubMed] [Google Scholar]
- 34.Doolin MT, Barbaux S, McDonnell M, Hoess K, Whitehead AS, Mitchell LE. Maternal genetic effects, exerted by genes involved in homocysteine remethylation, influence the risk of spina bifida. Am J Hum Genet. 2002;71:1222–1226. doi: 10.1086/344209. [DOI] [PMC free article] [PubMed] [Google Scholar]
- 35.Zhu H, Wicker NJ, Shaw GM, Lammer EJ, Hendricks K, Suarez L, Canfield M, Finnell RH. Homocysteine remethylation enzyme polymorphisms and increased risks for neural tube defects. Mol Genet Metab. 2003;78:216–221. doi: 10.1016/s1096-7192(03)00008-8. [DOI] [PubMed] [Google Scholar]
- 36.Gueant-Rodriguez RM, Rendeli C, Namour B, Venuti L, Romano A, Anello G, Bosco P, Debard R, Gerard P, Viola M, Salvaggio E, Gueant JL. Transcobalamin and methionine synthase reductase mutated polymorphisms aggravate the risk of neural tube defects in humans. Neurosci Lett. 2003;344:189–192. doi: 10.1016/s0304-3940(03)00468-3. [DOI] [PubMed] [Google Scholar]
- 37.Relton CL, Wilding CS, Pearce MS, Laffling AJ, Jonas PA, Lynch SA, Tawn EJ, Burn J. Gene-gene interaction in folate-related genes and risk of neural tube defects in a UK population. J Med Genet. 2004;41:256–260. doi: 10.1136/jmg.2003.010694. [DOI] [PMC free article] [PubMed] [Google Scholar]
- 38.Copp AJ, Greene ND, Murdoch JN. The genetic basis of mammalian neurulation. Nat Rev Genet. 2003;4:784–793. doi: 10.1038/nrg1181. [DOI] [PubMed] [Google Scholar]
- 39.Gossler A, Joyner AL, Rossant J, Skarnes WC. Mouse embryonic stem cells and reporter constructs to detect developmentally regulated genes. Science. 1989;244:463–465. doi: 10.1126/science.2497519. [DOI] [PubMed] [Google Scholar]
- 40.Voss AK, Thomas T, Gruss P. Compensation for a gene trap mutation in the murine microtubule-associated protein 4 locus by alternative polyadenylation and alternative splicing. Dev Dyn. 1998;212:258–266. doi: 10.1002/(SICI)1097-0177(199806)212:2<258::AID-AJA10>3.0.CO;2-0. [DOI] [PubMed] [Google Scholar]
- 41.Li J, Zhu X, Chen M, Cheng L, Zhou D, Lu MM, Du K, Epstein JA, Parmacek MS. Myocardin-related transcription factor B is required in cardiac neural crest for smooth muscle differentiation and cardiovascular development. Proc Natl Acad Sci USA. 2005;102:8916–8921. doi: 10.1073/pnas.0503741102. [DOI] [PMC free article] [PubMed] [Google Scholar]
- 42.Galy B, Ferring D, Benesova M, Benes V, Hentze MW. Targeted mutagenesis of the murine IRP1 and IRP2 genes reveals context-dependent RNA processing differences in vivo. RNA. 2004;10:1019–1025. doi: 10.1261/rna.7220704. [DOI] [PMC free article] [PubMed] [Google Scholar]
- 43.Dayal S, Devlin AM, McCaw RB, Liu ML, Arning E, Bottiglieri T, Shane B, Faraci FM, Lentz SR. Cerebral vascular dysfunction in methionine synthase-deficient mice. Circulation. 2005;112:737–744. doi: 10.1161/CIRCULATIONAHA.104.529248. [DOI] [PubMed] [Google Scholar]
- 44.Miller JW. Ph.D thesis. Tufts University; Boston: 1993. The pathogenesis of homocysteinemia due to B vitamin deficiencies. [Google Scholar]
- 45.Luka Z, Capdevila A, Mato JM, Wagner C. A glycine N-methyltransferase knockout mouse model for humans with deficiency of this enzyme. Transgenic Res. 2006;15:393–397. doi: 10.1007/s11248-006-0008-1. [DOI] [PMC free article] [PubMed] [Google Scholar]
- 46.Yeo EJ, Wagner C. Tissue distribution of glycine N-methyltransferase, a major folate-binding protein of liver. Proc Natl Acad Sci USA. 1994;91:210–214. doi: 10.1073/pnas.91.1.210. [DOI] [PMC free article] [PubMed] [Google Scholar]
- 47.Kerr SJ. Competing methyltransferase systems. J Biol Chem. 1972;247:4248–4252. [PubMed] [Google Scholar]
- 48.Centers for Disease Control. Use of folic acid for prevention of spina bifida and other neural tube defects--1983–1991. Morb Mortal Wkly Rep. 1991;40:513–516. [PubMed] [Google Scholar]
- 49.MRC Vitamin Study Research Group. Prevention of neural tube defects: results of the Medical Research Council Vitamin Study. Lancet. 1991;338:131–137. [PubMed] [Google Scholar]
- 50.Blom HJ, Shaw GM, den Heijer M, Finnell RH. Neural tube defects and folate: case far from closed. Nat Rev Neurosci. 2006;7:724–731. doi: 10.1038/nrn1986. [DOI] [PMC free article] [PubMed] [Google Scholar]
- 51.Boushey CJ, Beresford SA, Omenn GS, Motulsky AG. A quantitative assessment of plasma homocysteine as a risk factor for vascular disease. Probable benefits of increasing folic acid intakes. JAMA. 1995;274:1049–1057. doi: 10.1001/jama.1995.03530130055028. [DOI] [PubMed] [Google Scholar]
- 52.Bostom AG, Rosenberg IH, Silbershatz H, Jacques PF, Selhub J, D’Agostino RB, Wilson PW, Wolf PA. Nonfasting plasma total homocysteine levels and stroke incidence in elderly persons: the Framingham Study. Ann Intern Med. 1999;131:352–355. doi: 10.7326/0003-4819-131-5-199909070-00006. [DOI] [PubMed] [Google Scholar]
- 53.Clarke R, Daly L, Robinson K, Naughten E, Cahalane S, Fowler B, Graham I. Hyperhomocysteinemia: an independent risk factor for vascular disease. N Engl J Med. 1991;324:1149–1155. doi: 10.1056/NEJM199104253241701. [DOI] [PubMed] [Google Scholar]
- 54.McCully KS. Vascular pathology of homocysteinemia: implications for the pathogenesis of arteriosclerosis. Am J Pathol. 1969;56:111–128. [PMC free article] [PubMed] [Google Scholar]
- 55.Selhub J, Jacques PF, Bostom AG, D’Agostino RB, Wilson PW, Belanger AJ, O’Leary DH, Wolf PA, Schaefer EJ, Rosenberg IH. Association between plasma homocysteine concentrations and extracranial carotid-artery stenosis. N Engl J Med. 1995;332:286–291. doi: 10.1056/NEJM199502023320502. [DOI] [PubMed] [Google Scholar]
- 56.Watanabe M, Osada J, Aratani Y, Kluckman K, Reddick R, Malinow MR, Maeda N. Mice deficient in cystathionine beta-synthase: animal models for mild and severe homocyst(e)inemia. Proc Natl Acad Sci USA. 1995;92:1585–1589. doi: 10.1073/pnas.92.5.1585. [DOI] [PMC free article] [PubMed] [Google Scholar]
Associated Data
This section collects any data citations, data availability statements, or supplementary materials included in this article.