

Abstract
Optimality models collapse the vagaries of genetics into simple trade-offs to calculate phenotypes expected to evolve by natural selection. Optimality approaches are commonly criticized for this neglect of genetic details, but resolution of this disagreement has been difficult. The importance of genetic details may be tested by experimental evolution of a trait for which an optimality model exists and in which genetic details can be studied. Here we evolved lysis time in bacteriophage T7, a virus of Escherichia coli. Lysis time is equivalent to the age of reproduction in an organism that reproduces once and then dies. Delaying lysis increases the number of offspring but slows generation time, and this trade-off renders the optimum sensitive to environmental conditions: earlier lysis is favored when bacterial hosts are dense, later lysis is favored when hosts are sparse. In experimental adaptations, T7 evolved close to the optimum in conditions favoring early lysis but not in conditions favoring late lysis. One of the late lysis adaptations exhibited no detectable phenotypic evolution despite genetic evolution; the other evolved only partly toward the expected optimum. Overall, the lysis time of the adapted phages remained closer to their starting values than predicted by the model. From the perspective of the optimality model, the experimental conditions were expected to select changes only along the postulated trade-off, but a trait outside the trade-off evolved as well. Evidence suggests that the model's failure ultimately stems from a violation of the trade-off, rather than a paucity of mutations.
Keywords: Adaptation, bacteriophage, experimental evolution, genetic constraint, genome evolution, life history, lysis, optimality, T7
Understanding the ultimate causes of phenotypic variation is one of the fundamental goals of evolutionary biologists. Optimality is a convenient tool because it allows us to focus on natural selection, which is both a powerful process in phenotypic evolution and one that is frequently amenable to a priori hypotheses. If optimality models match empirical observations, especially if they do so quantitatively, it suggests that we understand what shapes phenotype evolution (Orzack and Sober 1994). Optimality models assume that traits vary freely within relationships constrained by simple trade-offs, which otherwise allows these models to neglect the genetic and molecular bases by which phenotypes are formed and evolve. Although some optimality models are genetically explicit, the accommodation of detailed mechanisms can render models less general. By neglecting genetic details, optimality models can potentially predict phenotype across a wide range of ecologies, often independent of organism.
The tool of optimality has been widely used, especially for traits thought to change relatively easily, such as behavior and life history. Optimality models of sex ratio (Charnov 1982), foraging behavior (Charnov 1976; West et al. 2000), altruism (Axelrod and Hamilton 1981), age of first reproduction (Stearns and Crandall 1981), parental investment (Trivers 1972), senescence (Novoseltsev et al. 2002), and others (Krebs and Davies 1993, 1997) have played a vital role in developing our framework of evolution. The uses of optimality theory range from yielding a broad perspective for the foundations of evolution to providing quantitative insights about the evolution of specific traits (as with sex ratio).
The simplifications used in many optimality approaches, especially at the genetic level, have been criticized as fundamental flaws that render the optimality approach useless or suspect (Gould and Lewontin 1979; Pierce and Ollasen 1987; Walters and Martell 2004). The prior lack of resolution of this controversy may be attributed largely to insufficient knowledge of the genetic architecture of phenotypes. However, the genomics era may finally give us the tools to analyze phenotype genetics and may allow us to answer the critical question behind this disagreement: does understanding life-history evolution require a familiarity with genetic details, or do models assuming simple generalized trade-offs successfully describe adaptation? If genomes adapt successfully and freely enough, their idiosyncrasies perhaps can be ignored, despite or even because of the complexity of their mechanisms. However, if some traits cannot change or if limitations imposed by pleiotropy and other constraints, lack of mutations, or small population size greatly influence evolution by changing the trade-off surface or preventing adaptation along it, we must take genetic details into account.
For a number of reasons, it is difficult to test the success of optimality by observing natural populations, at least because many factors not considered by the model may vary between populations and confound the comparisons. Here, we use an experimental adaptation of a phage to test a priori quantitative predictions of a simple life-history optimality model.
MODEL SYSTEM: LYSIS TIME
Bacteriophages or “phages” are viruses that infect bacteria. Obligately lytic phages have simple life cycles somewhat like that of plants and animals that reproduce only once (Fig. 1). First, during what might be considered an environmental or dispersal phase, the phage has left its “maternal” host and not yet infected a new one. The length of this period depends on environmental factors such as host density and phage diffusion rates, as well as the adsorption rate of the phage. The next phase, eclipse, is analogous to a juvenile phase. During this period, the phage has infected a cell, but has not yet produced any progeny. It is instead co-opting the host's cellular machinery to make the cell a phage factory. At the end of the eclipse, E minutes after infection, phage progeny begin to be produced within the cell. Progeny numbers within the cell increase monotonically over time; a linear accumulation has been observed in each of the three phages thus far assayed (Hutchinson and Sinsheimer 1966; Josslin 1970; Wang 2006), with up to as much as 1000 progeny in phage (Reader and Siminovitch 1971). Although these phage progeny are fully constructed and viable, they remain trapped inside the cell. Finally, at lysis, L minutes after infection, the phage ruptures its host's cell wall to release its progeny into the environment, and phage production stops. The time between the eclipse time and the lysis time (L – E) is the posteclipse time.
Figure 1.

The basic life cycle of a lytic phage is analogous to that of many other organisms that reproduce only once. The environmental period, in which phage awaits contact with a host, is similar to dispersal. The eclipse period is the time after infection but before any viable progeny are constructed. This period, in which the host is turned into a phage factory, is much like the juvenile phase of other organisms. In the posteclipse period, “adulthood,” progeny begin to accumulate inside the cell. The phage accumulation function is linear in all known cases, meaning that progeny are assembled within the cell at a constant rate after eclipse. Lysis allows the viral progeny to escape the host cell at the end of an infection but halts further phage production inside the cell. Later lysis increases the amount of phage produced inside the cell but also increases generation time.
Lysis timing impacts two viral fitness components, fecundity and generation time. If a phage lyses early, generation time is short but relatively few progeny are produced from that host. If it lyses late, it produces more progeny but at the cost of increasing its generation time. Consequently, the optimal lysis time depends on external factors, one of the most useful being the density of hosts, which sets a lower limit on generation time (Wang et al. 1996; Abedon et al. 2001, 2003; Wang 2006). The optimal lysis time parallels a result from optimal foraging in a patchy environment, in which the optimal amount of time spent in a resource patch varies depending on the density of patches (Charnov 1976). Sparse hosts increase the relative value of the current host and thus increase optimal lysis time.
Although host density is predicted to have a major effect on the evolution of lysis time, it is a property of the natural phage environment that is nearly impossible to measure and is likely to vary widely (Hambly and Suttle 2005). To overcome this difficulty, we use an experimental approach, creating environments of different, constant host density to provide a range of optima. Although these conditions are artificial, it is plausible that phages might encounter them in the wild at least briefly. The conditions are also uniform enough and designed so that plasticity in lysis time should not be a factor in the evolution (Abedon 1992). Most importantly for the test of the model, we can hold essentially all environmental conditions constant except density of permissive hosts, thus avoiding selection of unwanted traits and ensuring an ideal fit to the model assumptions.
THE OPTIMALITY MODEL
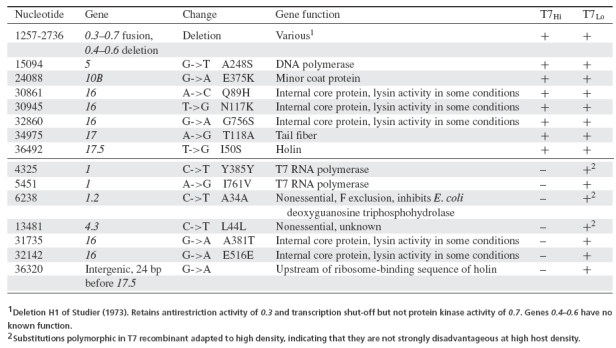
The equation for the optimal lysis time is approximately
| (1) |
(quantitative model from Bull 2006 based on the assumptions of Wang et. al. 1996). The optimal lysis time at equilibrium  equals the duration of eclipse time (E) plus the inverse of the intrinsic rate of increase of the phage
  when the phage is at the optimum. The model thus predicts that the optimal posteclipse period (L − E) changes in response to environmental conditions that alter fitness, such as host density. The advantage of this result is that it consists of just three easily measured properties of the phage: lysis time, eclipse time, and population growth rate. The first two depend on cell physiology, but not cell density per se, whereas growth rate depends on the entire suite of passage conditions.
This model assumes a linear burst size function as in Figure 1, a constant density of hosts in excess of phage density (with adsorptions according to a mass action process of collisions between bacteria and phage), and strict genetic control of lysis time. From Bull (2006), the resulting equation for asymptotic phage growth in our simplified experimental environments is r = A(be− Lr − 1), where b is burst size and A is the product of cell density and adsorption rate. The optimum is found by differentiating with respect to b, setting ∂r/∂b = 0, and treating L as a function of b.
When formula (1) is parameterized with empirical data, equality indicates that optimality conditions are potentially satisfied. It is of course possible that the equality is satisfied but the phage is not at the optimum. For example, if the phage was poorly adapted to the host, one could find a host density (hence a value of r) that satisfied (1), but adaptation would improve r and thus reveal that the phage had not been at the optimum. Worse, when the equality is not satisfied, the formula does not give the optimum, although it can be used to indicate the direction of the deviation from the optimum. The problem is that the optimum is  but the data give an estimate of only E # 1/r. Without knowing what
  should be, it is not possible to specify the optimum. However, if the phage has reached close to its maximum r, further changes will not greatly affect the values. If the relevant parameters of the phage life history are known (including the linear accumulation function of Fig. 1), the optimum can be calculated directly.
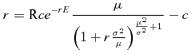
Some key assumptions in this model are: (1) the phage accumulation function is fixed and linear; (2) hosts are at constant density and in great excess of phage; (3) infected cells lyse exactly L minutes after infection, without any phenotypic variance. The first assumption has been relaxed somewhat by allowing two alternative linear phage accumulation functions. This simple extension does not affect optimality conditions for our purposes here (Bull 2006). The second assumption is not realistic for natural populations but can be enforced experimentally. The third assumption can be relaxed and the model can be solved for normal and gamma distributions of lysis times (Appendix 1). With a normal distribution of posteclipse times (X), the optimum is given by
| (2) |
where
| (3) |
and σ2 is the variance in lysis time between infections (Appendix 1). Although this result is exact, the assumption of normality violates phage biology because negative values of X (which are allowed by normality) are assigned negative burst sizes in the model. So the result is biologically feasible only for rσ2 < 1 at best (Appendix 1). If the distribution of posteclipse times is gamma, the optimum satisfies (2), where  is the solution to
| (4) |
Because the gamma distribution does not allow negative values, this result can be applied generally. Unfortunately, equation (4) cannot be solved explicitly, but it does offer a useful limit and approximations. The limit of  as σ2 → 0 is
  . Equation (3) is the σ2 first-order approximation of
  , and a further approximation is possible under restrictive conditions on r and σ2 (Appendix 1). If all else fails, equation (4) is easily solved numerically.
BACTERIOPHAGE T7
The phage used here is the obligately lytic T7, which infects many lab strains of Escherichia coli. Its genome is 40 kb double-stranded DNA with approximately 60 genes (Molineux 1999). The phage encodes its own DNA polymerase and RNA polymerase (both having been adopted for use in molecular biology), and its genome regulation has been the subject of a virtual infection model (Endy et al. 2000). Even for a phage, T7 is remarkably fecund, and adapted strains can increase by a trillion-fold per hour (this article and Heineman et al. 2005). Phages similar to T7 make up a large proportion of the global phage population, which in turn makes up a large amount of the world's biomass (Suttle 2005).
MECHANISMS OF LYSIS TIMING
Lysis is better understood at a biochemical and genetic level than almost any other nontrivial life-history trait. At a superficial level, the molecular basis of lysis is similar among many phages, despite the fact that lysis appears to have evolved independently many times (Young 1992; Fig. 2). In phages with all but the smallest genomes, lysis is effected by two molecules, an enzyme to degrade the cell wall (lysin) and a timer (holin). A lysin produced by the phage has the enzymatic activity to break down the cell wall; four different families of phage hydrolases are known that have this activity (Nelson et al. 2006). However, the cell wall lies outside the inner membrane, and lysins do not have the ability to get past the inner membrane by themselves. Thus, a second type of molecule is involved as well—the holin, a membrane protein that creates pores in the inner membrane. Interestingly, the holin does not appear to create pores gradually, but triggers membrane permeabilization suddenly (Grundling et al. 2001). This permeabilization allows the lysin to access the cell wall, where it quickly lyses the bacterial host (Young 1992). In some phages, the lysin is exported first and then activated by a holin, which preserves the status of holin as timekeeper (Xu et al. 2004).
Figure 2.

General molecular model for lysis. The lysin, which can destroy the cell wall, is at first held away from the cell wall by the inner membrane. Phage progeny continue to increase inside the cell, but are not released. Holin acts as timekeeper by permeabilizing the membrane rapidly at some point. This allows lysins to pass the inner membrane and destroy the cell wall all at once, killing the host and releasing phage. Although T7 has the genetic characteristics of lysis in many other phages, its lysis mechanisms are not as well understood.
In bacteriophage λ, lysis timing can change greatly based on single mutations in the holin, suggesting that lysis time may in many cases be capable of rapid evolution (Ramanculov and Young 2001; Wang 2006). Those studies have also demonstrated little apparent pleiotropy between lysis time and other traits. Collectively, therefore, the molecular basis of lysis in many phages matches many assumptions in the optimality model, including the genetic malleability of lysis timing. The molecular basis of lysis in phages does not provide the logic for the linear accumulation of phage progeny in the cell following eclipse, so that assumption is based on phenotypic observations from three unrelated phages (Hutchinson and Sinsheimer 1966; Josslin 1970; Wang 2006).
Although T7 is a well-studied phage, its mechanism of lysis is only partly known (Inouye et al. 1973; Heineman et al. 2005). T7 encodes a formal lysin (gp3.5, an amidase) and at least one holin, gp17.5 (Inouye et al. 1973; Young 1992; Vukov et al. 2000; Wang et al. 2000). Deletion of the lysin gene causes a profound delay in lysis, which can be recovered by mutations in the transglycosylase domain of the entry protein gp16 (Heineman et al. 2005). Even though gp17.5 has been shown to act as a holin in a λ system (Vukov et al. 2000), deletion of gene 17.5 has surprisingly little effect on lysis time (unpubl. data), suggesting that either the phage encodes another holin or the mechanism of lysis in T7 does not fit the general model. Our use of the optimality model in this experimental study of T7 was based on a detailed understanding of lysis mechanisms in other phages and the suggested similarity of T7 lysis to those systems. The level of informed generalization motivating this study exceeds that typically used for optimality modeling in other systems.
EXPECTATIONS
From the collective knowledge and work presented above, we expected that lysis time in T7 would be able to evolve rapidly and independently of other traits. Furthermore, from the perspective of our model, we expected that, once T7 was adapted to the passage conditions, changes in host density would select changes in only the correlated phenotypes of lysis time and burst size. At a sequence level we expected changes in lysis time to map to the holin gene, 17.5.
Methods
CELL AND PHAGE LINES
All nucleotide numbers presented are those of wild-type T7 (T7+, GenBank V01146, Dunn and Studier 1983). IJ1133 [E. coli K-12ΔlacX74 thiΔ(mcrC-mrr)102::Tn10], a strain lacking type I and other restriction loci, was used as the permissive host for all experimental evolutions and many other applications (Garcia and Molineux 1996). In the adaptation to mixed permissive and nonpermissive cells, the nonpermissive cells were the K-12 strain IJ1517 trxA::Kn. This latter strain served only as a sink for phage; all infections fail to release phage progeny due the absence of the essential DNA polymerase cofactor, thioredoxin (Chamberlin 1974). Even after adaptation, the phage did not form plaques when plated on cells lacking thioredoxin, so the host remained nonpermissive throughout (unpubl. data). IJ1126 [E. coli K-12, F−, recC22, sbcA5, endA, Gal−, thi, Su+Δ(mcrC-mrr)102:Tn10] (Yang and Richardson 1997) was used for transfections of T7 genomic DNA. The three phage lines evolved are designated T7Hi (adaptation to high density), T7Lo (formal low-density adaptation), and T7pLo (preliminary low-density adaptation) as explained below.
PASSAGES
Cells from recently thawed –80°C 20% glycerol LB stocks were added to a 125-mL flask containing 10 mL LB media (10-g NaCl, 10-g Bacto tryptone, and 5-gram Bacto yeast extract per liter) at 37°C in an orbital water bath (200 rpm) and allowed to grow for 1 h to a density of 1–2 × 10⁸ viable cells/mL before phage addition. Different cell concentrations and combinations were used for propagating phage in the three protocols applied here. In the high host density protocol, phages were added to undiluted cultures of IJ1133 grown under these conditions. In the preliminary low host density treatment, the 1-h IJ1133 cultures were diluted before phage addition, as described below. Finally, the formal low-density treatment used a mix of permissive cells (IJ1133) diluted to 1–2 × 10⁶/mL into nonpermissive IJ1517 at 1–2 × 10⁸/mL.
At this 1-h time point, 104–107 phages (almost always more than 105) were added to the flask. The culture was incubated for 20–60 min (usually 30), before an aliquot of the infected culture, including both 104–107 (again usually more than 105) free phage and infected cells, was transferred to the next flask in which cells were at the requisite density and had been incubated for 1 h. The cultures were sometimes allowed to lyse to permit recombination and speed adaptation, but most passaging occurred at a multiplicity of infection such that few cells were infected by more than one phage. A sample of the completed passage was treated with chloroform and stored, preserving free phage and releasing phage particles already formed within cells; aliquots transferred to new flasks were not subject to chloroform treatment except between days. Passages were typically carried for three or more hours continuously across multiple flasks before the process was halted for the day. At the beginning of each day's passages, the final stock from the previous passage provided the starting phage population for transfer.
The phage line adapted to high host density was passaged on cells at 108/mL for more than 35 h and is designated T7Hi. The formal low-density adaptation started with T7Hi and used mixed cells at a combined density of about 108/mL (permissive cells at 106) for 60 h; the end phage is designated T7Lo. The mutagen N-methyl-N′-nitro-N-nitrosoguanidine was added at a concentration of 0.5 μg/mL in passages at 0, 12.5, 24.33, and 47 h of this treatment to promote adaptation by increasing the mutation rate. The preliminary low-density adaptation was initiated with a phage intermediate between T7+ and T7Hi (an isolate from 1133E of Heineman et al. 2005) that was phenotypically indistinguishable from T7Hi. It was propagated through a progressive series of lower and lower cell densities without any apparent phenotypic adaptation (1–2 × 10⁷ cells/mL for 11 h, 2–4 × 10⁶ cells/mL for 15 h, 1–2 × 10⁶ cells/mL for 15 h, then 5–10 × 104 cells/mL for 33 h) to yield T7pLo.
FITNESS
Viral fitness was measured in a procedure similar to that used for passaging, relying on the fact that the phage population achieves a stable age-of-infection after a few phage generations. Thereafter, phage densities in the culture follow approximately exponential growth. Fitness was determined by passage at low phage/cell ratios (not exceeding 0.1 by the end of the transfer) across four to five consecutive transfers, using the rate of increase in phage titers measured from the end of the first or second passage to the end of the last passage. This estimate minimizes the effect of synchronous infection at the outset, which can otherwise yield misleading fitness measures. A fitness is given as doublings/hour, calculated as [log2(Nt/N0)]/t, where Nt is the number of phage in the flask at time t hours, corrected for dilutions over multiple transfers. For determining the optimality criterion, this number was transformed to a loge value (r), per minute.
ADSORPTION RATE
Adsorption assays involved adding 106 phages from a fresh phage lysate (no more than one day old) to cells suspended in LB in flasks as above (about 108 cells/mL), waiting for five minutes, and then spinning down a sample to pellet adsorbed phage. Unspun and spun suspensions at five minutes were then plated to obtain total phage and free phage densities (Ntotal, Nfree), respectively. Adsorption rate α was calculated from Nfree = Ntotal e−5α.
ECLIPSE TIME
Eclipse time assays involved adding 107 phage to cells grown 1 h to 108/mL; after 5.5 min, samples were taken over chloroform every 30 sec, until approximately 1.5 min before the average lysis time of the phage. Titers were taken of the treated samples, yielding a combined estimate of free phages and intracellular phages. Eclipse time was then estimated by fitting the data numerically to a simulation that modeled adsorption, eclipse, and a linear accumulation of phage after eclipse over time. Adsorption was modeled as the product of free phage density, free cell density, and the adsorption rate parameter; cell density was measured at the start of the assay and assumed constant over the course of the brief assay; coinfection was ignored because the phage density was much lower than cell density; adsorption rate was measured separately. Parameter values for phage density, eclipse, and the slope of linear phage increase were fit by empirical least squares in which the difference log(observed phage density) – log(model phage density) was normalized by log(observed phage density) to enforce equal weighting of the squared deviations at all time points; deviations at early time points could otherwise be dominated by deviations at later time points when phage densities had increased. T7+ eclipse time, for which precision was less important, was estimated as first increase of phage by more than 0.5 doublings from data gathered in a previous study (Heineman et al. 2005). That study infected cells at a multiplicity of five, and thus the data are not suited to the empirical least squares method.
LYSIS TIME
We used two different assays of lysis time. In the first, exponentially growing cells (as above) were infected with phage at an moi (multiplicity of infection) of about five to achieve rapid infection of cells. A Klett–Summerson photoelectric colorimeter (Klett) was used to measure culture turbidity at time points across the lysis window. To obtain an average lysis time, data were fit to a cumulative normal distribution using an empirical least squares procedure (Heineman et al. 2005). This method provided mean lysis time of infected cells for the culture. Each reported lysis value is the average of at least three independent cultures.
Although this method is convenient, there are two reasons that an additional method is required. First, the formula for optimal lysis time includes variance in lysis time, which cannot be accurately calculated in the presence of multiple infections or by this method. Second, multiple infections may speed lysis, due to increased expression of lysis proteins. Evidence consistent with this latter hypothesis was in fact observed when estimating the lysis time of T7Lo by different methods (Table 1).
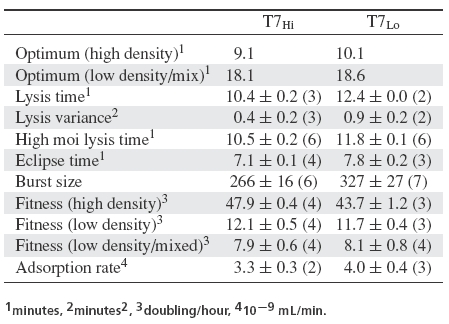
Table 1.
Phenotypic traits of T7 lines, with standard errors (computed from the observations) and number of assays. r = fitness × 0.011552. Optima estimated as  (Appendix 1).
The second method assayed lysis time in primarily singly infected cells. The 5 × 10⁷ phage were added to 10-mL of cells at 108/mL, grown for five minutes, and then diluted 105-fold and 103-fold in separate flasks to stop adsorption. Infective centers (a mix of untreated free phage plus infected cells) were plated at various time points to determine changes in titer. Assigning upper and lower bounds to the phage densities, the phage titers observed over time can be converted into proportions, treated as cumulative probabilities. In turn, the expected cumulative probabilities were generated from a model of the adsorption and lysis process and fit by empirical least squares against the observations. The model for distribution of lysis times is described in Appendix 2. All lysis times reported here used this protocol unless stated otherwise.
BURST SIZE
For burst size assays, 106 phages were added to suspensions of exponentially growing cells in flasks (108 cells/mL). The mix was diluted 1000-fold after 5 min to curtail further adsorption. At 5.5 and 6.5 min phages were titered both before and after treatment with chloroform. Treatment with chloroform kills cells, and because 6.5 min precedes the end of eclipse, all infections fail to leave progeny; the only plaques in the chloroform treatment are derived from free phage. The initial density of infected cells can be determined by comparison of these titers. At 15.5, 16.5, and 17.5 min, chloroform-treated samples were plated to estimate phage density. Burst sizes for each replicate were calculated as the titer of phage produced at late time points/the number of initially infected cells, calculated from initial time points.
SEQUENCING
Sequences were determined by dideoxy chain termination reactions from PCR products using ABI Big Dye Terminator mix (version 3.1) and an ABI3100. Sequence files were analyzed with DNA Star Lasergene Seqman II software (version 5.05). The entire genomes of T7pLo and T7Lo were sequenced, as were all sites of T7Hi at which its recent ancestor or descendent (T7Lo) had mutations. Primers and PCR conditions used are available upon request.
RECOMBINATION ASSAYS TO ASSESS COMPENSATORY CHANGES
To determine whether the mutations evolved at low density were specifically beneficial in the low-density conditions, the high host density adapted ancestor was cross-streaked with T7pLo or T7Lo to allow coinfection at the intersection. Coinfected T7 genomes recombine with high frequency. Phages from the region of intersection were resuspended and passaged briefly on IJ1133. Recombination between original and adapted lines creates a mixture of recombinant genotypes that contain different combinations of mutations; outgrowth allows those mutations that are advantageous in the conditions used to spread through the population (Rokyta et al. 2002). This method has been successfully used to separate mutations of positive and negative effect (Heineman et al. 2005). Pools of recombinant phages were passaged at high host density and at low host density (0.5–1 × 10⁵ cells without any nonpermissive hosts). For T7pLo, the recombinant was passaged for 15.5 h at high host density, and 10.6 h at low host density. For T7Lo, the recombinant was passaged for 16.25 h at high host density, and 18.33 h at low host density. T7Lo was also recombined with T7+ and adapted at low host density for 18 h. Regions that differed between the two recombined genomes were sequenced in the outgrowth populations. This sequencing was in all cases done from populations of the final lysate to detect polymorphism. The protocol used is demonstrated for the T7Lo adaptation in Figure 3.
Figure 3.

Summary of T7 adaptation and recombination. Wild-type T7 (T7+) was adapted to high host density to yield T7Hi. T7Hi was adapted to mixed permissive and nonpermissive cells, expected to select for slower lysis (yielding T7Lo, which was sequenced). A recombination assay was done between T7Hi and T7Lo. The recombinant population should contain many combinations of substitutions from each genome. The recombined pool adapted to high cell density was similar to T7Hi in both sequence and lysis time, indicating that the substitutions that occurred during T7Lo adaptation were only greatly advantageous under selection for slow lysis (four mutations were lost, three remained polymorphic but did not ascend to high levels). The recombinant line adapted to low cell density was indistinguishable from T7Lo in sequence and phenotype, suggesting that all of the mutations were highly advantageous at low host density. A recombination between T7Lo and T7+ adapted at low density also arrived at a sequence identical to T7Lo.
ENGINEERED RECOMBINATIONS
Genomic fragment exchanges between phages were used to associate lysis effects with particular mutations. DNA from T7Hi and T7Lo was digested with appropriate restriction enzymes, fragments were purified, complete sets of fragments were ligated, and reaction products were transfected into competent IJ1126 cells. Selected regions of phage isolates were then sequenced from PCR products to verify the recombinant status. This method was used to generate (1) T7Hi17.5, which was T7Hi plus the mutation 24 bp upstream of 17.5 from T7Lo, (2) T7Hi16, which was T7Hi carrying the two gene 16 mutations from T7Lo, and (3) T7Hi1, 1.2, 4.3, which contained all mutations in genes 1, 1.2, and 4.3 that occurred during adaptation to low host density.
PARAMETRIC TEST OF OPTIMALITY
The optimality criterion (2) can be written as 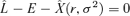 , where
  is from (3) or (4). When parameterized with empirical values, equality will generally not be met. To test whether the deviations are significant, we used a parametric bootstrap approach (as these equations do not obviously lend themselves to standard analysis of variance (ANOVA) approaches, at least because of unequal error variances). We assumed normal distributions for each of the phage traits, parameterized with the observed means and variances. The sampling procedure used to obtain the data was simulated from these distributions, drawing the same numbers of observations for each trait as in the data, calculating means, and assessing how often the simulated data deviated from the optimality criterion with the opposite sign as the observed deviation. (Negative values of σ2 were assigned a value of 0.)
Results
ADAPTATION TO HIGH HOST DENSITY
Wild-type T7 (T7+) had a lysis time (measured at high moi) of 13.3 min and an eclipse time of approximately 9 min in the environments used here. In our high host density passaging conditions of 108 cells/mL, wild-type fitness was 35.6 db/h (1/r = 2.4). The optimal lysis time of 11.4, calculated from eclipse time and fitness ignoring lysis time variance (9 + 2.4), does not match the observed lysis time of 13.3 min (Fig. 4A), but this discrepancy is not surprising as the phage was not adapted to these conditions. We can infer from the model that adaptation should select a shorter lysis time than 13.3 min. Furthermore, as noted above, the optimum after adaptation would be even shorter than 11.4 min because r would increase as lysis time evolved. As E is not necessarily optimized for these conditions, it may evolve as well.
Figure 4.
Adaptation of lysis times. Lysis time (L) can be broken down into eclipse time (E) plus posteclipse time (L – E). Optimal lysis time is predicted as approximately E + X, where X = 1/r plus a small correction for variance in lysis time from Appendix 1. For this reason, a line L = E provides a useful baseline for comparison of these values. In all cases, the putative optimum is based on current fitness (r) and eclipse time, hence it is subject to change as these traits adapt. (A) Not surprisingly, T7+ lysis was not optimal in high host density conditions, prior to its adaptation. (B) After adaptation to high host density, the lysis time approached the optimum; eclipse time also shortened. (C) After adaptation to low host density, evolved lysis time increased slightly but remained well short of the putative optimum. Surprisingly, eclipse time also increased in this selection. The optima in these figures are referred to as putative optima, because their values are based on the observed r rather than the r that would be achieved at the optimum  . The low-density conditions used in these adaptations used a mix of permissive and nonpermissive hosts (the formal low-density adaptation).
T7+ was adapted to high host density. The evolved phage, T7Hi, had a fitness, lysis time, lysis variance, and eclipse time of 47.9 db/h (1/r = 1.8), 10.4 min, 0.4 min2, and 7.1 min, respectively (Table 1). As expected, fitness had increased and lysis time decreased after adaptation. The eclipse time also shortened, which is likely a consequence of selection for short generation time. For example, a moderately large segment of the early region was deleted during this evolution (1479 bases, eliminating nonessential genes 0.4, 0.5, 0.6A, and 0.6B, as well as parts of 0.3 and 0.7), which might increase the rate at which the phage genome enters the cell, accelerating the entire life cycle. Fortunately, the optimum in our model includes separate terms for eclipse time (E) and growth rate (r), so the optimality criteria can be adjusted accordingly. At a lysis time of 10.4 min, T7Hi was close to its putative optimum of 9.1 min (Fig. 4B). This difference is small but (surprisingly) is statistically significant (P < 0.001). Given the layered model assumptions underlying these estimates and test, we are hesitant to attribute biological significance to this difference, but the test does indicate high significance to it.
ADAPTATION TO LOW HOST DENSITY
A preliminary selection at low host density started with a phage phenotypically indistinguishable from T7Hi, transferred through progressively lower cell densities, ultimately down to about 105 cells/mL for 33 h. The putative optimality criterion under the conditions was for a lysis time of 14.7 min, yet there was no detectable change in the final lysis time of the endpoint phage (T7pLo, data not shown). Five substitutions were found in this genome, although none proved (by a recombination test) to be specifically beneficial at low host density. Suspecting that the small population size impeded adaptation, we modified the design to create the formal low-density adaptation.
The formal low-density selection was initiated with T7Hi and used a mixed population of hosts. Approximately 99% of the hosts aborted the infection so that no progeny were released. The other 1% was permissive (density of about 106/mL). This design allowed us to, in essence, reduce burst size and thus reduce r for the population while maintaining an effective phage population size larger than in the preliminary selection (albeit smaller than in the adaptation to high host density). Using the eclipse time of 7.1 min, lysis time variance of 0.4 min2, and the fitness of 7.9 db/h (1/r = 11.0) under these conditions, optimal lysis time is putatively 18.1 min.
Evolution of lysis time and eclipse
After 60 h of adaptation, lysis time increased to 12.4 min, a modest and significant deviation from the 10.4 min in the initial T7Hi (P < 0.005 by one-tailed t-test, Fig. 4C). On the surface, this increase appears to be qualitatively consistent with the optimality model, although lysis was still six minutes too fast to satisfy the new phage's putative optimality criterion of 18.6 min. Also, about a third of this change was due to an increased eclipse time (from 7.1 to 7.8 min, P < 0.006 by two-tailed t-test), which is not predicted by the model. The posteclipse period was also significantly longer in T7Lo (3.3–4.6 min, P < 0.0001 by four-way one-tailed t-test, Bull et al. 2000), a result qualitatively consistent with the model.
Burst size increase
Burst size increased significantly during adaptation to low host density, from 266 to 327 phages released per infection (P < 0.04 by one-tailed t-test), an increase of 23%. The posteclipse time of T7Lo is 39% longer than that of T7Hi, as though the rate of phage accumulation is actually somewhat slower overall in T7Lo. The variances of these estimates are so high as to preclude any definitive conclusions, however.
Molecular evolution
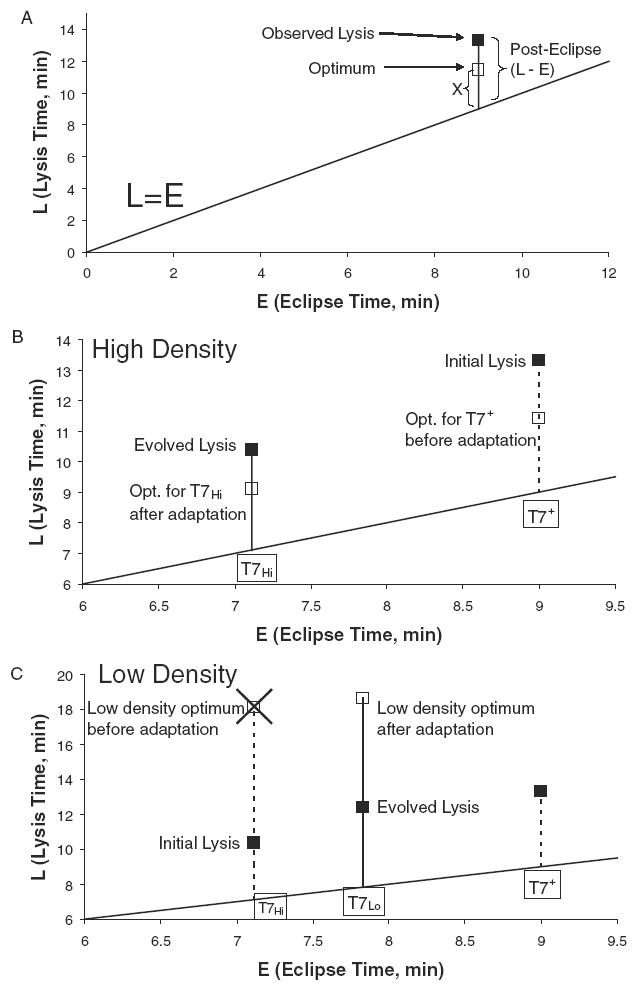
Seven new mutations were observed in the complete sequence of an isolate from T7Lo (Table 2). Four of these changes could not be rationalized for any effect on lysis, but two were in gene 16, which can affect lysis in some conditions, and one was 24 bp upstream of the start of 17.5, the holin gene.
Table 2.
Genetic evolution in T7Hi and T7Lo. Mutations below the horizontal line were new in T7Lo. Mutations above the line evolved from T7+ to T7Hi.
When these mutations were evaluated in subsets, two to three of them affected lysis time, as measured by high moi lysis assays. T7Hi17.5, which was T7Hi plus the mutation upstream of 17.5, lysed significantly more slowly than T7Hi (12.3 rather than 10.5 min, P < 0.04 by one-tailed t-test). Similarly, T7Hi16, which carried the two mutations from T7Lo gene 16 in a T7Hi background, lysed more slowly than T7Hi (12.4 min, P < 0.0002 by one-tailed t-test). On the other hand, T7Hi1, 1.2, 4.3, which carried the four most 5′ mutations in a T7Hi background, did not lyse more slowly than T7Hi (10.7 min, P < 0.14 by one-tailed t-test).
By our recombination test of compensatory evolution conducted in a low-density environment, all mutations that evolved in T7Lo were beneficial in a low-density environment. Although this result may seem redundant with the adaptation, an important distinction between the recombination assay environment and the adaptation environment is that the assay did not use nonpermissive hosts. This test thus confirms that selective pressures were similar between low host density per se and mixed host conditions, as predicted by the model, and that the lack of phenotypic evolution in the preliminary study was not due to a lack of selection.
For the recombination assay conducted at high density, the resulting phage's lysis time was indistinguishable from that of T7Hi, as expected (P < 0.84 by two-tailed t-test). Of the seven new mutations from T7Lo, none ascended to the levels seen in the low-density recombination assay: four were lost and three remained polymorphic at intermediate levels. Mutations should remain polymorphic if they are nearly neutral. Thus, no mutation evolved in the low-density selection appeared to be highly beneficial at high density, indicating that all were compensatory for low density. The changes in gene 16 and upstream of 17.5 that delayed lysis were among those lost at high density and thus specifically beneficial for low density.
Recall that T7Hi was the ancestor of the T7Lo adaptation and that T7Hi had acquired deletions of several early genes. A possible explanation for the limited adaptation at low density was thus that the deleted genes were necessary for evolving late lysis. This explanation was ruled out with a recombination between T7+ (carrying all the genes) and T7Lo. Adaptation of the recombinant pool at low density led to a genome the same as T7Lo, with the early genes deleted.
Discussion
Optimality models of evolution attempt to manage complexity by reducing the organism to simple trade-off functions and reducing evolution to a deterministic process of natural selection caused by few selective forces. There are obviously factors affecting evolution besides natural selection on simple trade-offs: alternative selective forces, mutation rate, population size, migration, generation time, evolutionary history, pleiotropy, and insurmountable limits to evolution. However, it may be possible to predict phenotypes accurately without taking many details into account. Our study specifically addresses this possibility using phage lysis time as a phenotype. Experimental adaptations of a phage failed to reach the expected optimum lysis time in two sets of conditions, high and low host density, although the discrepancy was large only in the latter. In all adaptations, the phage remained closer to the starting conditions than predicted. In general, three types of explanation can be proffered for this difference between prediction and outcome: (1) the basic premise of the model is correct but the optimum has been miscalculated (and the phage really did achieve optimality); (2) the experiment was too brief for the phage population to experience the appropriate mutations; (3) the phage genome does not obey the assumed trade-off. With respect to (1), we extended the model from its earlier version to incorporate environmental variance in lysis time, but that modification does not explain the difference; there is otherwise no basis for entertaining this possibility, but we cannot exclude it. The other explanations will be addressed below.
In the high host density adaptation, T7Hi evolved to lyse approximately a minute later than the predicted optimum at high host density (Fig. 4B). The difference was statistically significant, although the biological importance of the difference is questionable, as the suite of parameter estimation models might introduce a systematic bias. More importantly, lysis time remained several minutes faster than optimum in both low-density selections. In a preliminary selection, there was little phenotypic evolution despite five substitutions. In the main (formal) low-density adaptation, lysis time evolved but remained far from the putative optimum, and a trait outside the model, eclipse time, explained a third of the phenotypic change in lysis time (Fig. 4C).
Given the adaptation observed in the formal low-density treatment and that those mutations were also shown to be beneficial in the conditions of the preliminary low-density treatment, it seems likely the failure of phenotypic adaptation in the preliminary low-density experiment was due to a small effective population size limiting the input of mutations. The number of phages transferred was usually on the order of 105, which is itself low, but further reduced by the fact that 95% of phages transferred are predicted to remain unadsorbed in 30 min at this cell density. Thus, the actual population would not have allowed many mutations to arise, and most of those would not have been exposed to selection. The fact that the mutations from T7Lo (evolved in the mixed host environment) spread in the recombination assay done at low density strongly suggests that mutations were the limiting factor in the preliminary low-density experiment. Of course, this impediment to adaptation in our experiment may also sometimes apply in nature if phages experience a range of host densities. In ecological theory, populations with rich resources are often expected to be more important to adaptation than marginal populations (Kirkpatrick and Barton 1997).
FAILURE OF T7LO TO MATCH OPTIMALITY
Following the failure of the preliminary low-density selection to achieve phenotypic adaptation, the formal low-density selection used a design that consisted of a mix of permissive and nonpermissive hosts. The effect of nonpermissive hosts was merely to reduce phage population growth rate by increasing phage mortality rate, and although the specific nature of our design may be unrealistic, there are many reasons why similar causes of phage mortality could be important in natural settings (Chopin et al. 2005; De Paepe and Taddei 2006).
Significant phenotypic and genetic evolution was obtained in this low-density experiment (Fig. 4C). The evolved phage, T7Lo, lysed slower than its ancestor T7Hi, but its phenotype values did not satisfy the optimality criterion. This failure could be due to insufficient time, although other evidence (below) also suggests that the trade-off is violated. The fact that the experiment transcended 280 generations and fixed seven mutations suggests that there was ample opportunity for the evolution of lysis time if that phenotype could evolve large changes easily, as it does in other phages such as λ (Wang 2006). However, evaluation of equation (A4) reveals that selection for the optimum is relatively weak near the optimum, far more so at low host density than at high host density (Fig. 5), so insufficient time remains a possible partial cause of the failure. However, the observed discrepancy between evolved T7Lo and the putative optimum appears too great to be explained by this alone.
Figure 5.

Strength of selection for the optimum. Equation (A4) was used to plot fitness against average lysis time (posteclipse time) for parameters somewhat matching those of the high- and low-density adaptations. The optimum is at the peak, indicated by the filled circles. The vertical bars through the curves indicate a type of selective equivalence for 60 h of adaptation: if a homogenous population's initial lysis time was at the boundary of this interval, a mutant whose lysis time was exactly optimal would ascend from an initial frequency of 10−6 to 0.5 in 60 h. Populations whose starting genotypes were inside this interval thus may not be able to evolve the optimal lysis time (in 60 h of adaptation) even if the appropriate mutations arose. However, the strength of selection for the optimum is substantially greater at high host density than at low. Parameters were (R = 80, c = 0.4, E = 7.1, σ2 = 0.5 for high density; R = 70, c = 0.004, E = 7.8, σ2 = 0.9 for low density, with an additional term added to account for nonpermissive hosts from Bull 2006). No attempt was made to fit the observations quantitatively.
Given that we observed the evolution of seven mutations in the formal low density adaptation, the large discrepancy between predicted and observed lysis time is especially surprising from one perspective. It seems most plausible that the typical phage environment in the wild is low host density, if only because lytic phages quickly exploit their hosts and because few natural environments are thought to sustain high absolute densities of (non-stationary phase) single bacterial species. Deviation from optimality is most expected when organisms encounter novel conditions, not when they encounter common conditions (West et al. 2000). From this perspective, therefore, a phage should be predisposed to evolve a lysis time that is appropriate for low host density, which is not what we observed.
Our predictions about the genetic changes likely to be associated with adaptation to low host density were partially met. Unexpectedly, there was no change in the coding region of the holin gene 17.5, but the change upstream of it did delay lysis (Table 1). It may have some regulatory effect, although it is upstream of the ribosome-binding sequence, and there are no T7 promoters in this region. Changes in gene 16 also delayed lysis but were not necessarily expected, as the lysin activity of gene 16 has no detectable effect on lysis in T7+ (Moak and Molineux 2000). However, gene 16 has affected the recovery of lysis after abolition of phage lytic activity in gene 3.5 (Heineman et al. 2005), so its contribution here is plausible.
POSSIBILITY OF NONLINEAR PHAGE ACCUMULATION FUNCTION
There was a pronounced failure to evolve late lysis in T7Lo, as judged by the optimality criteria: the predicted posteclipse period was nearly 11 min, whereas the observed posteclipse period was close to 4.6 min. Does this mean that T7 cannot evolve later lysis? Paradoxically, late lysis per se is never favored directly in the optimality model. Instead, selection favors an increase in burst size, and a delay in lysis is an unavoidable downside of the increased burst size. The evolution of late lysis per se is in fact trivial for T7—any change that delays the life cycle will delay lysis, for example—but there is no possible benefit unless burst size improves. The failure, therefore, must lie in the ability to increase burst size. In terms of the model, this failure would mean that progeny phage do not continue to accumulate (linearly) when T7 lysis is delayed beyond the normal time, in contrast to the evidence in three other unrelated phages.
Our genetic work with T7 may shed light on this enigma. Loss of lysin activity of the lysozyme gene (3.5) in T7 results in a profound delay in lysis and phage release, but no increase in burst size even when cells are artificially lysed. The simple explanation is that, with an active holin (time-keeper), cell death occurs at the usual lysis time because the holin is causing the cell to “bleed” by permeabilizing the inner membrane, but the dead cell remains intact without the lysozyme to disrupt the cell wall and lyse it. Thus, the cell ceases phage production but the phages do not escape. Loss of lysozyme activity therefore delays lysis without increasing burst size. Adaptation of this lysis-defective phage might be expected to select a delay in holin timing as one avenue to increase fitness (resulting in a larger burst), but the only evolutionary outcome observed was re-evolution of lysis at the normal time (Heineman et al. 2005). We thus lack evidence that T7 progeny accumulation inside the cell is linear with time, even though a diverse set of other phages does exhibit linear accumulation. Although we might have anticipated the lack of linear accumulation in T7 from our previous work, that work used T7 phages that were profoundly and artificially debilitated and did not immediately indicate a meaningful constraint on natural evolution.
ADAPTATION OF T7LO ECLIPSE
Optimality models are commonly tested by comparing organisms evolved in their natural environments. Although this approach has many advantages, it is also subject to complications such as selection from confounding variables, nonindependence between groups, and even the neglect of taxa that evolved outside the parameter bounds of the study. An advantage of our experimental test over observational studies is that it was possible to observe evolution of multiple phenotypes in an environment designed to select just changes in lysis time and burst size. This broader perspective provides insight to the model that would otherwise be difficult to obtain.
A puzzle revealed in this fashion was the evolution of a longer eclipse time in the low-density adaptation, contributing a third as much to delayed lysis as the increase in the posteclipse time. Evolution of a shorter eclipse during adaptation of T7+ to high density was not surprising in view of the presumed novelty of these environments to T7+. The evolution of a longer eclipse at low density after T7Hi was already adapted to the cells was surprising, because the cell physiology was presumably the same in the low-density as in high-density environments. Evolution represents a failure of our optimality model to capture phenotype evolution, although in this case, the optimum is easily recalculated for any eclipse time. The evolution of eclipse time might be incorporated into a more complicated model of lysis, although such a model requires understanding the impact of different eclipse times on the (linear) phage accumulation function (Bull 2006).
Our results somewhat fly in the face of important precedents for the study of lysis time in phages (Abedon et al. 2003; Wang 2006). Those studies competed phages with different holin mutations and observed evolution of rapid lysis under expected conditions. One difference is that our study used T7, whereas those studies used T4 and λ. Both of those phages have been shown to exhibit a linear accumulation of progeny inside the cell. A second difference is that both those studies started with known holin variation, ours waited for variation to arise and ascend. Third, our study tested quantitative predictions; our results were in fact in qualitative agreement with the model. A more useful comparison to those precedents would thus be a long-term study such as ours, but using phage λ or T4 instead of T7.
Experimental adaptations have addressed the evolution of life-history traits in cellular life as well (van Kleunen et al. 2002; Prasad and Joshi 2003; MacLean et al. 2004; Pijpe et al. 2006; Reznick et al. 2006). The models tested have rarely been both a priori and quantitative, although there appears to be a trend in this direction (Carvalho et al. 1998). Protein expression levels in the bacterium E. Coli have been experimentally shown to evolve to a quantitative optimum (Dekel and Alon 2005).
IMPLICATIONS FOR OPTIMAL VIRULENCE
Optimal virulence models maximize parasite fitness along a trade-off between parasite and host mortality. A typical prediction is that pathogens evolve to kill faster when there are many hosts available and transmission is high (Jensen et al. 2006), and this framework has been used to inform research into the evolution of human diseases (Ewald 1996). Our lysis time model is probably the simplest quantitative one available for the evolution of virulence, if one considers rapid lysis as more virulent than slow lysis (Abedon et al. 2003). The failure of T7 to match the predictions of an optimal virulence model raises questions about the likelihood of success of generalized virulence models in other systems, especially when considering that virulence of a human pathogen is far more complicated than is lysis time of a phage. Thus, harming the host often may frequently be a side effect of pathogen reproduction, not necessarily involved in a direct trade-off with increased transmission (Sokurenko et al. 2006).
The use of vaccines that prevent infection has been suggested to favor the evolution of lower virulence to unvaccinated hosts (Gandon et al. 2003). Our formal low-density treatment used what is analogous to a perfect vaccine, from which no infecting virus escapes, and its effect was to select longer lysis time, tantamount to lower virulence.
Acknowledgments
We thank I. J. Molineux, I. Wang, S. Abedon, S. Brown, R. Springman, W. Harcombe, and T. Keller for helpful suggestions. A. Ellington suggested the experiment to test whether genes missing in T7Hi were important in adaptation to low density. T. Hansen suggested ways to obtain exact solutions for the effect of lysis time variation on the optimum. This study was funded by NIH GM 57756 to JJB. JJB also receives support from the Miescher Regents Professorship at the University of Texas.
APPENDIX 1: ENVIRONMENTAL VARIATION IN LYSIS TIME
The optimality model developed in Bull (2006) assumed that the lysis time (L) of a genotype is constant across hosts. Measurements of lysis time from phages indicate that lysis is not synchronous and thus L is not necessarily constant (variation in lysis time could, in principle, stem from variation in time to adsorption). The optimality model was therefore modified to consider environmental variation in L. The model adopted here assumed that (1) lysis time, L, = E # x, where x is the posteclipse time, distributed with mean μ and variance σ2. Burst size (b) follows the linear model b = Rx, with R being the constant rate of intracellular phage accumulation. From Bull (2006), the intrinsic growth rate (r) of the phage population satisfies
| (A1) |
if L and b are invariant (c is the product of cell density times adsorption rate; for our experimental conditions, we neglect the phage death rate and washout terms in Bull 2006). When x varies among infections within a culture, the relevant equation is
| (A2) |
where Ex is the expectation taken over x. When x follows a normal distribution with mean μ and variance σ2, (A2) becomes
| (A3) |
assuming normality has the advantage of allowing an exact analytic solution for the optimum (below). However, normality of x allows negative values, which are biologically disallowed. Thus, it is also useful to consider a distribution confined to x > 0, such as a gamma. When x follows a gamma distribution, (A2) becomes
 |
(A4) |
For each model, the optimum lysis time is found by differentiating the respective equation (A3 or A4) with respect to x and setting  . Differentiating (A3) leads to text equation (2) as an exact solution. Differentiating (A4) leads to
| (A5) |
Approximations: A normal distribution allows x to take on negative values, and the model, in turn, assigns negative fecundity. Consequently, text equation (2) may not be accurate for large variances. To establish bounds on σ2 that will avoid negative values, note that if μ = 2σ2 for a normal distribution, then less than 1% of values are negative (if μ = σ2 then 16% are negative). Furthermore, the optimum approximately satisfies  , so
, so  should conservatively ensure that (2) is accurate, and rσ2 < 1 may be adequate. However, this correction amounts to at most a minute increase in the optimum, and a minute may be well within the bounds of measurement error for the other terms in the optimum. The gamma distribution does not pose the problem of negative values, but an analytic solution of (A5) is not attainable. An approximate solution is
| (A6) |
but this approximation is useful only if rσ2 < 1 and r2 σ2 < 0.16. However, (A5) can be solved numerically for arbitrary r and σ2.
APPENDIX 2: DISTRIBUTION OF LYSIS TIMES
The model of infection times is as follows. In a culture of cells to which phage has been added at time 0, the time to lysis since phage addition is T = X # Y, where X is the time to adsorption and Y is the time to lysis following adsorption. The variable X is known to follow an exponential distribution with parameter A, the product of cell density, and adsorption rate (Adams 1959). Let the distribution of Y be f(y), with y being strictly positive.
To obtain the cumulative probability of lysis to time t, P(t), we want  . From this and the assumption that adsorption follows an exponential distribution with parameter A, it follows that
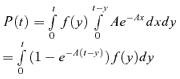 |
(A7) |
For appropriate choice of f(y), it may be possible to solve (A7). However, (A7) lends itself to numerical integration, which is the approach adopted here. For this study, we used a gamma pdf for f(y).
Assays of lysis time are usually conducted by diluting the culture after a moderate interval of adsorption but before any observable lysis (thus preventing secondary infections). Assuming that further adsorption is stopped at time t = τ, equation (A7) is easily modified to
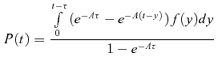 |
(A8) |
Finally, if our model is L = E + t, where E is fixed, the distribution of posteclipse times (y) is obtained by translating total lysis time by E and fitting data to the variable t = L – E.
LITERATURE CITED
- Abedon S T. Lysis of lysis-inhibited bacteriophage T4-infected cells. J. Bacteriol. 1992;174:8073–8080. doi: 10.1128/jb.174.24.8073-8080.1992. [DOI] [PMC free article] [PubMed] [Google Scholar]
- Abedon S T. Bacteriophage latent-period evolution as a response to resource availability. Appl. Environ. Microbiol. 2001;67:4233–4241. doi: 10.1128/AEM.67.9.4233-4241.2001. [DOI] [PMC free article] [PubMed] [Google Scholar]
- Abedon S T. Experimental examination of bacteriophage latent-period evolution as a response to bacterial availability. Appl. Environ. Microbiol. 2003;69:7499–7506. doi: 10.1128/AEM.69.12.7499-7506.2003. [DOI] [PMC free article] [PubMed] [Google Scholar]
- Adams M H. Bacteriophages. New York: Interscience Publishers, Inc.; 1959. [Google Scholar]
- Axelrod R. The evolution of cooperation. Science. 1981;211:1390–1396. doi: 10.1126/science.7466396. [DOI] [PubMed] [Google Scholar]
- Bull J J. Optimality models of phage life history and parallels in disease evolution. J. Theor. Biol. 2006;241:928–938. doi: 10.1016/j.jtbi.2006.01.027. [DOI] [PubMed] [Google Scholar]
- Bull J J. Big-benefit mutations in a bacteriophage inhibited with heat. Mol. Biol. Evol. 2000;17:942–950. doi: 10.1093/oxfordjournals.molbev.a026375. [DOI] [PubMed] [Google Scholar]
- Carvalho A B. An experimental demonstration of Fisher's principle: evolution of sexual proportion by natural selection. Genetics. 1998;148:719–731. doi: 10.1093/genetics/148.2.719. [DOI] [PMC free article] [PubMed] [Google Scholar]
- Chamberlin M. Isolation and characterization of prototrophic mutants of Escherichia coli unable to support the intracellular growth of T7. J. Virol. 1974;14:509–516. doi: 10.1128/jvi.14.3.509-516.1974. [DOI] [PMC free article] [PubMed] [Google Scholar]
- Charnov E L. Optimal foraging, the marginal value theorem. Theor. Popul. Biol. 1976;9:129–136. doi: 10.1016/0040-5809(76)90040-x. [DOI] [PubMed] [Google Scholar]
- Charnov E L. The theory of sex allocation. In: Ray R M, editor. Monogr. Popul. Biol. Princeton, NJ: Princeton Univ. Press; 1982. pp. 1–355. Pp. in. [PubMed] [Google Scholar]
- Chopin M C. Phage abortive infection in lactococci: variations on a theme. Curr. Opin. Microbiol. 2005;8:473–479. doi: 10.1016/j.mib.2005.06.006. [DOI] [PubMed] [Google Scholar]
- De Paepe M. Viruses' life history: towards a mechanistic basis of a trade-off between survival and reproduction among phages. PLoS Biol. 2006;4:e193. doi: 10.1371/journal.pbio.0040193. [DOI] [PMC free article] [PubMed] [Google Scholar]
- Dekel E. Optimality and evolutionary tuning of the expression level of a protein. Nature. 2005;436:588–592. doi: 10.1038/nature03842. [DOI] [PubMed] [Google Scholar]
- Dunn J J. Complete nucleotide sequence of bacteriophage T7 DNA and the locations of T7 genetic elements. J. Mol. Biol. 1983;166:477–535. doi: 10.1016/s0022-2836(83)80282-4. [DOI] [PubMed] [Google Scholar]
- Endy D. Computation, prediction, and experimental tests of fitness for bacteriophage T7 mutants with permuted genomes. Proc. Natl. Acad. Sci. USA. 2000;97:5375–5380. doi: 10.1073/pnas.090101397. [DOI] [PMC free article] [PubMed] [Google Scholar]
- Ewald P W. Evolution of infectious disease. Oxford, U.K.: Oxford Univ. Press; 1996. [Google Scholar]
- Gandon S. Imperfect vaccination: some epidemiological and evolutionary consequences. Proc. Biol. Sci. 2003;270:1129–36. doi: 10.1098/rspb.2003.2370. [DOI] [PMC free article] [PubMed] [Google Scholar]
- Garcia L R. Transcription-independent DNA translocation of bacteriophage T7 DNA into Escherichia coli. J. Bacteriol. 1996;178:6921–6929. doi: 10.1128/jb.178.23.6921-6929.1996. [DOI] [PMC free article] [PubMed] [Google Scholar]
- Gould S J. The spandrels of San Marco and the Panglossian paradigm: a critique of the adaptationist programme. Proc. R. Soc. Lond. B Biol. Sci. 1979;205:581–598. doi: 10.1098/rspb.1979.0086. [DOI] [PubMed] [Google Scholar]
- Grundling A. Holins kill without warning. Proc. Natl. Acad. Sci. USA. 2001;98:9348–9352. doi: 10.1073/pnas.151247598. [DOI] [PMC free article] [PubMed] [Google Scholar]
- Hambly E. The viriosphere, diversity, and genetic exchange within phage communities. Curr. Opin. Microbiol. 2005;8:444–450. doi: 10.1016/j.mib.2005.06.005. [DOI] [PubMed] [Google Scholar]
- Heineman R H. Evolutionary robustness of an optimal phenotype: re-evolution of lysis in a bacteriophage deleted for Its lysin gene. J. Mol. Evol. 2005;61:181–191. doi: 10.1007/s00239-004-0304-4. [DOI] [PubMed] [Google Scholar]
- Hutchinson C A. The process of infection with bacteriophage phiX174. J. Mol. Biol. 1966;18:429–447. doi: 10.1016/s0022-2836(66)80035-9. [DOI] [PubMed] [Google Scholar]
- Inouye M. Bacteriophage T7 lysozyme is an N-acetylmuramyl-L-alanine amidase. J. Biol. Chem. 1973;248:7247–7252. [PubMed] [Google Scholar]
- Jensen K H. Empirical support for optimal virulence in a castrating parasite. PLoS Biol. 2006;4:e197. doi: 10.1371/journal.pbio.0040197. [DOI] [PMC free article] [PubMed] [Google Scholar]
- Josslin R. The lysis mechanism of phage T4: mutants affecting lysis. Virology. 1970;40:719–726. doi: 10.1016/0042-6822(70)90216-3. [DOI] [PubMed] [Google Scholar]
- Kirkpatrick M. Evolution of a species' range. Am. Nat. 1997;150:1–23. doi: 10.1086/286054. [DOI] [PubMed] [Google Scholar]
- Krebs J R. An introduction to behavioral ecology. 3. Oxford, U.K.: Blackwell Scientific Publications; 1993. [Google Scholar]
- Krebs J R. An introduction to behavioral ecology. 4. Cambridge: Blackwell Science; 1997. [Google Scholar]
- MacLean R C. The evolution of a pleiotropic fitness tradeoff in Pseudomonas fluorescens. Proc. Natl. Acad. Sci. USA. 2004;101:8072–8077. doi: 10.1073/pnas.0307195101. [DOI] [PMC free article] [PubMed] [Google Scholar]
- Moak M. Role of the Gp16 lytic transglycosylase motif in bacteriophage T7 virions at the initiation of infection. Mol. Microbiol. 2000;37:345–355. doi: 10.1046/j.1365-2958.2000.01995.x. [DOI] [PubMed] [Google Scholar]
- Molineux I J. T7 bacteriophages. In: Creighton T E, editor. Encyclopedia of molecular biology. New York: Wiley; 1999. pp. 2495–2507. Pp. in. [Google Scholar]
- Nelson D. PlyC: a multimeric bacteriophage lysin. Proc. Natl. Acad. Sci. USA. 2006;103:10765–10770. doi: 10.1073/pnas.0604521103. [DOI] [PMC free article] [PubMed] [Google Scholar]
- Novoseltsev V N. Evolutionary optimality applied to Drosophila experiments: hypothesis of constrained reproductive efficiency. Evol. Int. J. Org. Evolution. 2002;56:1136–1149. doi: 10.1111/j.0014-3820.2002.tb01427.x. [DOI] [PubMed] [Google Scholar]
- Orzack S H. Optimality models and the test of adaptationism. Am. Nat. 1994;143:361–380. [Google Scholar]
- Pierce G J. Eight reasons why optimal foraging theory in a complete waste of time. Oikos. 1987;49:111–118. [Google Scholar]
- Pijpe J. Consequences of artificial selection on pre-adult development for adult lifespan under benign conditions in the butterfly Bicyclus anynana. Mech. Ageing Dev. 2006;127:802–807. doi: 10.1016/j.mad.2006.07.006. [DOI] [PubMed] [Google Scholar]
- Prasad N G. What have two decades of laboratory life-history evolution studies on Drosophila melanogaster taught us? J. Genet. 2003;82:45–76. doi: 10.1007/BF02715881. [DOI] [PubMed] [Google Scholar]
- Ramanculov E. Genetic analysis of the T4 holin: timing and topology. Gene. 2001;265:25–36. doi: 10.1016/s0378-1119(01)00365-1. [DOI] [PubMed] [Google Scholar]
- Reader R W. Lysis defective mutants of bacteriophage lambda: genetics and physiology of S cistron mutants. Virology. 1971;43:607–622. doi: 10.1016/0042-6822(71)90286-8. [DOI] [PubMed] [Google Scholar]
- Reznick D. The evolution of senescence and post-reproductive lifespan in guppies (Poecilia reticulata) PLoS Biol. 2006;4:e7. doi: 10.1371/journal.pbio.0040007. [DOI] [PMC free article] [PubMed] [Google Scholar]
- Rokyta D. Experimental genomic evolution: extensive compensation for loss of DNA ligase activity in a virus. Mol. Biol. Evol. 2002;19:230–238. doi: 10.1093/oxfordjournals.molbev.a004076. [DOI] [PubMed] [Google Scholar]
- Sokurenko E V. Source-sink dynamics of virulence evolution. Nat. Rev. Microbiol. 2006;4:548–555. doi: 10.1038/nrmicro1446. [DOI] [PubMed] [Google Scholar]
- Stearns S C. Quantitative predictions of delayed maturity. Evolution. 1981;35:455–463. doi: 10.1111/j.1558-5646.1981.tb04906.x. [DOI] [PubMed] [Google Scholar]
- Studier F W. Genetic analysis of non-essential bacteriophage T7 genes. J. Mol. Biol. 1973;79:227–36. doi: 10.1016/0022-2836(73)90002-8. [DOI] [PubMed] [Google Scholar]
- Suttle C A. Viruses in the sea. Nature. 2005;437:356–361. doi: 10.1038/nature04160. [DOI] [PubMed] [Google Scholar]
- Trivers R L. Parental investment and sexual selection. In: Campbell B, editor. Sexual selection and the descent of man 1871–1971. Chicago, IL: Aldine; 1972. pp. 136–179. Pp. in. [Google Scholar]
- van Kleunen M. Experimental life-history evolution: selection on the allocation to sexual reproduction and its plasticity in a clonal plant. Evol. Int. J. Org. Evolution. 2002;56:2168–2177. [PubMed] [Google Scholar]
- Vukov N. Functional analysis of heterologous holin proteins in a lambdaDeltaS genetic background. FEMS Microbiol. Lett. 2000;184:179–186. doi: 10.1111/j.1574-6968.2000.tb09011.x. [DOI] [PubMed] [Google Scholar]
- Walters C J. Fisheries ecology and management. Princeton, NJ: Princeton Univ. Press; 2004. [Google Scholar]
- Wang I N. Lysis timing and bacteriophage fitness. Genetics. 2006;172:17–26. doi: 10.1534/genetics.105.045922. [DOI] [PMC free article] [PubMed] [Google Scholar]
- Wang I N. The evolution of phage lysis timing. Evol. Ecol. 1996;10:545–558. [Google Scholar]
- Wang I N. Holins: the protein clocks of bacteriophage infections. Annu. Rev. Microbiol. 2000;54:799–825. doi: 10.1146/annurev.micro.54.1.799. [DOI] [PubMed] [Google Scholar]
- West S A. Evolution: The benefits of allocating sex. Science. 2000;290:288–290. doi: 10.1126/science.290.5490.288. [DOI] [PubMed] [Google Scholar]
- Xu M. A signal-arrest-release sequence mediates export and control of the phage P1 endolysin. Proc. Natl. Acad. Sci. USA. 2004;101:6415–6420. doi: 10.1073/pnas.0400957101. [DOI] [PMC free article] [PubMed] [Google Scholar]
- Yang X M. Amino acid changes in a unique sequence of bacteriophage T7 DNA polymerase alter the processivity of nucleotide polymerization. J. Biol. Chem. 1997;272:6599–6606. doi: 10.1074/jbc.272.10.6599. [DOI] [PubMed] [Google Scholar]
- Young R. Bacteriophage lysis: mechanism and regulation. Microbiol. Rev. 1992;56:430–481. doi: 10.1128/mr.56.3.430-481.1992. [DOI] [PMC free article] [PubMed] [Google Scholar]