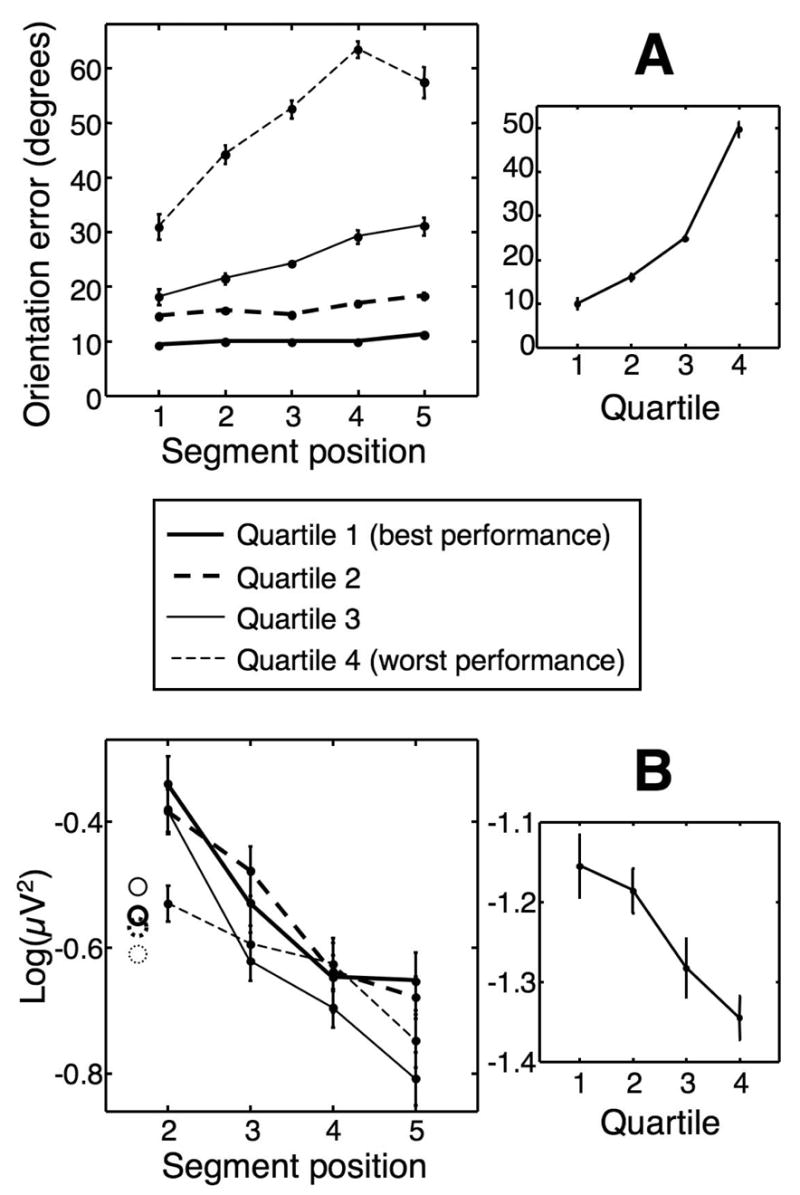
Figure 4.

Correlation between ERP amplitude and behavioral performance. A: Imitation accuracy. Left panel shows orientation error as a function of segment serial position for each quarter of the trials in the memory condition. Right panel shows mean error across all five segments plotted against quartile. B: Mean ERP energy across all electrode locations. Left panel shows the energy of the ERPs time-locked to the onset of segments 2 to 5 in each group. Circles denote energy in segment 1. Right panel shows the energy of the averaged ERPs of all five segments as a function of imitation accuracy. Note that the energy values in the right panel are smaller, since the averaging of all segments reduces noise levels. All error bars are within-subjects SEM for each curve independently.
