

Abstract
We tested whether NHE3 and NHE2 Na+/H+ exchanger isoforms were recruited to the plasma membrane (PM) in response to changes in ion homeostasis. NHE2-CFP or NHE3-CFP fusion proteins were functional Na+/H+ exchangers when transiently expressed in NHE-deficient PS120 fibroblasts. Confocal morphometry of cells whose PM was labeled with FM4-64 measured the fractional amount of fusion protein at the cell surface. In resting cells, 10–20% of CFP fluorescence was at PM and stable over time. A protocol commonly used to activate the Na+/H+ exchange function (NH4-prepulse acid load sustained in Na+-free medium), increased PM percentages of PM NHE3-CFP and NHE2-CFP. Separation of cellular acidification from Na+ removal revealed that only NHE3-CFP translocated when medium Na+ was removed, and only NHE2-CFP translocated when the cell was acidified. NHE2/NHE3 chimeric proteins demonstrate that the Na+-removal response element resides predominantly in the NHE3 cytoplasmic tail and is distinct from the acidification response sequence of NHE2.
Keywords: cell membrane, hydrogen-ion concentration, sodium, exocytosis, endocytosis
1. Introduction
The NHE family of Na+/H+ exchangers currently includes at least 9 identified human isoforms that originate from distinct genes with different tissue and subcellular distributions [1]. NHE proteins contribute to cellular pH and volume homeostasis [2], and may be linked to hypertension and organ ischemia [1]. The intestinal and renal epithelia are responsible for the vectorial transport of sodium, utilizing in large part an electroneutral sodium absorption mechanism whose first step, sodium uptake across the apical membrane, is mediated by members of the NHE family of Na+/H+ exchanger proteins. Interest has focused on the apical Na+/H+ exchange step as the key regulatory site controlling this electroneutral Na+ absorption.
Two apical Na+/H+ exchanger isoforms, NHE2 and NHE3, are present in the colon of rabbits [3,4], mice[5], rats [6], and humans [1,3,8,9]. In mice, a series of knockout studies [10–13] initially suggested that NHE3 is critical for protection from diarrheal disease, while NHE2 was thought to be of minor importance. This view may soon be revised since recently published studies demonstrate that NHE2 knockout mice express nearly twice as much NHE3 as do their normal littermates, as well as expressing an increase in another EIPA-sensitive Na-dependent acid extruder that is not NHE3 [14,15]. In rat colon, conflicting studies identified NHE2 [16] or NHE3[17] as the NHE isoform responsible for the major fraction of Na+ uptake, and evidence suggests that bicarbonate and short-chain fatty acids may differentially activate the two isoforms [18]. In rabbit colon, NHE2 and NHE3 are reported to make roughly equal contributions to Na+ uptake [4]. In summary, it remains uncertain why two isoforms with similar membrane transport function are expressed.
In addition to their presence in the apical plasma membrane (PM) of mammalian colonic epithelia, NHE2 and NHE3 share other similarities. The isoforms have highly conserved (50–60% identical) N-terminal domains that encode for 10–12 transmembrane domains and less tightly conserved (20–30% identity) cytoplasmic COOH domains [19] that encode regulatory domains[20]. In response to regulatory agonists, both isoforms change the maximal velocity of transport (Vmax) [21].
In transfected fibroblasts, the majority of expressed NHE3 protein is not localized at the PM but is found instead in internal storage compartments[22, 23]. Based upon colocalization with transferrin receptors and cellubrevin, the internal storage compartments have been identified as recycling endosomes[24]. Increasing evidence suggests that the down-regulation of NHE3 activity involves retrieval of the protein from the PM in both fibroblasts and native colonic tissue [24–28]. Likewise, evidence suggests that up-regulation of NHE3 activity can be mediated by rapid insertion of NHE3 into the plasma membrane from internal stores [24,26].
Less information is available about NHE2 trafficking. However, considering that there are internal stores of NHE2 protein [22, 23]and that NHE2 is also regulated by changes in Vmax [21], it seems plausible that NHE2 activity might also be controlled by regulated insertion of NHE2 protein into the PM. This has been suggested previously [19].
We made NHE2 or NHE3 fusion proteins with CFP attached to their C-termini and used a modified version of the confocal morphometric method of Janecki et al. [27] to make dynamic measurements of cellular NHE distribution in transfected cells. Results suggest that changes in cellular ion composition stimulate net translocation of both NHE2 and NHE3 to the plasma membrane, but with an isoform-specific dependence on different ions. To the best of our knowledge, this study is the first to report direct evidence for regulation of NHE2 by translocation from internal stores to the plasma membrane.
2. Materials and Methods
2.1 Cell culture and transient transfection
NHE-deficient Chinese hamster lung fibroblasts (PS120 cells; a gift from J. Pouyssegur) were cultured in DMEM supplemented with 10% FBS, penicillin (50 IU/ml), streptomycin (50μg/ml), 1 mM glutamine, and 10 mM HEPES in a chamber with 5% CO2 at 37C. PS120 lack endogenous Na+/H+ exchangers [29]. NHE2-CFP was constructed as follows. Full length (813aa) rat NHE2 cDNA (NHE cDNAs a gift from J. Orlowski; described in [30]) was modified by using GeneEditor in vitro site-directed mutagenesis system (Promega) to convert its stop codon into an AgeI restriction site. NHE2 DNA was digested with KpnI and AgeI enzymes (GibcoBRL) and inserted into the pECFP-N1 vector (Clontech) linearized with the same enzymes. Three amino acids were used as a linker between the AgeI site and the start codon of the CFP protein. NHE3-CFP was constructed as follows. Full-length rat NHE3 DNA (831aa) was digested with HindIII and ApaI enzymes (GibcoBRL), truncating the sequence encoding the C-terminal 76 amino acids of the protein, and inserted into pECFP-N1 vector linearized with the same enzymes. Seven amino acids served as the linker between the end of the truncated NHE3 and the start codon of CFP. PS120 cells were grown on coverslips as described above and were then transiently transfected using Genejuice (Novagen) according to the manufacturer's instructions. Subsequent experiments were carried out between 36 and 48 hours post-transfection. During experiments, cells were selected for the presence of fluorescence and the retention of normal morphological features such as size and shape compared with neighboring wild-type cells. On this basis, cells with relatively low to moderate CFP fluorescence intensity were analyzed, while the subset of cells with the brightest CFP fluorescence were generally excluded from analysis because they were either larger and/or rounder than their untransfected neighbors.
2.2 Hybrid fusion proteins and stable transfectants
Site-directed mutagenesis was performed (GeneEditor, Promega) on full-length rat NHE3 DNA (831aa) to convert its stop codon into an AgeI restriction site. Full-length NHE3 DNA was digested with HindIII and AgeI enzymes (GibcoBRL) and inserted into the pECFP-N1 vector (Clontech) linearized with the same enzymes to create full-length NHE3-CFP (p3FL). This sequence contains a native XhoI site at L-535. The modified full-length (813 aa) rat NHE2-CFP fusion used for transient transfections and described in the previous section was modified further to introduce an XhoI site that converts S551R and I552V (pNHE2XhoI). Truncated (aa 1–551) NHE2-CFP (pM2) was created by digesting NHE2XhoI with XhoI and inserting the M2 fragment into pECFP-N1 vector also linearized with XhoI. Truncated (aa 1–535) NHE3-CFP (pM3) was created by digesting p3FL with XhoI and inserting the M3 fragment into pECFP-N1 vector linearized with XhoI. Hybrid pM2C3 (NHE2 aa 1–551 / NHE3 aa 536–831) was created by cutting pNHE2XhoI with XhoI and inserting the M2 fragment into p3FL that had been linearized with the same enzyme. Hybrid pM3C2 (NHE3 aa 1–535 / NHE2 aa 552–813) was created by cutting 3FL with XhoI and inserting the M3 fragment into pNHE2XhoI that had been linearized with the same enzyme. All modified plasmid sequences were confirmed by direct sequencing. Stable transfection into PS120 cells was performed using Genejuice according to manufacturer's instructions. Selection was carried out by growing cells 2–3 weeks in PS120 medium to which 600 μg/ml G418 had been added. Mixed transfectants were used for experiments.
2.3 Perfusion solutions
Cells were initially perfused in Na+ medium [in mM: 130 NaCl, 5 KCl, 2 CaCl2, 1 MgSO4, 20 HEPES, 25 mannose, 1 probenecid, titrated to pH 7.4 with NaOH]. To monitor pHi, cells were placed in Na+ medium with 1μM SNARF-4F (5-(and-6)-carboxy SNARF-4F, acetoxymethyl ester, acetate; Molecular Probes). After 10–15 min, cells were washed in Na+ solution for 5 min before the start of an experiment. Composition of other perfusate solutions was based on the Na+ medium above. In Na+-free solutions, TMA chloride replaced NaCl mol:mol, and titrated using TMA-OH instead of NaOH. In NH4Cl solution, 25 mM NH4Cl replaced equimolar TMA chloride in the Na+-free solution. In propionate media, 65 mM of sodium propionate or TMA propionate replaced equimolar NaCl or TMA chloride, respectively. In addition, solutions used for visualization of the PM-associated CFP fraction by confocal morphometric analysis contained 10 μM N-(3 triethylammoniumpropyl)-4-(6-(4(diethylamino) phenyl) hexatrienyl) pyridinium dibromide (FM4-64, Molecular Probes). All solutions were prepared fresh directly before use and experiments performed at room temperature.
2.4 Confocal microscopy
Images were collected using a Zeiss LSM510 confocal microscope equipped with a Zeiss C-Apo X40 water immersion lens. Cells were imaged during continuous superfusion with the previously described solutions. To measure pH, SNARF-4F was excited at 543nm, and two emissions collected at 620–680nm and 565–615nm simultaneously, with confocal detectors held at constant gain and dark current settings during the experiment. CFP fluorescence, used to localize fusion proteins, was excited at 458nm with emission collected between 480–520nm. FM4-64, used to label the PM, was excited by 488nm with emission collected between 620–680nm. Due to spectral overlap, experiments could not be performed simultaneously with SNARF-4F and FM4-64. Alexa-633 conjugated goat anti-rabbit antibodies (Molecular Probes) were imaged using 633nm excitation and emission >650nm. Image analysis was performed with MetaMorph software (Universal Imaging).
2.5 pH measurement and calibration
Cytosolic pH was determined from SNARF-4F ratio images of emission intensities 620–680 nm/ 565–615 nm. SNARF-4F has a pKa of 6.4 [31], making it more suitable than SNARF-1 (pKa= 7.5) for measuring pH values below 7.0. Ratios were calibrated to a standard curve using SNARF-4F free acid dissolved in Na-medium and titrated to known pH values between pH 5.0 and 8.0. For calibration to daily instrument settings, images of 20 μM SNARF-4F free acid in Na+ medium at pH7.0 were collected after each experiment.
2.6 Confocal morphometric analysis
In order to determine the percentage of NHE2 or NHE3 present at the plasma membrane, we used a confocal morphometric analysis method devised by Janecki et al. [27] with the following modifications. Instead of GFP, CFP was chosen because of its relative insensitivity to pH [32]. A lower concentration of FM4-64 was used (10μM vs. 20μM) as no improvement in label intensity was observed at concentrations above 10μM [27]. For all analyses, series of CFP and FM4-64 images were collected simultaneously along the focal plane (z-stacks of images) that included the entire cell monolayer. Image analysis was applied to images at each plane to calculate the fraction of total cellular NHE-CFP at the plasma membrane. Briefly, the FM4-64 image was used as a digital mask (after thresholding) that was applied to the CFP image (after background subtraction) in order to generate a resultant image in which only membrane-associated CFP was retained. For each CFP-expressing cell, the integrated CFP pixel intensity in each masked image was summed thru the entire z-stack. to estimate the total CFP at the plasma membrane of that cell. As found by Janecki, FM4-64 did not permeate into the region of cell attachment between the cell and glass coverslip, so CFP fluorescence at the PM was tallied manually in this plane [27]. Total PM CFP was then ratioed against the total CFP fluorescence in the cell to estimate fraction of CFP at the plasma membrane.
2.7 Immunofluorescence staining and Western blotting
Cells grown on coverslips were fixed and immunostained according to the method of Chu et al. [5]. Polyclonal rabbit antisera against NHE3 (specifically vs. rat NHE3 aa528–648) was generously provided by Drs. E.B. Chang and M. Musch (University of Chicago) and has been previously described [6]. Pre-immune serum was used as a control. Primary antisera was applied at a concentration of 5ug/ml. Secondary antisera (goat anti-rabbit IgG labeled with Alexa633) was applied at a concentration of 10ug/ml. Coverslips were mounted with ProLong Antifade Kit (Molecular Probes). Positive and control slides were imaged with identical confocal settings. For Western blots, cell homogenates were prepared in RIPA lysis buffer with protease inhibitor cocktail (Roche, NY), run on 10% SDS-page gels, and transferred to polyvinylidene fluoride membranes (Immobilon PVDF, Millipore, Billerica, PA). Immunorecognition was evaluated by exposure to 1:10,000 dilution of anti-GFP antisera (AbCam, Cambridge, UK) or monoclonal mouse anti-β actin antibody (Sigma, St. Louis, MO), and secondary antibodies were 1:40,000) goat anti-rabbit IgG labeled with IR800 dye (Rockland, Gilbertsville PA)or goat anti-mouse IgG labeled with Alexa 680 (Invitrogen, Carlsbad, CA), respectively. Blots were imaged using a Li-Cor Odyssey infrared imager (Li-Cor, Lincoln, Nebraska).
2.8 Data analysis and statistics
Unless otherwise noted, Student's t-test was used to compare values (Prism, Graphpad software, San Diego CA). Between transfectants and equal numbers of untransfected control cells examined in the same experiment Student's paired t-test was used. Comparisons between different transfectants from separate experiments employed Student's unpaired t-test. Values are presented as mean ± SEM, and n refers to the number of cells. P<0.05 is considered significant.
3. Results
3.1 NHE2-CFP and NHE3-CFP fusion proteins function as Na+/H+ exchangers
Prior to using CFP-tagged NHEs for protein localization, it was important to test whether Na+/H+ function was maintained in the fusion protein. Therefore, NHE-deficient PS120 fibroblasts [29] were transiently transfected with NHE2-CFP or NHE3-CFP. Cytosolic pH was monitored by loading cells with SNARF-4F (a pH-sensitive dye), and Na+/H+ exchange activity was assayed as a Na+-dependent recovery from an acid load. Cellular acidification was imposed by transient exposure to NH4Cl, a weak base[33]. Removal of NH4Cl induces cytosolic acidification in both wild type PS120 and transiently transfected PS120 cells expressing either NHE2-CFP protein (Fig. 1A) or NHE3-CFP protein (Fig.1B). Table 1 shows that average pHi values during cellular acidification were similar among cell types. Cells remained acidified in sodium-free conditions (in the presence of TMA), and upon return of sodium only cells expressing NHE-CFP exhibited sodium-dependent pH recovery. Therefore, NHE2-CFP and NHE3-CFP were confirmed to encode functional Na+/H+ exchanger proteins.
Figure 1. NHE2-CFP and NHE3-CFP fusion proteins function as Na+/H+exchangers.

Cells were loaded with SNARF-4F to monitor cytosolic pH during acid loading. Solution changes are indicated in time bars above each graph. Untransfected control PS120 fibroblasts (open symbols) lacked endogenous Na+/H+ exchanger activity and were unable to recover from cellular acidification. PS120 transfected with NHE2-CFP (A) or NHE3-CFP (B) fusion proteins (closed symbols) were able recover from cellular acidification and therefore contained functional Na+/H+ exchangers. Mean±SEM, n=8 cells.
Table 1. Change in pHi in different Na+-free conditions with and without an imposed acid load.
| Treatment | Isoform | n | Starting pH | ending pH | Δ pH |
|---|---|---|---|---|---|
| NH4Cl prepulse | UT | 16 | 6.96±0.06 | 6.49±0.09a | −0.46±0.15 |
| NHE2-CFP | 8 | 7.46±0.11 | 6.58±0.11 a | −0.88±0.22 | |
| NHE3-CFP | 8 | 6.87±0.10 | 6.36±0.09 a | −0.51±0.19 | |
| Propionate added | UT | 16 | 6.99±0.06 | 6.58±0.04 a | −0.41±0.10 b |
| NHE2-CFP | 10 | 7.24±0.01 | 6.72±0.02 a | −0.52±0.03 b | |
| NHE3-CFP | 6 | 6.75±0.05 | 6.39±0.03 a | −0.36±0.08 b | |
| Na+ removal | UT | 17 | 6.92±0.01 | 6.74±0.04 a | −0.18±0.05 |
| NHE2-CFP | 10 | 7.10±0.01 | 6.88±0.04 a | −0.22±0.05 | |
| NHE3-CFP | 7 | 6.84±0.06 | 6.74±0.04 a | −0.10±0.10 |
Legend: Average change in pHi (Δ pH) calculated from pHi in Na+ medium (starting pH) and pHi 15 min after cells placed in Na+-free medium containing TMA (ending pH). Cellular pH is compared in untransfected cells (UT) versus cells transfected with NHE2-CFP or NHE3-CFP. Results are shown after transient exposure to NH4Cl (NH4Cl prepulse), addition of TMA-propionate (propionate added), or substitution of TMA-Cl for NaCl (Na+ removal). Values given are mean ±SEM. Significance was determined at P<0.05
ending value significantly different from starting value
Δ pH values for cells treated with propionate were not significantly different from Δ pH values for the same cell types treated with ammonium prepulse.
3.2 NHE3-CFP localization in PS120 was identical to NHE3 labeled with antibodies
As described in Materials and Methods, transiently transfected PS120 cells were grown on coverslips and labeled with anti-NHE3 antibodies. Representative confocal immunofluorescence images are shown inFigure 2. Cells expressing NHE3-CFP that were treated with pre-immune sera were not recognized by the Alexa-633 tagged secondary antibody(first column; Fig.2), suggesting that a) anti-NHE3 did not cross react with CFP and b) CFP fluorescence did not contaminate the Alexa-633 channel. In cells expressing NHE3-CFP, CFP and anti-NHE3 Alexa-633 fluorescence was colocalized (second column; Fig. 2). This suggested that a) any CFP dissociated from the fusion protein due to proteolytic cleavage is likely to be a minor contributor, and, b) the anti-NHE3 antisera had acceptable specificity towards the NHE3-CFP fusion protein. The fusion protein was present in a conspicuously bright internal compartment (previously identified by D'Souza et al. [24] as the recycling endosome compartment) and an area at or possibly adjacent to the plasma membrane. The localization of wild-type NHE3 (third column; Fig. 2) was indistinguishable from that of the fusion protein in PS120 cells. This suggested that the addition of CFP coding sequences a) did not radically alter protein localization or b) interfere with the ability of anti-NHE3 to bind to the NHE3 portion of the molecule. Similar studies using NHE2 were not performed because we were unable to find a suitably specific antibody for NHE2 immunostaining that worked under conditions which preserved CFP fluorescence.
Figure 2. Comparison of CFP and NHE3-CFP localization in cells expressing NHE3-CFP or wild-type NHE3.

Figures A-I were collected from fixed immunostained PS120 cells. (See MATERIALS AND METHODS for staining and imaging protocols.) Figures A-F show images from cells that were transiently transfected with NHE3-CFP. Figures G-I show images collected from cells that were stably transfected with wild-type NHE3. Figures A and D show the distribution of CFP fluorescence (green) in NHE3-CFP expressing cells which were respectively labeled with pre-immune sera (Fig. B) or rabbit anti-NHE3 (Fig. E), respectively, and followed by goat anti-rabbit IgG conjugated with Alexa-633 (red). Merged images are shown in Figures C, F, and I. Scale bar, 10 microns.
Experiments were also performed to more stringently test for the presence of fluorescent protein that dissociated from the NHE3-CFP fusion protein. Using mixed PS120 transfectants that had been selected for 2–3 weeks in G418 (described in Methods), cell homogenates enriched in cells expressing NHE3-CFP were analyzed by Western blot with anti-GFP antisera or anti-actin antibodies. As shown in Fig. 3, untransfected cells did not give a positive reaction with the anti-GFP (Lane 1), but PS120 cells transfected with cytosolic CFP gave a band at approximately 27 kDa (Lane 2). Cells transfected with NHE3-CFP (Lane 3) had a prominent band at the expected molecular weight (∼125 kDa), but also reported a minor band at approximately the molecular weight of CFP. Results suggest that a fraction of CFP is liberated from the fusion protein intracellularly and/or during protein isolation. Results will be interpreted assuming the least favorable scenario of intracellular cleavage.
Figure 3. Western blot of transfected fluorescent proteins.

Ten μg of cellular homogenates were run on gels and transferred to membranes for Western blotting with anti-GFP (A) or anti-β-actin antisera (B) on the same blot. Cellular homogenates were derived from untransfected PS120 cells (lane 1), cells transfected with a CFP expression plasmid (Clonetech) and then selected for two weeks with G418 as described in Methods (Lane 2), or cells transfected with the NHE3-CFP expression plasmid and then selected for two weeks with G418 (lane 3). Molecular weight markers were run in parallel on a lane not displayed in the figure. Results are representative of 3 experiments.
3.3 Ammonium treatment caused internalization of the plasma membrane
Our goal was to use FM4-64, a dye that rapidly and reversibly inserts into the outer leaflet of the plasma membrane [34], to label the plasma membrane (PM) during an induced acid load caused by transient ammonium exposure [33]. The simplest protocol would have been to keep FM4-64 present in all perfusate solutions, but exposure to sodium-free ammonium solution stimulated membrane (and dye) internalization. If FM4-64 was present during ammonium exposure of untransfected PS120 cells, the intensity of total cell-associated FM4-64 fluorescence rapidly increased almost 1.5-fold (Fig. 4A). Subsequent removal of FM4-64 at the end of the experiment left 40% of the fluorescence associated with the cells. Comparison of confocal images taken before (Fig. 4B) and after (Fig. 4C) addition of sodium-free NH4Cl confirmed that FM4-64 became internalized (white arrows). If FM4-64 was added transiently and excluded during the NH4Cl exposure (Fig. 4D), dye internalization was greatly reduced. Using this protocol it was possible to add and remove FM4-64 a total of three times, and after each removal the average residual fluorescence was 11%±3% (n= 3) of the fluorescence in the presence of FM4-64. The resultant weak internal fluorescence did not compromise analysis of the amount of FM4-64 at the PM, because the low intracellular signal could be digitally eliminated from the analysis by threshholding. No other changes in perfusate composition were found to cause membrane internalization (data not shown).
Figure 4. Effect of NH4Cl on plasma membrane internalization.

Time course of 620–680nm confocal fluorescence during exposure of untransfected PS120 fibroblasts to FM4-64. Total cellular fluorescence was normalized to the highest average fluorescence during the time course. (A) Total cellular fluorescence from an individual experiment in the continuous presence of FM4-64 as indicated in the time bar. Addition of NH4Cl (NH4 in the time bar) coincides with a large increase in fluorescence. Comparison of Figures B and C (images collected at the times indicated by arrows B and C) show dye internalization caused by NH4Cl (white arrows in Figure C). (D) Total cellular fluorescence from an experiment in which FM4-64 was removed prior to NH4Cl addition. Scale bar, 10 microns.
3.4 Steady-state levels of NHE fusion proteins at the plasma membrane
The steady-state percentage of CFP fluorescence resident at the plasma membrane was stable over the time-frame of an average experiment (60–70 min). PM-associated CFP was calculated as CFP colocalized with FM4-64 while cells were continuously superfused with a physiologic solution (sodium medium) where inorganic ion content resembled culture medium (see Methods). Three replicate image stacks were collected during each exposure to FM4-64 and used in off-line analyses to quantify PM-associated CFP, as described in Methods. In resting cells, 18±2% of NHE2-CFP and 17±1% of NHE3-CFP were initially localized at the plasma membrane (for NHE2-CFP, n=12 analyzed cells in 5 experiments, for NHE3-CFP, n=8 cells in 4 experiments). The percentages of NHE2-CFP or NHE3-CFP present at the plasma membrane were not statistically different 65 min later (P>0.05) in the absence of any changes in media composition. (Fig. 5). Therefore, any changes in NHE-CFP localization observed in subsequent experiments were not artifacts of repeated FM4-64 exposure or instability of protein expression during perfusion. It should be noted that any cytosolic CFP cleaved from the NHE-CFP constructs will lead to an underestimate of the percent of NHE at the PM.
Figure 5. Stability and reliability of NHE-CFP measurement at the plasma membrane.

Upper diagram shows timeline of experiment and relevant solution changes. Shading of FM4-64 bars (FM) in diagram corresponds to time of data collection that resulted in summarized data in bar graph. Graphed results are mean ± SEM. For NHE2-CFP, n= 12 cells from 5 experiments. For NHE3-CFP, n=8 cells from 4 experiments. Starting and ending values were not significantly different (P>0.05).
3.5 Translocation to the plasma membrane following ammonium chloride prepulse
We first tested the potential for NHE translocation during the most common protocol used to study operation of Na+/H+ exchange. As shown in Figure 1, transient NH4Cl exposure followed by a Na+-free solution causes a sustained acid load (known NHE activator) that can be relieved upon Na+ re-addition. This protocol was replicated for studies of NHE-CFP translocation, using PS120 fibroblasts that were transiently transfected with either NHE2-CFP or NHE3-CFP. As shown in Figure 6 (light gray bars), the fraction of NHE2-CFP and NHE3-CFP at the PM increased to 159±17% and 137±8%, respectively (P<0.05) in the Na+-free solution after ammonium exposure. Examination of the raw data disclosed no upward trend among the three replicate image stacks collected under this condition, suggesting that translocation was complete at the time of the first measurement (2–3 min after removing NH4Cl and adding FM4-64). If one includes the preceding ten minute period in NH4Cl medium, the maximal time required for translocation was less than 12–13 minutes. Subsequent exposure to sodium medium (dark gray bars) did not significantly increase the percentage of NHE2-CFP or NHE3-CFP at the PM. Examination of raw data disclosed no downward trend between the first and third replicate image stack, suggesting that upon the reintroduction of sodium medium NHE protein at the PM did not appreciably begin to internalize during the first fifteen minutes. Results show that both NHE2 and NHE3 proteins translocated to the PM following an ammonium prepulse. In this and all other experiments to be described, the increase may be underestimated due to the presence of cytoplasmic CFP cleaved from the NHE-CFP proteins.
Figure 6. Conventional cellular acid loading protocol induced translocation of both NHE2-CFP and NHE3-CFP to the PM.
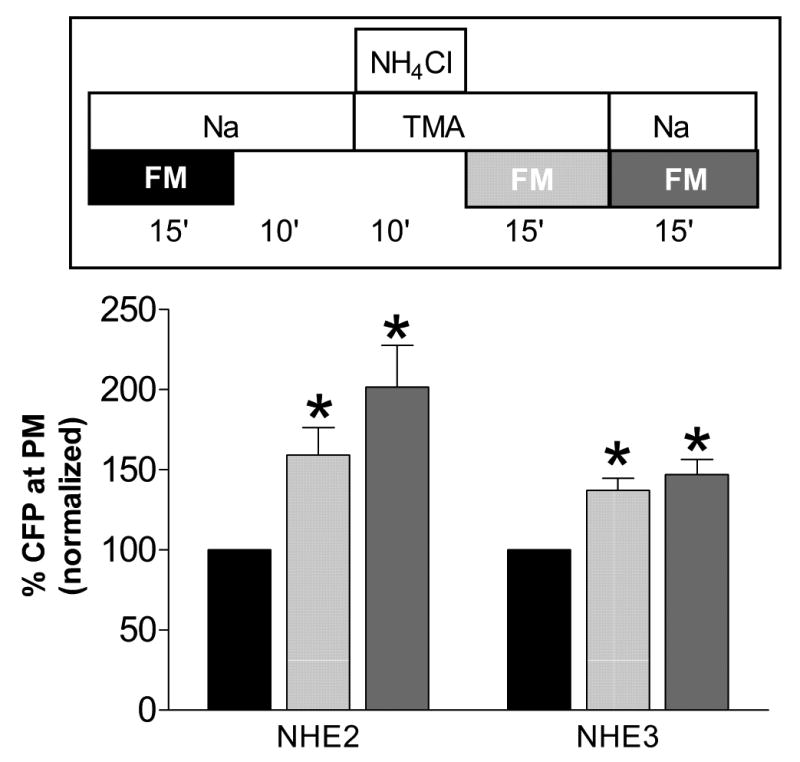
Time course experiment during acid loading and pHi recovery as shown in Fig. 1. As in Fig. 5, upper diagram of time course experiment indicates intervals of FM4-64 exposure that correspond to data in bar graph. Results in each cell are normalized to the initial resting value of CFP at the plasma membrane (black bars = 100%). For NHE2-CFP, n=24 cells from 7 experiments. For NHE3-CFP, n= 15 cells from 5 experiments. * denotes significant difference (P<0.05) versus initial resting state.
Images of cells expressing the NHE-CFP fusion protein can also be used to observe the increase in PM-associated CFP intensity caused by the cellular acidification protocol evaluated in Figure 6. While not readily apparent in images that include the cytosolic compartment, translocation can be observed in masked images that report only PM-associated fluorescence (masking via FM4-64 fluorescence as described in Methods). Translocation is qualitatively shown in Figure 7, where partial projections through representative cells show higher intensity of PM-associated CFP fluorescence after an acid-loading protocol. In this acid-loading protocol, results were qualitatively similar for both NHE2-CFP and NHE3-CFP.
Figure 7. Images displaying translocation of NHE2-CFP and NHE3-CFP to the plasma membrane after acid loading.

Representative images from the data set used to generate Figure 6 were masked to selectively display plasma membrane CFP fluorescence, as described in Methods. Partial stacks of masked images were then projected to display an equivalent region of selected cells before and after acid loading. Image intensity is shown in pseudocolor to highlight differences (color bar scale shown on right side of figure). Fluorescence intensity of a representative NHE2-CFP transfected cell in Na medium before acid loading (A) and in Na+-free medium after acid loading (B). Fluorescence intensity of a representative NHE3-CFP transfected cell in Na medium before acid loading (C) and in Na+-free medium after acid loading (D). Scale bar, ten microns.
Further experiments were performed to distinguish whether it was NH4Cl, ΔNa+, or Δ intracellular pH (pHi) that served as the signal to trigger the translocation.
3.6 Translocation to plasma membrane in response to propionate
Prior results suggested that ammonium altered membrane trafficking, therefore exposure to the weak acid propionate (65 mM substituted mol:mol for Cl) was used as an alternative method to lower pHi. As shown in Figure 8A, both NHE2-CFP and NHE3-CFP translocated to the plasma membrane when pHi was decreased by propionate in the absence of external sodium (light gray bars). When sodium was added back in the continued presence of propionate, the percentage of NHE2-CFP or NHE3-CFP at the PM remained unchanged ( Fig.8A, dark gray bars). As summarized inTable 1, the prompt decrease in pHi caused by propionate (Figs. 8B and 8C) was not significantly different (P>0.05) in magnitude from the pHi decrease caused by ammonium exposure. In Figures 8B and 8C, Na+-dependent pH recovery was not evident in the continued presence of the weak acid, propionate, a condition which acts to keep pHi clamped at a low level [35]. We conclude that in the absence of external sodium, acidification by propionate or ammonium was equally effective at recruiting both NHE2-CFP and NHE3-CFP to the PM. Addition of propionate did not cause internalization of FM4-64 (data not shown), which improved time resolution in the continued presence of FM4-64. In response to propionate, significant translocation from internal stores to the PM occurred within three minutes for both NHE2-CFP and NHE3-CFP (P<0.05).
Figure 8. Effect of propionate on NHE-CFP translocation to PM in absence of extracellular sodium.

(A) Results presented as in Fig. 5. For NHE2-CFP,n=11 cells from 5 experiments. For NHE3-CFP n= 9 cells from 5 experiments. (B) pHi time course for NHE2-CFP transfectants (solid squares) compared with pHi in untransfected cells from same field of view (open squares) treated with propionate. n=4 cells from 2 experiments. (C) pHi time course for NHE3-CFP transfectants (solid triangles) compared with pHi in untransfected cells (open triangles) treated with propionate. For both NHE3-CFP and untransfected cells, n= 6 cells from 3 experiments. * denotes significant difference vs. initial resting value (P<0.05).
3.7 Translocation to plasma membrane in response to sodium removal
During either of the cellular acid loading protocols, both pHi and Na+ were candidate signals for triggering the recruitment of NHE isoforms to the PM. To test if Na+ was a sufficient signal for translocation, NaCl was replaced with TMA-Cl to minimize effects on pHi. As shown in Figures 9B–C andTable 1, although ΔpHi in response to Na+ removal was significant (P<0.05), its magnitude was less than when cells were treated with either NH4Cl prepulse or propionate. However, as shown in Figure 9A (light gray bars) sodium removal caused translocation of NHE3-CFP but not NHE2-CFP, to the PM. We conclude that translocation of NHE3-CFP could be triggered either by the removal of sodium and/or by modest decreases in pHi.
Figure 9. Effect of sodium removal alone on NHE-CFP.

(A) Results presented and analyzed as in Fig. 5. For NHE2-CFP, n= 9 cells from 5 experiments. For NHE3-CFP, n=11 cells from 5 experiments. (B) pHi time course for NHE2-CFP transfectants (solid circles) compared with pHi in untransfected cells from same field of view (open circles). n=10 cells from 3 experiments. (C) pHi time course for NHE3-CFP transfectants (solid diamonds) compared with pHi in untransfected cells from same field of view (open diamonds). n= 12 cells from 3 experiments. * denotes significant difference (P<0.05) vs. initial resting value.
3.8 Translocation to the plasma membrane in response to cellular acidification in the continued presence of sodium
Based on the results in Figure 9, it was predicted that acidification is the required signal causing translocation of NHE2-CFP and could be a secondary signal causing NHE3-CFP translocation. Acidification in the continued presence of sodium was used to test the specific role of pHi. As shown in Figure 10, the percentage of NHE2-CFP at the PM increased (P<0.05) after directly switching to sodium propionate. Under the same conditions, the percentage of NHE3-CFP at the PM was unchanged. Results suggest that recruitment of NHE2-CFP to the PM was specifically triggered by a decrease in pHi while the recruitment of NHE3-CFP to the PM was specifically stimulated by removal of external sodium alone.
Figure 10. Effect of cellular acidification in the continuous presence of sodium, on PM translocation of NHE-CFP.

Results presented and analyzed as in Fig. 6. For NHE2-CFP, n = 16 cells from 5 experiments. For NHE3-CFP n = 9 cells from 5 experiments. * denotes significant difference (P<0.05) vs. initial resting value.
3.9 Identification of NHE domains responsive to different ionic signals
In order to identify domains within NHE2 and NHE3 that were responsive to different translocation signals, full-length NHE3, truncated sequences that lack cytoplasmic C-termini, and chimeric DNA sequences that shuffle the transmembrane and C-terminal domains were built and fused with CFP tags, as described in Materials and Methods. These sequences were stably transfected into PS120 cells. The naming scheme uses the convention of Yun et al. [36], in which M refers to the transmembrane N-terminal domain, C refers to the cytoplasmic C-terminal domain, and the number following the M or C refers to the parent exchanger isoform. In addition, full length NHE3 is referred to as 3FL, and contrasts with the NHE3-CFP protein in that 3FL includes the C-terminal 76 amino acids of NHE3 that are deleted in the NHE3-CFP construct. When Na+ was replaced by TMA (white bars, Fig. 11A), the amount of CFP present at the plasma membrane increased significantly (P<0.01) compared with the baseline values for 3FL (146±1%), M2C3 (150±7%), and M3C2 (117±4%). One-way ANOVA followed by Bonferroni's multiple comparison test confirmed that the increase of M3C2 at the plasma membrane was significantly less (P<0.01) than the increase of 3FL and M2C3 at the plasma membrane. Following Na+ removal, no significant change was seen for M2 (99±4%) or M3 (102±1%). When cells were acidified in the presence of Na+ by treating them with sodium propionate (light gray bars, Fig. 11A), the amount of CFP fluorescence at the plasma membrane increased significantly (P<0.01) for M2C3 (137±%) and decreased significantly (P<0.001) for M3 (93±3%). No significant changes were seen following cellular acidification in sodium propionate for 3FL (101±2%), M3C2 (106±2%), or M2 (106±3%). When M2C3 cells were acidified with propionate in the absence of sodium (dark gray bars, Fig 11A), the percentage of CFP fluorescence localized to the plasma membrane increased significantly (P<0.01) over baseline to 185±8%. One-way ANOVA followed by Bonferroni's multiple comparison test confirmed that this increase was significantly higher (P<0.001) than the increases seen in M2C3 cells after treatment with either Na+ removal or cellular acidification alone.
Figure 11. Identification of NHE domains responsive to different ionic signals.
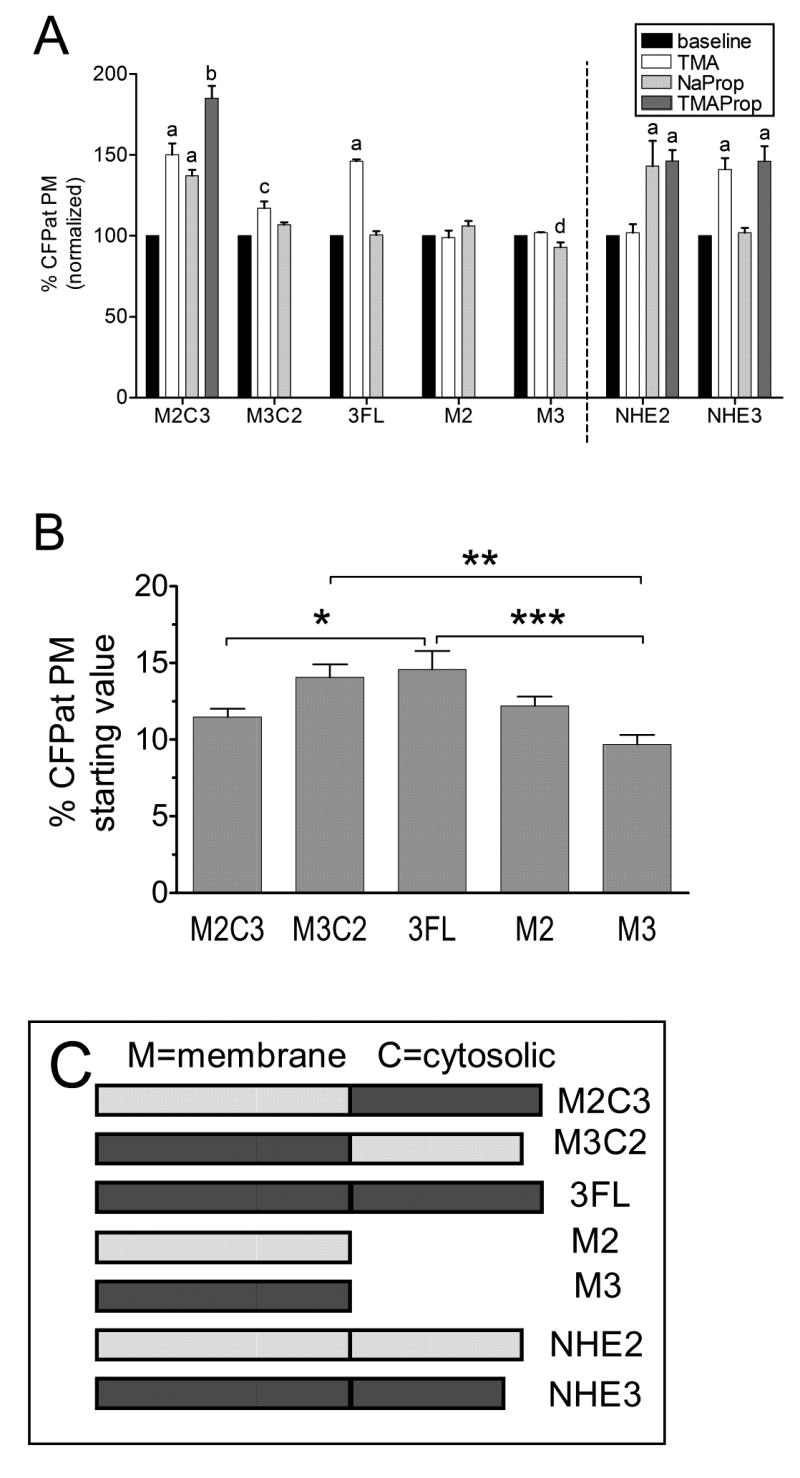
(A) Results in each cell are normalized to the initial resting value of CFP at the plasma membrane (black bars = 100%) prior to exposure to the indicated experimental condition. Graphed results are mean ±SEM. Lowercase letters (a-d) indicate where ANOVA indicated significant difference from baseline values (P< 0.01). Different letters denote values significantly different from one another by Bonferroni's multiple comparison test. Values to the left of the vertical dotted line were collected from stably transfected cells. For M2C3 transfectants, n = 33–35 cells from 3 experiments. For M3C2 transfects, n = 21–22 cells from 4 experiments. For M2 transfects, n = 28–31 cells from 3 experiments. For M3 transfects, n = 14–26 cells from 3 experiments. For 3FL transfects, n = 23–36 cells from 3 experiements. Values to the right of the dotted line summarize data from transiently transfected NHE2-CFP and NHE3- CFP presented previously in Figs. 6–10. (B) Average initial percentage of CFP at the PM for chimeric NHE fusion proteins stably transfected into PS120 cells. For M2C3, n = 102 cells from 9 experiments. For M3C2, n = 44 cells from 9 experiments. For M2, n =60 cells from 6 experiments. For M3, n =42 cells from 6 experiments. For 3FL, n = 57 cells from 6 experiments. Results not significantly different by Bonferroni's multiple comparison test except for the three comparisons indicated by brackets * = P < 0.05, * * = P < 0.01, * * * = P < 0.001. (C) diagrams showing coding sequences of NHEs analyzed in figure 11.
4. Discussion
NHE2 and NHE3 both mediate Na+/H+ exchange in the apical membrane of colonocytes. Previous results from Krishnan et al [18] indicate that the differential activation of these two apical NHE isoforms is regulated by non-endocrine stimuli with rat colon NHE3 being activated by cellular exposure to bicarbonate whereas both NHE3 and NHE2 were activated by butyrate. Our work further defines that NHE2 is rapidly recruited to the PM in response to treatments that lowered cytosolic pH, but was not recruited to the PM in response to external sodium removal. In contrast, NHE3 was rapidly recruited to the PM in response to removal of external sodium, but not by lowered cytosolic pH alone. Thus, all results suggest that one potential benefit of the presence of two apical isoforms is their differential responsiveness to external cues for activation. Our results also suggest that differential responsiveness can be mapped to distinct domains in each isoform since it is possible to use different chimeric proteins to selectively preserve the translocation response to external sodium removal, or to demonstrate an additive response to sodium removal and acidification (Fig 11).
The colonic lumen is an unusual environment. SCFAs (ie. propionate, butyrate, acetate) are commonly present in the lumen of the large intestine at 100–150 mM total concentration [35], ammonium is present at 20–30 mM [37], and sodium is 10–20 mM [38–40]. Our results suggest that all these unusual conditions could potentially modify activation of one or more apical NHEs by translocation of the protein to the membrane. Previous reports suggest that exposure to SCFA causes increased NHE2 activity in HT-29 colonocytes [41,42] and causes increased NHE3 activity in both rat colon and cultured human C2/bbe colonocytes [18,43]. Our results from the PS120 fibroblast suggest that exposure to SCFA can induce selective insertion of NHE2 into the plasma membrane when sodium is present, but SCFA in the absence of sodium causes insertion of both NHE2 and NHE3. The physiologic outcome will depend on the sodium dependence of translocation and the fidelity of observations in PS120 versus native tissue (both in need of further experimentation). In the colon, luminal ammonia inhibits sodium absorption [37], and our observation that 25mM ammonium can trigger PM internalization suggests a potential mechanism for this inhibition of sodium absorption by ammonia if NHEs at the cell surface are internalized along with the PM. In order to test this further, it would be necessary to measure levels of NHE2 and NHE3 at the PM using methods that do not utilize FM 4–64, to avoid the confounding effects that dye internalization has on determining surface protein amounts.
For both NHE2 and NHE3, the time required for recruitment to the plasma membrane appeared to be 2–3 minutes or less (Figs. 8 & 10). In contrast, retrieval from the plasma membrane and subsequent return to resting levels of NHE at the plasma membrane was not observed over 15 min after restoring starting conditions. This may not be surprising since intracellular pH never completely recovered to resting levels during the experimental time after ammonium prepulse (Fig. 1). Likewise, in the TMA-propionate experiments (Fig. 8), pHi values were clamped at a lowered level because of the continued presence of propionate [35]. More interesting is that no NHE3 retrieval from the plasma membrane was seen upon the re-addition of Na+ after 15 minutes in Na+-free medium (Fig. 9). This suggests that there is asymmetry between the length of time required for insertion and retrieval. A potential explanation for this asymmetry comes from Charney et al. [28], who showed that changes in PCO2 can greatly influence both the numbers of endocytotic vesicles and rate of Na+ absorption in isolated colon segments. Since our experiments are carried out in air which has a PCO2 (≈ 0.3 mm Hg) well below physiological levels (≈ 40 mm Hg), perhaps the normal retrieval of membrane proteins via endocytosis has been artificially slowed. On the other hand, retrieval via endocytosis cannot be completely halted under these conditions, since under similar conditions Janecki et al. [27] were able to observe wortmannin-stimulated retrieval of NHE3 from the PM within 30 min.
NHE2 translocation
The present study is the first to directly visualize the recruitment of NHE2 to the plasma membrane in response to lowered pHi. This is consistent with Levine et al.'s [21] 1993 prediction (based on NHE2's regulation by Vmax) that NHE2 activity might be up-regulated by insertion into the plasma membrane and provides an alternative mechanism to explain how the rate of NHE2 Na+/H+ exchange activity increases when pHi drops below 7.5 [44]. With regards to the amount of NHE2 at the cell surface in unstimulated PS120 cells, our value of 18±2% compares favorably with the 20% reported by Cavet et al. [22].
The increased translocation to the plasma membrane by hybrid M2C3 and lack of translocation by hybrid M3C2 treated with sodium propionate (Fig. 11) suggests that the acid-responsive domain of NHE2 resides between amino acids 1–551. However, the lack of increased translocation for M2 suggests that either the M2 domain alone is insufficient to promote translocation or that the function of the M2 domain is hindered when in close proximity to the CFP tag. We did not assess whether M2 functioned as a Na+/H+ exchanger, but note that Yun et al [19] reported their truncated NHE1-3 which completely lacked C-terminal domains had exchange rates which were “much slower” than wild-type. As shown in Fig. 11B, the starting percentage of CFP at the plasma membrane for M2 is not higher than the initial value for M2C3, which suggests that the lack of translocation response by M2 is not a result of having already moved its mobile fraction to the plasma membrane. If robust Na+/H+ exchange activity is required for translocation, then this could explain the unmeasurable translocation by these truncated constructs.
NHE3 translocation
The present study confirms and extends the finding of Janecki et al. [27] that NHE3 activity is regulated by translocation in PS120 fibroblasts. With regards to the initial percentage of NHE3 found at the PM of unstimulated PS120 cells, our value of 17±1% lies between the 14±1% reported by Cavet et al. [22] and the value of 25±3% reported by Janecki et al. [27]. Janecki and coworkers reported that decreased NHE3 activity in response to wortmannin treatment correlated with the internalization of NHE3 from the plasma membrane, whereas we found that increased NHE3 activity after cellular acid loading coincided with insertion of NHE3 into the plasma membrane from internal stores. Different potential signals within the acid loading protocol were examined, and it was determined that lowered Na+ alone appeared to be sufficient signal to trigger the recruitment of NHE3 to the PM. The removal of external Na+ may partially mimic physiological conditions in the colonic lumen, where ion composition is enriched in K+ and the normal Na+ concentration is in the 10–20 mM range.[38–40] The triggering signal for translocation could be either a direct result of lowering extracellular Na+ or due to lowered internal [Na+] as a consequence of reduced external Na+.
The nature of the signal and the sodium concentration dependence will require further experimentation, but in this first report we have attempted to identify regions of the protein that are required for the translocation response. The 3FL protein contains the entire coding sequene of NHE3, whereas the construct used for the majority of experiments, termed NHE3-CFP, lacks amino acids 737–813 (eliminated as part of the construction of the fusion protein, see Methods). Both proteins have similar starting levels of protein at the PM, and show indistinguishable translocation responses to TMA vs. NaProp (Fig 11), suggesting that the C-terminal 76 amino acids are not determinants of translocation. Hybrid M2C3 translocates similarly as 3FL in response to sodium removal while the translocation of hybrid M3C2 is reduced and M3 does not increase. Results suggest that a domain of NHE3 between amino acids 536–737 is responsible for efficient translocation in response to Na+ removal. The lack of any change in localization for M3 suggests that either M3 alone is insufficient to support the modest increase exhibited by M3C2 or (as discussed earlier), diminished transport function of these severe truncation constructs [18] may interfere with M3 translocation. The initial percentage of CFP at the plasma membrane for M3 is not higher than the starting percentage for 3FL or M2C3, which suggests that the lack of translocation by M3 does not result from M3 having previously moved its mobile fraction to the plasma membrane. Conversely, there was less M2C3 than 3FL at the plasma membrane in the basal state, but this does not seem to have affected the outcome as they both display similar translocation in response to Na+ removal. Sodium is reported to be an indirect stimulant for the insertion of epithelial sodium channel (ENaC) subunits and for insertion of water channel aquaporins into the plasma membrane of kidney cells, mediated by aldosterone [45] and vasopressin [46], respectively.
We note that even after stimulation, the majority of fluorescent protein (presumptive NHE2-CFP or NHE3-CFP) is retained within intracellular compartments in PS120 cells. Results suggest that this may be partially explained by some free CFP in the transfected cells, and this inefficient distribution of a PM transport protein may also be an artifact of working in a fibroblast model system. However, results do identify a novel route for cellular activation of both NHE2 and NHE3 that should be considered in future experiments with epithelial cells of more direct and robust relevance to the native tissues that endogenously express these molecules.
Acknowledgments
Supported by NIH grants F32 DK61178 (J.S.G.) and RO1 DK42457 (M.H.M.)
Abbreviations
- Na+o
external sodium concentration
- pHi
intracellular pH
- PM
plasma membrane
- TMA
tetramethylammonium
- Vmax
maximum velocity of transport
Footnotes
Publisher's Disclaimer: This is a PDF file of an unedited manuscript that has been accepted for publication. As a service to our customers we are providing this early version of the manuscript. The manuscript will undergo copyediting, typesetting, and review of the resulting proof before it is published in its final citable form. Please note that during the production process errors may be discovered which could affect the content, and all legal disclaimers that apply to the journal pertain.
References
- 1.Bobulescu IA, Di Sole F, Moe OW. Na+/H+ exchangers: physiology and link to hypertension and organ ischemia. Curr Opin Nephrol Hypertens. 2005;14:485–494. doi: 10.1097/01.mnh.0000174146.52915.5d. [DOI] [PMC free article] [PubMed] [Google Scholar]
- 2.Orlowski J, Grinstein S. Diversity of the mammalian sodium/proton exchanger SLC9 gene family. Pflugers Arch. 2004;447:549–565. doi: 10.1007/s00424-003-1110-3. [DOI] [PubMed] [Google Scholar]
- 3.Hoogerwerf WA, Tsao SC, Devuyst O, Levine SA, Yun CH, Yip JW, Cohen ME, Wilson PD, Lazenby AJ, Tse CM, Donowitz M. NHE2 and NHE3 are human and rabbit intestinal brush-border proteins. Am J Physiol Gastrointest Liver Physiol. 1996;270:G29–G41. doi: 10.1152/ajpgi.1996.270.1.G29. [DOI] [PubMed] [Google Scholar]
- 4.Wormmeester L, Sanchez de Medina F, Kokke F, Tse CM, Khurana S, Bowser J, Cohen ME, Donowitz M. Quantitative contribution of NHE2 and NHE3 to rabbit ileal brush-border Na+/H+ exchange. Am J Physiol. 1998;274:C1261–C1272. doi: 10.1152/ajpcell.1998.274.5.C1261. [DOI] [PubMed] [Google Scholar]
- 5.Chu J, Chu S, Montrose MH. Apical Na+/H+ exchange near the base of mouse colonic crypts. Am J Physiol Cell Physiol. 2002;283:C358–C372. doi: 10.1152/ajpcell.01380.2000. [DOI] [PubMed] [Google Scholar]
- 6.Bookstein C, DePaoli AM, Xie Y, Niu P, Musch MW, Rao MC, Chang EB. Na+/H+ exchangers, NHE-1 and NHE-3, of rat intestine, Expression and localization. J Clin Invest. 1994;93:106–113. doi: 10.1172/JCI116933. [DOI] [PMC free article] [PubMed] [Google Scholar]
- 7.Bookstein C, Xie Y, Rabenau K, Musch MW, McSwine RL, Rao MC, Chang EB. Tissue distribution of Na+/H+ exchanger isoforms NHE2 and NHE4 in rat intestine and kidney. Am J Physiol. 1997;273:C1496–505. doi: 10.1152/ajpcell.1997.273.5.C1496. [DOI] [PubMed] [Google Scholar]
- 8.Dudeja PK, Rao DD, Syed I, Joshi V, Dahdal RY, Gardner C, Risk MC, Schmidt L, Bavishi D, Kim KE, Harig JM, Goldstein JL, Layden TJ, Ramaswamy K. Intestinal distribution of human Na+/H+ exchanger isoforms NHE-1, NHE-2, and NHE-3 mRNA. Am J Physiol. 1996;271:G483–G493. doi: 10.1152/ajpgi.1996.271.3.G483. [DOI] [PubMed] [Google Scholar]
- 9.Malakooti J, Dahdal RY, Schmidt L, Layden TJ, Dudeja PK, Ramaswamy K. Molecular cloning, tissue distribution, and functional expression of the human Na(+)/H(+) exchanger NHE2. Am J Physiol. 1999;277:G383–G390. doi: 10.1152/ajpgi.1999.277.2.G383. [DOI] [PubMed] [Google Scholar]
- 10.Gawenis LR, Stien X, Shull GE, Schultheis PJ, Woo AL, Walker NM, Clarke LL. Intestinal NaCl transport in NHE2 and NHE3 knockout mice. Am J Physiol Gastrointest Liver Physiol. 2002;282:G776–G784. doi: 10.1152/ajpgi.00297.2001. [DOI] [PubMed] [Google Scholar]
- 11.Ledoussal C, Woo AL, Miller ML, Shull GE. Loss of the NHE2 Na(+)/H(+) exchanger has no apparent effect on diarrheal state of NHE3-deficient mice. Am J Physiol Gastrointest Liver Physiol. 2001;281:G1385–G1396. doi: 10.1152/ajpgi.2001.281.6.G1385. [DOI] [PubMed] [Google Scholar]
- 12.Ledoussal C, Woo AL, Miller ML, Shull GE. Loss of the NHE2 Na(+)/H(+) exchanger has no apparent effect on diarrheal state of NHE3-deficient mice. Am J Physiol Gastrointest Liver Physiol. 2001;281:G1385–G1396. doi: 10.1152/ajpgi.2001.281.6.G1385. [DOI] [PubMed] [Google Scholar]
- 13.Ledoussal C, Lorenz JN, Nieman ML, Soleimani M, Schultheis PJ, Shull GE. Renal salt wasting in mice lacking NHE3 Na+/H+ exchanger but not in mice lacking NHE2. Am J Physiol Renal Physiol. 2001;281:F718–F727. doi: 10.1152/ajprenal.2001.281.4.F718. [DOI] [PubMed] [Google Scholar]
- 14.Bachmann O, Riederer B, Rossmann H, Groos S, Schultheis PJ, Shull GE, Gregor M, Manns MP, Seidler U. The Na+/H+ exchanger isoform 2 is the predominant isoform in murine colonic crypts and its lack causes NHE3 upregulation. Am J Physiol. 2004;287:G125–G133. doi: 10.1152/ajpgi.00332.2003. [DOI] [PubMed] [Google Scholar]
- 15.Guan Y, Dong J, Tackett L, Meyer JW, Shull GE, Montrose MH. NHE2 is the main apical Na+/H+ exchanger in mouse colonic crypts but an alternative Na+ -dependent acid extrusion mechanism is upregulated in NHE2-null mice. Am J Physiol. 2006;291:G689–G699. doi: 10.1152/ajpgi.00342.2005. [DOI] [PubMed] [Google Scholar]
- 16.Cermak R, Lawnitzak C, Scharrer E. Influence of ammonia on sodium absorption in rat proximal colon. Pfugers Arch. 2000;440:619–626. doi: 10.1007/s004240000309. [DOI] [PubMed] [Google Scholar]
- 17.Ikuma M, Kashgarian M, Binder HJ, Rajendran VM. Differential regulation of NHE isoforms by sodium depletion in proximal and distal segments of rat colon. Am J Physiol. 1999;276:G539–G549. doi: 10.1152/ajpgi.1999.276.2.G539. [DOI] [PubMed] [Google Scholar]
- 18.Krishnan S, Rajendran VM, Binder HJ. Apical NHE isoforms differentially regulate butyrate-stimulated Na absorption in rat distal colon. Am J Cell Physiol. 2003;285:1246–1254. doi: 10.1152/ajpcell.00598.2002. [DOI] [PubMed] [Google Scholar]
- 19.Yun CHC, Tse CM, Nath SK, Levine SA, Brant SR, Donowitz M. Mammalian Na+/H+ exchanger gene family: structure and function studies. Am J Physiol. 1995;269:G1–G11. doi: 10.1152/ajpgi.1995.269.1.G1. [DOI] [PubMed] [Google Scholar]
- 20.Nath SK, Kambadur R, Yun CH, Donowitz M, Tse CM. NHE2 contains subdomains in the COOH terminus for growth factor and protein kinase regulation. Am J Physiol. 1999;276:C873–C882. doi: 10.1152/ajpcell.1999.276.4.C873. [DOI] [PubMed] [Google Scholar]
- 21.Levine SA, Montrose MH, Tse CM, Donowitz M. Kinetics and regulation of three cloned mammalian Na+/H+ exchangers stably expressed in a fibroblast cell line. J Biol Chem. 1993;268:25527–25535. [PubMed] [Google Scholar]
- 22.Cavet ME, Akhter S, de Medina FS, Donowitz M, Tse CM. Na(+)/H(+) exchangers (NHE1-3) have similar turnover numbers but different percentages on the cell surface. Am J Physiol. 1999;277:C1111–C1121. doi: 10.1152/ajpcell.1999.277.6.C1111. [DOI] [PubMed] [Google Scholar]
- 23.Cavet ME, Akhter S, Murtazina R, Sanchez de Medina F, Tse CM, Donowitz M. Half-lives of plasma membrane Na(+)/H(+) exchangers NHE1–3: plasma membrane NHE2 has a rapid rate of degradation. Am J Physiol Cell Physiol. 2001;281:C2039–C2048. doi: 10.1152/ajpcell.2001.281.6.C2039. [DOI] [PubMed] [Google Scholar]
- 24.D'Souza S, Garcia-Cabado A, Yu F, Teter K, Lukacs G, Skorecki K, Moore HP, Orlowski J, Grinstein S. The epithelial sodium-hydrogen antiporter Na+/H+ exchanger 3 accumulates and is functional in recycling endosomes. J Biol Chem. 1998;273:2035–2043. doi: 10.1074/jbc.273.4.2035. [DOI] [PubMed] [Google Scholar]
- 25.Kurashima K, Szabó EZ, Lukacs G, Orlowski J, Grinstein S. Endosomal recycling of the Na+/H+ exchanger NHE3 isoform is regulated by the phosphatidylinositol 3-kinase pathway. J Biol Chem. 1998;273:20828–20836. doi: 10.1074/jbc.273.33.20828. [DOI] [PubMed] [Google Scholar]
- 26.Janecki AJ, Janecki M, Akhter S, Donowitz M. Basic fibroblast growth factor stimulates surface expression and activity of Na(+)/H(+) exchanger NHE3 via mechanism involving phosphatidylinositol 3-kinase. J Biol Chem. 2000;275:8133–1842. doi: 10.1074/jbc.275.11.8133. [DOI] [PubMed] [Google Scholar]
- 27.Janecki AJ, Janecki M, Akhter S, Donowitz M. Quantitation of plasma membrane expression of a fusion protein of Na+/H+ exchanger NHE3 and green fluorescence protein (GFP) in living PS120 fibroblasts. J Histochem Cytochem. 2000;48:1479–1492. doi: 10.1177/002215540004801105. [DOI] [PubMed] [Google Scholar]
- 28.Charney AN, Egnor RW, Cassai N, Sidhu GS. Carbon dioxide affects rat colonic Na+ absorption by modulating vesiclular traffic. Gastroenterology. 2002;122:318–330. doi: 10.1053/gast.2002.31101. [DOI] [PubMed] [Google Scholar]
- 29.Pouyssegur J, Sardet C, Franchi A, Paris S. A specific mutation abolishing Na+/H+ antiport activity in hamster fibroblasts precludes growth at neutral and acidic pH. Proc Natl Acad Sci USA. 1984;81:4833–4837. doi: 10.1073/pnas.81.15.4833. [DOI] [PMC free article] [PubMed] [Google Scholar]
- 30.Orlowski J, Kandasamy RA, Shull GE. Molecular cloning of putative members of the Na+/H+ exchanger gene family. CDNA cloning, deduced amino acid sequence, and mRNA tissue expression of the rat Na+/H+ exchanger NHE-1 and two structurally related proteins. J Biol Chem. 1992;267:9331–9339. [PubMed] [Google Scholar]
- 31.Liu J, Diwu Z, Leung WY. Synthesis and photophysical properties of new fluorinated benzo [c]xanthene dyes as intracellular pH indicators. Bioorg Med Chem Lett. 2001;11:2903–2905. doi: 10.1016/s0960-894x(01)00595-9. [DOI] [PubMed] [Google Scholar]
- 32.Llopis J, McCaffery JM, Miyawaki A, Farquhar MG, Tsien RY. Measurement of cytosolic, mitochondrial, and Golgi pH in single living cells with green fluorescent proteins. Proc Natl Acad Sci USA. 1998;95:6803–6808. doi: 10.1073/pnas.95.12.6803. [DOI] [PMC free article] [PubMed] [Google Scholar]
- 33.Roos A, Boron WF. Intracellular pH. Physiol Rev. 1981;61:296–434. doi: 10.1152/physrev.1981.61.2.296. [DOI] [PubMed] [Google Scholar]
- 34.Betz WJ, Mao F, Smith CB. Imaging exocytosis and endocytosis. Curr Op Neurobiol. 1996;6:365–371. doi: 10.1016/s0959-4388(96)80121-8. [DOI] [PubMed] [Google Scholar]
- 35.Chu S, Montrose MH. An Na Na+-independent short-chain fatty acid transporter contributes to intracellular pH regulation in murine colonocytes. J Gen Physiol. 1995;105:589–615. doi: 10.1085/jgp.105.5.589. [DOI] [PMC free article] [PubMed] [Google Scholar]
- 36.Yun CHC, Tse CM, Donowitz M. Chimeric Na Na+/H Na+ exchangers: An epithelial membrane bound N-terminal domain requires an epithelial cytoplasmic C-terminal domain for regulation by protein kinases. Proc Natl Acad Sci USA. 1995;92:10723–10727. doi: 10.1073/pnas.92.23.10723. [DOI] [PMC free article] [PubMed] [Google Scholar]
- 37.Cermak R, Minck M, Lawnitzak C, Scharrer E. Ammonia inhibits sodium and chloride absorption in rat distal colon. Exp Physiol. 2002;87:2331–2319. doi: 10.1113/eph8702331. [DOI] [PubMed] [Google Scholar]
- 38.Holtug K, Clausen MR, Hove H, Christiansen J, Mortensen PB. The colon in carbohydrate Malabsorption: short-chain fatty acids, pH and osmotic diarrhea. Scand J Gatroenterol. 1992;27:545–552. doi: 10.3109/00365529209000118. [DOI] [PubMed] [Google Scholar]
- 39.Bustos D, Pons S, Pernas JC, Gonzalez H, Caldarini MI, Ogawa K, DePaula JA. Fecal lactate and short bowel syndrome. Dig Diseases and Sciences. 1994;39:2315–2319. doi: 10.1007/BF02087644. [DOI] [PubMed] [Google Scholar]
- 40.Vernia P, Caprilli R, Latella G, Barbetti F, Magliocca FM, Cittadini M. Fecal lactate and ulcerative colitis. Gastroenterology. 1988;95:1564–1568. doi: 10.1016/s0016-5085(88)80078-7. [DOI] [PubMed] [Google Scholar]
- 41.Gonda T, Maouyo D, Rees SE, Montrose MH. Regulation of intracellular pH gradients by identified Na/H exchanger isoforms and a short-chain fatty acid. Am J Physiol. 1999;276:G259–270. doi: 10.1152/ajpgi.1999.276.1.G259. [DOI] [PubMed] [Google Scholar]
- 42.Maouyo D, Chu S, Montrose MH. pH heterogeneity at intracellular and extracellular plasma membrane sites in HT-29-C1 cell monolayers. Am J Physiol. 2000;278:C973–C981. doi: 10.1152/ajpcell.2000.278.5.C973. [DOI] [PubMed] [Google Scholar]
- 43.Musch MW, Bookstein C, Xie Y, Sellin JH, Chang EB. SCFA increase intestinal Na absorption of NHE3 in rat colon and human intestinal C2/bbe cells. Am J Physiol. 2001;280:G687–G693. doi: 10.1152/ajpgi.2001.280.4.G687. [DOI] [PubMed] [Google Scholar]
- 44.Yu FH, Shull GE, Orlowski J. Functional properties of the rat Na/H exchanger NHE-2 isoform expressed in Na/H exchanger-deficient Chinese hamster ovary cells. J Biol Chem. 1993;268:25536–25541. [PubMed] [Google Scholar]
- 45.Masilamani S, Kim GH, Mitchell C, Wade JB, Knepper MA. Aldosterone-mediated regulation of ENaC α, β, γ subunit proteins in rat kidney. J Clin Invest. 1999;104:R19–R23. doi: 10.1172/JCI7840. [DOI] [PMC free article] [PubMed] [Google Scholar]
- 46.Bouley R, Breton S, Sun T, McLaughlin M, Nsumu NN, Lin HY, Ausiello DA, Brown D. Nitric oxide and atrial naturetic factor stimulate cGMP-dependent membrane insertion of aquaporin 2 in renal epithelial cells. J Clin Invest. 2000;106:1115–1126. doi: 10.1172/JCI9594. [DOI] [PMC free article] [PubMed] [Google Scholar]