

Abstract
Male mice from 28 inbred strains (129P3/J, A/J, AKR/J, BALB/cByJ, BUB/BnJ, C3H/HeJ, C57BL/6J, C57L/J, CAST/Ei, CBA/J, CE/J, DBA/2J, FVB/NJ, I/LnJ, KK/H1J, LP/J, NOD/LtJ, NZB/B1NJ, P/J, PL/J, RBF/DnJ, RF/J, RIIIS/J, SEA/GnJ, SJL/J, SM/J, SPRET/Ei, and SWR/J) were tested with NaCl (75–450 mM), KCl (30–300 mM), CaCl2 (3–100 mM), and NH4Cl (10–300 mM) solutions using two-bottle preference tests with water as the second choice. For each mineral, there was a wide range of strain variation in solution intakes and preferences. This variation had a substantial genetic component as assessed using heritability estimates. In most cases, the strain means were continuously distributed; however, strains with deviating high or low intakes or preferences were also observed. The associations among the responses to different minerals were only modest, suggesting distinct genetic controls of sodium, potassium, calcium, and ammonium consumption. These results provide a valuable resource for investigators who wish to identify genes involved in the regulation of mineral consumption and balance.
Keywords: Mice, genetics, appetite, preference, salt, sodium, potassium, calcium
INTRODUCTION
The consumption of inappropriately high or low amounts of several minerals can exacerbate many chronic diseases, including hypertension and osteoporosis (e.g., reviewed in [Beauchamp and Engelman, 1991; Tordoff, 2001]). However, despite impressive progress toward characterization of the genetic bases of some of these diseases, there has been little concerted effort to understand the genetic controls of mineral intake. The comparison of animals from inbred strains is an initial step towards identification of genetic factors controlling mineral intake. In previous studies, strain differences in spontaneous intake of NaCl solutions have been noted. For example, rat strains can be characterized by high NaCl intakes (SHR), moderate NaCl intakes (e.g., Dahl-R, Sprague-Dawley, Dark Agouti, WKY, GHR, NT), or low NaCl intakes (e.g., Fisher-344, Dahl-S, Brattleboro) (Wolf et al., 1965; Catalanotto et al., 1972; Fregly, 1975; DiNicolantonio et al., 1983; Midkiff and Bernstein, 1983; Ferrell and Gray, 1985; Midkiff et al., 1985; Ely et al., 1987; Bachmanov, 1989, 1993; Yongue and Myers, 1989; Rowland and Fregly, 1990; Bernstein et al., 1991). NaCl preferences have also been characterized in 12 mouse strains: 129, A2G, BALB/c, BPH/2, BPL/1, BPN/3, C3H/He, C57BL/6, CBA, DBA/2, NZB/B1NJ, and TO (Ninomiya et al., 1989; Lush, 1991; Beauchamp and Fisher, 1993; Gannon and Contreras, 1993; Bachmanov et al., 1998a, 1998b). However, each of these previous studies included five or fewer strains and involved different methods, so it is impossible to compare all the strains directly. Nevertheless, there was a considerable range of responses among the strains tested, including strong preferences for hypotonic and isotonic NaCl (BPN/3, BPL/1 and TO [Lush, 1991; Bachmanov et al., 1998a]), high intakes of hypertonic NaCl (NZB/B1NJ [Bachmanov et al., 1998b]), and strong avoidance of all concentrations of NaCl (CBA [Bachmanov et al., 1998b]).
In contrast to this work on strain differences in ingestion of NaCl solutions, there is little parallel work with other minerals. Rats of the SHR strain ingest more calcium and potassium solutions or calcium-containing diet than do rats of the WKY strain (Ferrell and Dreith, 1986; Bachmanov, 1989, 1993; Tordoff, 1992a). Mice of the BPL/1 strain drink less CaCl2 and more of some concentrations of KCl than do mice of the BPN/3 or BPH/2 strains (Bachmanov et al., 1998a). We are unaware of any published work on strain differences in intake of other minerals.
To provide a more comprehensive examination of strain differences in mineral intake, we used 48-h two-bottle choice tests to assess the voluntary intake of and preference for, various mineral chlorides by 28 inbred strains of mice. We concentrated on four mineral chlorides: NaCl, KCl, CaCl2, and NH4Cl for several reasons. Each cation is regulated by independent homeostatic systems, and at least for sodium, potassium, and calcium, is the target of a specific appetite (e.g., Eckert, 1938; Scott et al., 1950; Milner and Zucker, 1965; Adam and Dawborn, 1972; Lobaugh et al., 1981; Denton, 1984; Rowland and Fregly, 1988; Tordoff et al., 1998; Tordoff, 2001). At the same time, there is much interplay among the control mechanisms for consumption of each mineral. Physiological examples of this include the regulation of aldosterone by both potassium excess and sodium deficiency, the linked excretion of sodium and calcium, and co-transport involving Na+/Ca2+, Na+/K+, and Na+/H+-ATPases. Behavioral examples include the increase in NaCl intake observed during calcium or potassium deficiency (e.g., Zucker, 1965; Adam and Dawborn, 1972; Tordoff, 1992b, 1996). There are also similarities among NaCl, KCl, CaCl2, and NH4Cl in taste. For example, high concentrations of all four mineral salts have a salty taste component, and all except NaCl are rated as bitter [at least by humans (McBurney and Shick, 1971; Schiffman and Erickson, 1971)]. By comparing the voluntary intake of different minerals by many strains of mice, we hoped to gain insight into the relationships among the factors controlling consumption of these salts.
METHODS
Procedure
Mice, diet, housing conditions, and construction of drinking tubes are described in an accompanying paper (Bachmanov et al., 2002). Tests of mineral intake began 3 days after the end of food and water intake tests (Bachmanov et al., 2002). The mice received four series of two-bottle choice tests. These involved ascending concentrations of NaCl (75, 150, 300, 450 mM), KCl (10, 30, 100, 200, 300 mM), CaCl2 (3, 10, 30, 100 mM), and NH4Cl (10, 30, 100, 300 mM). The concentrations used were chosen based on previous work (Bachmanov et al., 1996, 1998a, 1998b) and pilot studies so as to span the range from indifference to strong avoidance by most strains of mice. Each concentration was tested for 48 h, with the positions of the tubes containing taste solution and water switched after 24 h to control for side preferences. There were no breaks between testing different concentrations of the same compound, but between testing different compounds, the mice received deionized water in both drinking tubes for at least three days. Body weight was measured (to the nearest 0.1 g) at the beginning of each series of taste solutions, and at the end of the experiment.
Data Analysis
Intakes from each day of each of the 2-day choice tests were averaged to provide measures of daily water intake and solution intake. Body weight values used in analyses were based on the average body weights collected before and after each test. Total fluid intake was calculated as the sum of water intake and solution intake. Solution preference scores were calculated as the ratio of average daily solution intake to average daily total fluid intake (×100).
Eighty of the 10,948 measurements made were lost due to technical errors (e.g., spilled or leaking drinking tubes; error rate < 0.75%). The data lost appeared to be distributed randomly among the strains. The data set contained several measures for each of four taste solutions in a total of 17 concentrations. With the large number of potential comparisons involved, there is a strong possibility of Type I errors occurring. To ameliorate this, we set the criterion for significance at P < 0.01 for all statistical tests. However, exact probability values are given throughout the text to allow investigators who prefer other criteria for significance to apply them.
Three inbred strains included mice with different genotypes because these strains are bred using a forced heterozygosity procedure. These were 129P3/J (Tyrc/Tyrc, albino coat color phenotype, n = 10; and Tyrc−ch/Tyrc, light chinchilla coat color phenotype, n = 2), SM/J (Aw/a, white-bellied agouti coat color phenotype, n = 7; and a/a, black coat color phenotype, n = 5) and SEA/GnJ (Bmp5se/Bmp5se, short ears phenotype, n = 6; and Bmp5se/+, normal ears phenotype, n = 6). The only significant difference detected was related to 10 mM KCl intakes by the two SM/J genotypes. However, this was probably due to chance because 10 mM KCl was neither preferred nor avoided by most of the strains (see Results). We also noticed that one NOD/LtJ mouse lost 2.8 g (9.5% of initial body weight) during the NH4Cl test period and drank progressively larger volumes of fluid (during tests with 100 and 300 mM NH4Cl, total intake of this mouse was 19–20 ml/day), which is typical of the diabetes that develops in this strain. However, the other NOD/LtJ mice did not show weight loss or high fluid intakes (relative to other strains), and NH4Cl intake and preference of the diabetic mouse were within the range displayed by other mice from this strain, so we did not exclude its data. Therefore, data for individual types of mice of the same strain were pooled together for subsequent analyses.
Two-way ANOVAs were used to assess the effects of strain (between-subjects), concentration (within-subjects), and their interaction on each of the five dependent variables (solution intake per mouse, solution intake per unit of body weight, water intake per mouse, total fluid intake per mouse, and solution preference) for each of the four taste solutions. This was followed up by planned comparisons, consisting of one-way ANOVAs for each concentration separately. Tukey’s Honestly Significant Difference post hoc tests from the one-way ANOVAs were used to identify differences between pairs of means and ascertain homogeneous groups.
Heritability estimates and genetic correlations were calculated as described in the accompanying paper (Bachmanov et al., 2002). Cluster analysis was conducted using Statistica software (StatSoft, Tulsa, OK). The correlation matrix was used as input, and the correlations were transformed to dissimilarities (1 − r), which were used as distance measures. Single linkage was used as the amalgamation rule.
RESULTS
Relationship of Mineral Solution Intake and Preference to Water Intake and Body Weight
Fluid intake often depends on body size [see detailed discussion in (Bachmanov et al., 1998b, 2001, 2002)]. A positive correlation was found between water intake and body weight in the same 28 strains (Bachmanov et al., 2002). To examine the possibility that body size might contribute to differences in solution intake or preference, we calculated correlation coefficients of body weight or water intake (given as the only liquid) with solution intakes or preferences (Table I). Significant correlations involved intakes of the weakest NaCl and KCl solutions only. These dilute mineral solutions were neutral to many strains (see results below), and therefore their consumption is proportional to total fluid intake, which depends on body size. For intakes of most solutions, and for all solution preference scores, the distributions of strain means were unrelated to body weight or water intake. We therefore concluded that for the 28 strains tested here, mineral solution intakes and preferences are generally independent of body size and customary fluid intake (represented by intakes of water available as the only fluid), and so do not require adjustments for these variables. Thus, we report unadjusted daily solution intakes per mouse and preference scores.
Table I.
Pearson Product-Moment Correlations of Strain Means for Water Intake (given as the only fluid available) and Body Weight with Strain Means for Taste Solution Intake and Preference (n = 28)
| Intakes
|
Preferences
|
|||
|---|---|---|---|---|
| Solution and concentration (mM) | Water intake | Body weight | Water Intake | Body weight |
| NaCl | ||||
| 75 | 0.55* | 0.65* | 0.22 | 0.05 |
| 150 | 0.42 | 0.49 | 0.19 | 0.06 |
| 300 | 0.16 | 0.22 | −0.02 | −0.11 |
| 450 | 0.18 | 0.09 | −0.01 | −0.18 |
| KCl | ||||
| 10 | 0.61* | 0.82* | 0.05 | −0.13 |
| 30 | 0.56* | 0.80* | 0.15 | 0.01 |
| 100 | 0.38 | 0.67* | 0.00 | 0.04 |
| 200 | −0.08 | 0.12 | −0.27 | −0.20 |
| 300 | −0.06 | 0.10 | −0.19 | −0.10 |
| CaCl2 | ||||
| 3 | 0.12 | 0.41 | −0.12 | −0.04 |
| 10 | −0.02 | 0.07 | −0.25 | −0.31 |
| 30 | −0.22 | −0.14 | −0.35 | −0.34 |
| 100 | −0.26 | −0.16 | −0.39 | −0.36 |
| NH4Cl | ||||
| 10 | 0.19 | 0.35 | −0.09 | −0.17 |
| 30 | 0.19 | 0.28 | −0.10 | −0.21 |
| 100 | 0.05 | 0.11 | −0.14 | −0.19 |
| 300 | −0.18 | −0.09 | −0.31 | −0.28 |
p < .01.
Strain Differences in Mineral Solution Intakes and Preferences
For each of the four minerals, significant effects of strain, concentration, and their interaction on each of the five dependent variables (solution intake per mouse, solution intake per unit of body weight, water intake per mouse, total fluid intake per mouse, and solution preference) were detected using two-way ANOVAs (all P’s < 0.0000001). In the subsequent planned comparison one-way ANOVAs for each solution concentration, there were highly significant differences between the 28 strains in both intake and preference of every taste solution, with the exception of preference for 30 mM KCl solution (Table II). The concentration-response functions for each taste solution are shown in Figures 1, 2, 3, 4, and distribution patterns are presented in Figure 5.
Table II.
Results of One-Way ANOVAs for Strain Differences in Taste Solution Intakes and Preferences
| Intakes
|
Preferences
|
||||
|---|---|---|---|---|---|
| Test | df | F | Tukey CD (ml) | F | Tukey CD (%) |
| NaCl (mM) | |||||
| 75 | 27,284 | 9.34 | 2.66 | 7.99 | 29 |
| 150 | 27,286 | 10.86 | 3.12 | 11.42 | 31 |
| 300 | 27,286 | 15.84 | 1.50 | 13.13 | 18 |
| 450 | 27,293 | 14.95 | 0.74 | 15.70 | 9 |
| KCl (mM) | |||||
| 10 | 27,293 | 9.42 | 1.72 | 2.03 | 25 |
| 30 | 27,290 | 4.58 | 1.97 | 1.07 | 28 |
| 100 | 27,288 | 6.40 | 2.14 | 3.08 | 29 |
| 200 | 27,292 | 10.56 | 2.08 | 7.49 | 24 |
| 300 | 27,292 | 21.79 | 1.52 | 14.63 | 10 |
| CaCl2 (mM) | |||||
| 3 | 27,283 | 4.99 | 2.28 | 3.98 | 32 |
| 10 | 27,283 | 5.88 | 2.10 | 7.40 | 29 |
| 30 | 27,293 | 10.70 | 1.72 | 12.52 | 27 |
| 100 | 27,294 | 9.11 | 0.48 | 12.62 | 9 |
| NH4Cl (mM) | |||||
| 10 | 27,293 | 3.59 | 1.47 | 4.15 | 31 |
| 30 | 27,293 | 5.65 | 2.08 | 4.68 | 30 |
| 100 | 27,290 | 10.11 | 1.55 | 8.89 | 25 |
| 300 | 27,291 | 9.72 | 1.69 | 10.81 | 20 |
Notes: All analyses revealed significant differences at the p < .0001 level except for 10 mM KCl preference (p = .0022) and 30 mM KCl preference (p = .375). df, degrees of freedom; Tukey CD, critical difference score for Tukey post hoc tests using p < .01 as the criterion for significance. Differences between means (shown in Figs. 1–5) greater than the Tukey CD are significant at the p < .01 level.
Fig. 1.
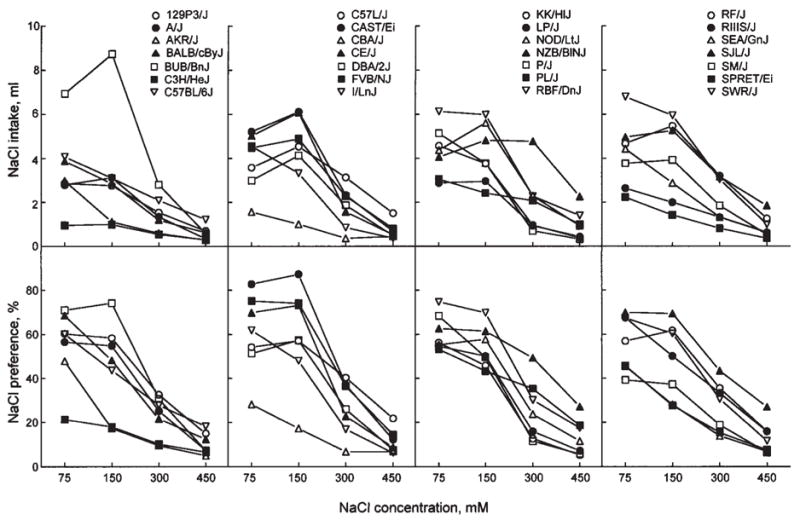
NaCl concentration-intake (top panels) and concentration-preference (bottom panels) functions for 28 strains of mice. Differences between strains larger than the Tukey’s critical difference (CD) given in Table II are significant.
Fig. 2.
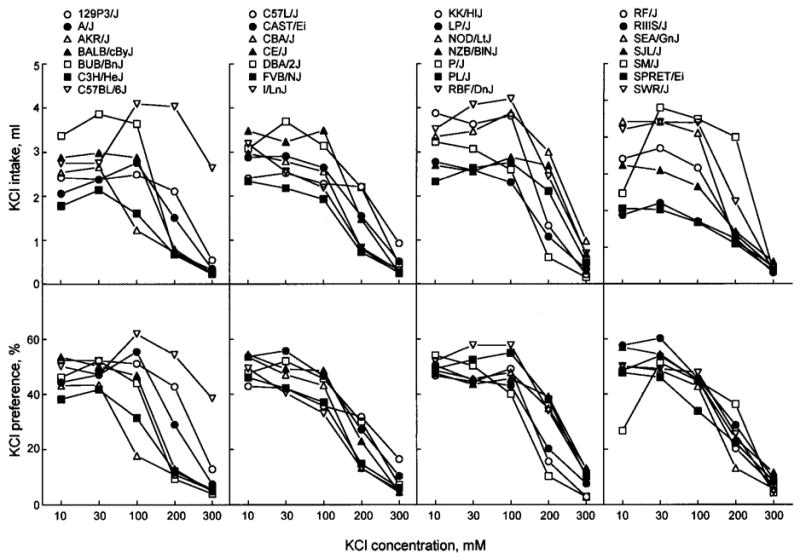
KCl concentration-intake (top panels) and concentration-preference (bottom panels) functions for 28 strains of mice. Differences between strains larger than the Tukey’s CD given in Table II are significant.
Fig. 3.
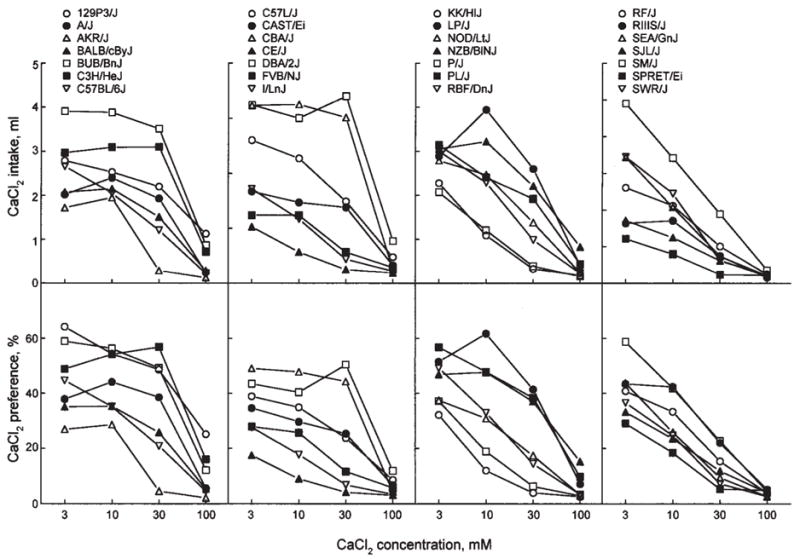
CaCl2 concentration-intake (top panels) and concentration-preference (bottom panels) functions for 28 strains of mice. Differences between strains larger than the Tukey’s CD given in Table II are significant.
Fig. 4.
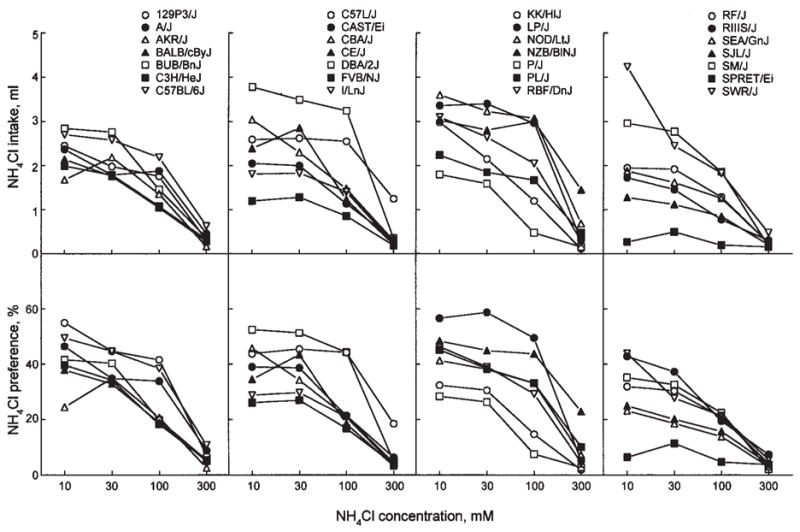
NH4Cl concentration-intake (top panels) and concentration-preference (bottom panels) functions for 28 strains of mice. Differences between strains larger than the Tukey’s CD given in Table II are significant.
Fig. 5.
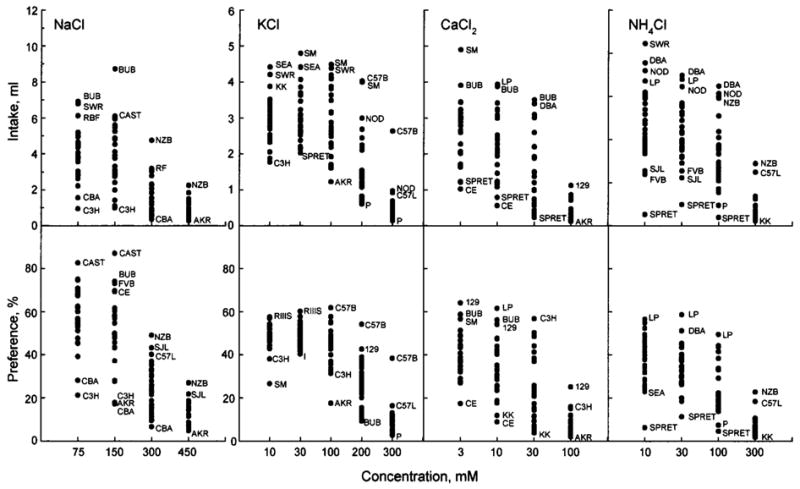
Strain distribution of intakes and preferences for each concentration of four taste solutions. Where possible, outlying points have been labeled with an abbreviated strain name. Differences between strains larger than the Tukey’s CD given in Table II are significant. Note that the scale for NaCl intake (top LH panel) is twice that of the other three mineral salt intakes.
For all minerals, mouse strains displayed a wide range of intakes and preference scores. As indicated by significant interactions between the effects of strain and concentration in the ANOVAs, patterns of strain distributions were affected by solution concentration.
NaCl
Most mouse strains were indifferent to, or moderately preferred, 75 and 150 mM NaCl, and they avoided 300 and 450 mM NaCl. Across all NaCl concentrations tested, the strongest avoidance and the lowest intakes were found in CBA/J, C3H/HeJ, and (except for 75 mM NaCl) AKR/J mice. For weaker (75 and 150 mM) NaCl solutions, CAST/Ei mice showed the strongest preferences (close to 90%). Intakes of these solutions were the highest in BUB/BnJ mice, which probably was affected by the high water consumption of this strain (Bachmanov et al., 2002). The highest preference scores and intakes of 300 mM NaCl were found in NZB/BINJ mice.
KCl
Most mouse strains were indifferent to 10–100 mM KCl, and they avoided 200 and 300 mM KCl. AKR/J mice had notably stronger avoidance and lower intake of 100 mM KCl compared with the rest of the strains. C57BL/6J mice had the highest preference scores for 100–300 mM KCl and the highest intakes of 300 mM KCl. For weaker KCl solutions, intakes by SM/J mice were similar to, or higher than, those of the C57BL/6J mice, but these high solution intakes by the SM/J mice are probably a consequence of their high customary fluid intakes (Bachmanov et al., 2002).
CaCl2
The 3 to 30 mM CaCl2 solutions were either neutral or aversive to mice. All strains exhibited avoidance of the strongest (100 mM) CaCl2 solution. Except for 30 mM CaCl2, the strain distributions were homogeneous. Preferences for 30 mM CaCl2 appeared to be dichotomous, with one group of strains being relatively indifferent (preference scores ranging from 37% to 57%), and the other group avoiding this solution (preference scores 4–26%; Fig. 5). 129P3/J mice displayed the weakest avoidance and the highest intakes of 100 mM CaCl2.
NH4Cl
The 10 to 100 mM NH4Cl solutions were either neutral, or aversive to mice. All strains exhibited avoidance of the strongest (300 mM) NH4Cl solution. SPRET/Ei mice had the lowest preference scores and intakes for 10–100 NH4Cl. NZB/B1NJ and C57L/J mice had the weakest avoidance and the highest intakes of 300 mM NH4Cl.
Heritability
Estimates of heritability were calculated based on the relationship of variation among the strains (representing the genetic component) to the variation within the strains (representing the environmental component; see Fig. 6). For each of the four minerals, heritabilities depended on concentration, with responses to more concentrated solutions being more strongly influenced by genetic factors. The highest levels of heritability were similar for all four minerals (~0.5 to 0.7), indicating that at least half of the variation in mineral consumption of this mouse population is genetically determined. At lower concentrations, estimates of heritability were higher for solution intakes than for preference scores. This was probably because when there is no strong preference or avoidance, solution intake is proportional to customary fluid consumption, and thus genetic differences in water intake contribute to solution intake, but they do not affect preference scores. This explanation is also consistent with the correlations between water intake and intakes (but not preferences) of weaker mineral solutions (Table I).
Fig. 6.
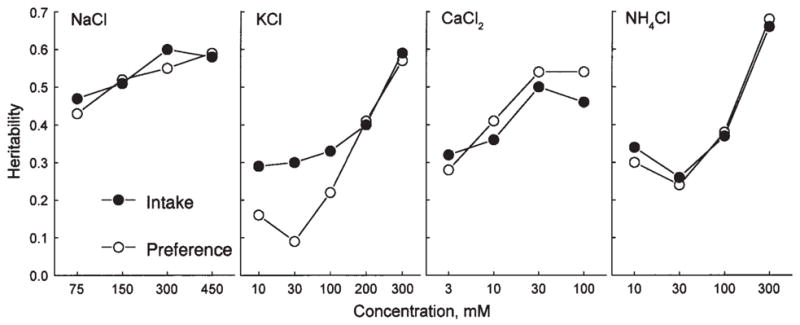
Heritability estimates for intakes and preferences for each concentration of four taste solutions. Heritability was calculated as a ratio SSamong strains/SStotal based on the sums of squares (SS) obtained in one-way ANOVAs for each concentration (Bachmanov et al., 2002).
Interrelationships among Mineral Solution Intakes and Preferences
In most cases, there were positive and significant correlations between intakes and preferences of the four or five concentrations of each mineral solution (Table III). In general, intake and preference of the closest concentrations of the same mineral were the most strongly correlated; as the difference between concentrations increased, the correlations became weaker. The weakest correlations were observed among KCl solutions (Table IIIb). This was probably due to the indifference of mice to the two weakest KCl concentrations, so that strain distributions for these solutions were more-or-less random for preferences and depended on customary fluid consumption for intakes and thus did not correlate with the preference or aversion responses to higher KCl concentrations. This is consistent with the low heritabilities of the dilute KCl solution intakes (Fig. 6) and with significant correlations between intake of these solutions and water intake (in the water-only test; Table I).
Table III.
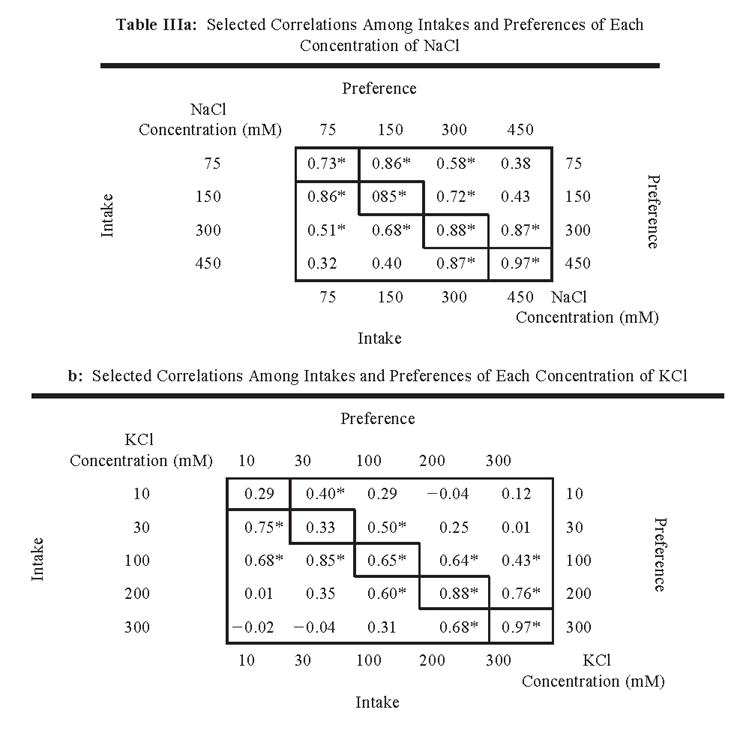
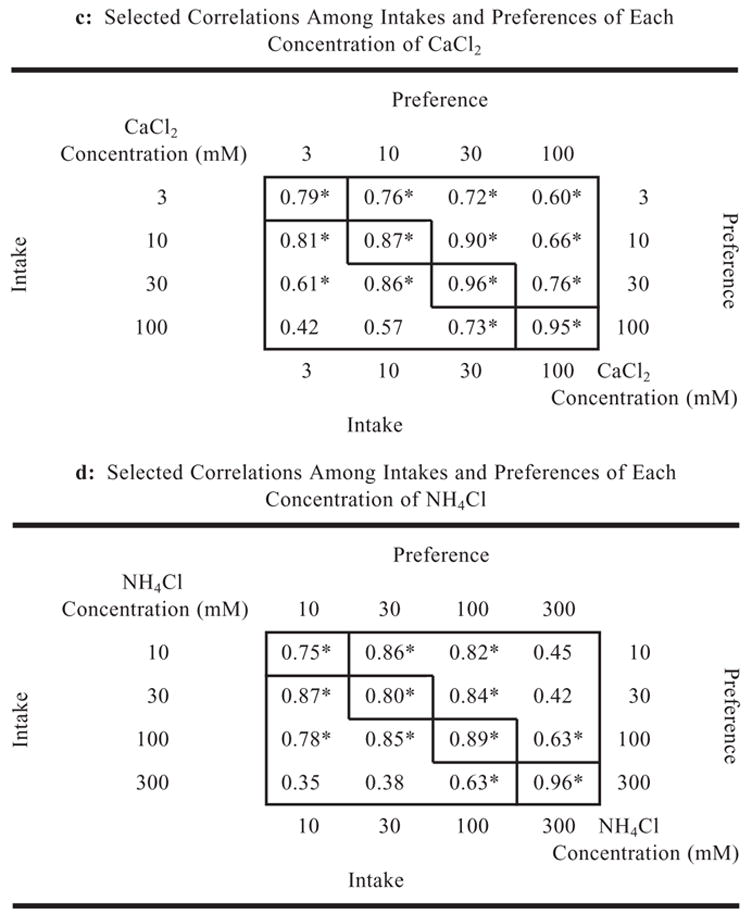
|
Notes: p < .01. The lower left of each table shows correlations between intakes. The upper right shows correlations between preferences. Values on the upper left-to-lower right diagonal show the correlation of intakes with preferences. The correlation matrix of all 123 measures collected for the 17 taste solutions tested is available on our website (Tordoff and Bachmanov).
For analysis of interrelationships among responses to different minerals, we used only preference scores because intakes may show relationships due to non-specific factors (e.g., customary fluid intake or body weight), whereas preference scores are independent of these factors and better represent responses specific to particular mineral solutions. We also excluded from the analysis 10 and 30 mM KCl solutions that evoked responses with low heritability (< 0.2). Because these solutions did not evoke obvious preference or aversion, the differences among strain means are probably randomly distributed and by chance may show a false positive relationship with another stimulus. The results of cluster analysis based on correlations among all the selected preference scores are presented in Figure 7. Consistent with the correlations among different concentrations of the same mineral, in most cases, the four or five concentrations of a mineral were clustered together (with the exception of 300 mM NH4Cl, which was more closely related with NaCl solutions than with the other NH4Cl concentrations). Each mineral could be divided into two subgroups of weaker and stronger concentrations: 75–150 mM and 300–450 mM for NaCl, 100 and 200–300 mM for KCl, 3–30 and 100 mM for CaCl2, and 10–100 and 300 mM for NH4Cl. This suggests that strain distributions for the lower and higher concentrations of the same mineral may be affected by different genetic factors.
Fig. 7.
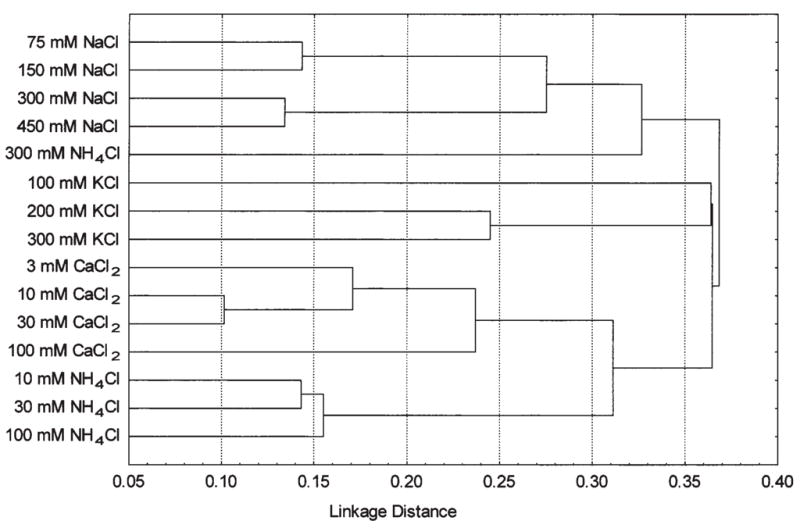
Tree diagram for salt solution preferences obtained using cluster analysis.
Responses to different minerals displayed only modest similarities, with preferences for CaCl2 and NH4Cl (10–100 mM) being the most closely related. The lack of close correspondence among preferences for different minerals is consistent with the responses of individual strains. For example, C3H/HeJ mice had low NaCl and KCl preferences, and high CaCl2 preferences; CE/J mice had high NaCl and low CaCl2 preferences; BUB/BnJ mice had high NaCl and CaCl2, and low KCl preferences; SJL/J mice had high NaCl and low NH4Cl preferences.
Multidimensional scaling yielded results similar to the cluster analysis (data not shown). The correlation matrix of all 123 measures collected for the 17 taste solutions tested is available on our website (Tordoff and Bachmanov).
DISCUSSION
This study compared the voluntary consumption of four mineral salt solutions (chlorides of sodium, potassium, calcium, and ammonium) by male mice from 28 strains. For each mineral solution, there was a wide range of intakes and preferences among the strains. This variation had a substantial genetic component. For most of the measures collected, the majority of strain means were continuously distributed but strains with deviating high or low intakes or preferences were also observed.
The results of this study are consistent with previously reported strain differences in NaCl consumption (Ninomiya et al., 1989; Lush, 1991; Bachmanov et al., 1998b; Kotlus and Blizard, 1998), with the exception that here we found smaller differences between 129P3/J and C57BL/6J strains compared with previous reports (Lush, 1991; Beauchamp and Fisher, 1993; Gannon and Contreras, 1993; Bachmanov et al., 1998b). This discrepancy could be due to the different substrains used (Tordoff, unpublished data) or differences in testing procedures that could affect NaCl preference (e.g., Beauchamp and Fisher, 1993; Bachmanov et al., 1998b, 1999).
The continuous patterns of strain distributions for consumption of all four minerals are consistent with multigenic controls of these traits, which would be expected of a complex behavior such as mineral solution intake. Several physiological mechanisms that can mediate strain differences in voluntary NaCl consumption have been suggested, including differences in gustatory neural responses to sodium and their sensitivity to amiloride (Ninomiya et al., 1989, 1996; Bernstein et al., 1991; Gannon and Contreras, 1993), sodium metabolism (Bachmanov et al., 1997), or the rennin-angiotensin system (Bachmanov et al., 1994). The other three minerals, KCl, CaCl2, and NH4Cl, also evoke taste sensations, and thus genetic differences in taste sensitivity could affect solution preference. Consumption of sodium, potassium, and calcium is regulated by specific appetites tied to homeostatic mechanisms, and thus genetic differences in these mechanisms may mediate the variation in voluntary consumption. Future genetic analyses of mineral consumption will unveil these mechanisms.
Associations among the responses to different minerals were only modest, suggesting distinct genetic controls of sodium, potassium, calcium and ammonium consumption. This is consistent with the existence of some common underlying mechanisms in responses to all these minerals, as well as the substantial role of factors that are unique to each mineral. One potential common mechanism may involve similarities in taste, as shown by similar patterns of behavioral and electrophysiological responses to NH4Cl, KCl, and CaCl2 in rodents under some conditions (e.g., Morrison, 1967; Smith et al., 1983; Frank, 1991), and high neural cross-adaptation among the three minerals (Smith and Frank, 1972). Of course, the associations in long-term, two-bottle choice tests, such as those used in this experiment, could also be mediated by postingestive, motivational, and/or cognitive controls.
The weak association between the avidity for NaCl and the other three minerals argues against the hypothesis that animals use saltiness (or NaCl-like taste) to recognize and direct consumption of other minerals (Schulkin, 1991a; 1991b).
NH4Cl is commonly used as a standard stimulus for normalization of gustatory taste responses in electrophysiological experiments. Our data suggest that this practice requires caution when comparing mouse strains, because some strains differ greatly in NH4Cl intake and preference and thus may differ in their gustatory neural responses to NH4Cl.
These results provide a valuable resource for investigators who wish to design mutagenesis screens or choose strains for positional cloning of underlying genes. However, at least two cautions are worth mentioning. First, many environmental factors can influence taste solution intake, and many of these probably interact with genetic factors. There may be subtle differences in laboratory environments that could produce large differences in mouse behavior (e.g., Crabbe et al., 1999). Second, given the enormous number of comparisons conducted, it is likely that some of the differences found here are due to chance. To some extent, this is ameliorated by the generally similar results found with different concentrations of the same taste solution but, even so, there is still the possibility that some significant differences may be erroneous. It will require replication of critical comparisons under other laboratory conditions to eliminate these possibilities.
Two-bottle preference tests are an easy, efficient, and reliable method to measure voluntary taste solution consumption by mice. Strain differences in mineral consumption can reflect variations in taste perception or in underlying physiological or pathological processes. The data presented here provide information necessary to further the goal of identification of these mechanisms.
Acknowledgments
This research was supported by NIH grants DC-03853 (A. A. B.), AA-12715 (M. G. T.), and DK-46791 (M. G. T.). We thank Jessica Santo and Maria Theodorides for technical assistance. Raw data from this study are available on-line: Tordoff, M. G., and Bachmanov, A. A. Strain survey of voluntary mineral solution intake, accession no. MPD:61. Mouse Phenome Database, The Jackson Laboratory, Bar Harbor, ME (URL: http://www.jax.org/phenome).
Footnotes
Edited by Stephen Maxson
References
- Adam WR, Dawborn JK. Effect of potassium depletion on mineral appetite in the rat. J Comp Physiol Psychol. 1972;78:51–58. doi: 10.1037/h0032183. [DOI] [PubMed] [Google Scholar]
- Bachmanov AA. The salt appetite of rats with spontaneous arterial hypertension. Fiziol Zh SSSR (in Russian) 1989;75:942–947. [PubMed] [Google Scholar]
- Bachmanov AA. The genetic analysis of Na and K appetites in hybrids between SHR and WKY rat strains (Abstract) Appetite. 1993;21:162. [Google Scholar]
- Bachmanov AA, Inoue M, Ninomiya Y, Beauchamp GK. Modification of behavioral and neural taste responses to NaCl in C57BL/6 mice: Effects of NaCl exposure and DOCA treatment. Physiol Behav. 1999;65:817–822. doi: 10.1016/s0031-9384(98)00239-x. [DOI] [PMC free article] [PubMed] [Google Scholar]
- Bachmanov AA, Reed DR, Beauchamp GK, Tordoff MG. Food intake, water intake, and drinking spout side preference of 28 mouse strains. Behav Genet. 2002;32:435–443. doi: 10.1023/a:1020884312053. [DOI] [PMC free article] [PubMed] [Google Scholar]
- Bachmanov AA, Reed DR, Tordoff MG, Price RA, Beauchamp GK. Nutrient preference and diet-induced adiposity in C57BL/6ByJ and 129P3/J mice. Physiol Behav. 2001;72:603–613. doi: 10.1016/s0031-9384(01)00412-7. [DOI] [PMC free article] [PubMed] [Google Scholar]
- Bachmanov AA, Schlager G, Tordoff MG, Beauchamp GK. Consumption of electrolytes and quinine by mouse strains with different blood pressures. Physiol Behav. 1998a;64:323–330. doi: 10.1016/s0031-9384(98)00069-9. [DOI] [PMC free article] [PubMed] [Google Scholar]
- Bachmanov AA, Tordoff MG, Beauchamp GK. Ethanol consumption and taste preferences in C57BL/6ByJ and 129/J mice. Alcohol Clin Exp Res. 1996;20:201–206. doi: 10.1111/j.1530-0277.1996.tb01630.x. [DOI] [PMC free article] [PubMed] [Google Scholar]
- Bachmanov AA, Tordoff MG, Beauchamp GK. Voluntary sodium chloride consumption by mice: Differences among five inbred strains. Behav Genet. 1998b;28:117–124. doi: 10.1023/a:1021471924143. [DOI] [PMC free article] [PubMed] [Google Scholar]
- Bachmanov AA, Tordoff MG, Ninomiya Y, Inoue M, Schlager G, Beauchamp GK. Genetic differences in NaCl intake in inbred mouse strains: taste, learning and metabolism (Abstract) XXXIII International Congress of Physiological Sciences. 1997:P099.03. [Google Scholar]
- Bachmanov AA, Whittlestone TH, Fitzsimons JT. The enhanced sodium appetite of spontaneously hypertensive (SH) rats depends on angiotensin (Abstract) J Physiol (Lond) 1994;480:85P. [Google Scholar]
- Beauchamp GK, Engelman K. High salt intake. Sensory and behavioral factors. Hypertension. 1991;17:I176–I181. doi: 10.1161/01.hyp.17.1_suppl.i176. [DOI] [PubMed] [Google Scholar]
- Beauchamp GK, Fisher AS. Strain differences in consumption of saline solutions by mice. Physiol Behav. 1993;54:179–184. doi: 10.1016/0031-9384(93)90063-l. [DOI] [PubMed] [Google Scholar]
- Bernstein IL, Longley A, Taylor EM. Amiloride sensitivity of chorda tympani response to NaCl in Fischer 344 and Wistar rats. Am J Physiol. 1991;261:329–333. doi: 10.1152/ajpregu.1991.261.2.R329. [DOI] [PubMed] [Google Scholar]
- Catalanotto F, Schechter PJ, Henkin RJ. Preference for NaCl in the spontaneously hypertensive rat. Life Sci. 1972;11(Pt 1):557–564. doi: 10.1016/0024-3205(72)90190-7. [DOI] [PubMed] [Google Scholar]
- Crabbe JC, Wahlsten D, Dudek BC. Genetics of mouse behavior: interactions with laboratory environment. Science. 1999;284:1670–1672. doi: 10.1126/science.284.5420.1670. [DOI] [PubMed] [Google Scholar]
- Denton D. The hunger for salt: An anthropological, physiological and medical analysis. Springer-Verlag; Berlin: 1984. [Google Scholar]
- DiNicolantonio R, Mendelsohn FAO, Hutchinson JS. Sodium chloride preference of genetically hypertensive and normotensive rats. Am J Physiol. 1983;245:R38–R44. doi: 10.1152/ajpregu.1983.245.1.R38. [DOI] [PubMed] [Google Scholar]
- Eckert J. Further observations on the calcium appetite of parathyroidectomized rats. Am J Physiol. 1938;123:59. [Google Scholar]
- Ely DE, Thoren P, Wiegand J, Folkow B. Sodium appetite as well as 24-h variations of fluid balance, mean arterial pressure and heart rate in spontaneously hypertensive (SHR) and normotensive (WKY) rats, when on various sodium diets. Acta Physiol Scand. 1987;129:81–92. doi: 10.1111/j.1748-1716.1987.tb08043.x. [DOI] [PubMed] [Google Scholar]
- Ferrell F, Dreith AZ. Calcium appetite, blood pressure and electrolytes in spontaneously hypertensive rats. Physiol Behav. 1986;37:337–343. doi: 10.1016/0031-9384(86)90243-x. [DOI] [PubMed] [Google Scholar]
- Ferrell F, Gray SD. Longitudinal study of salt preferences in normotensive and hypertensive rats. Hypertension. 1985;7:326–332. [PubMed] [Google Scholar]
- Frank ME. Taste-responsive neurons of the glossopharyngeal nerve of the rat. J Neurophys. 1991;65:1452–1463. doi: 10.1152/jn.1991.65.6.1452. [DOI] [PubMed] [Google Scholar]
- Fregly M. NaCl intake and preference threshold of spontaneously hypertensive rats. Proc Soc Exp Biol Med. 1975;149:915–920. doi: 10.3181/00379727-149-38926. [DOI] [PubMed] [Google Scholar]
- Gannon K, Contreras RJ. Sodium intake linked to amiloride-sensitive gustatory transduction in C57BL/6J and 129/J mice. Physiol Behav. 1993;57:231–239. doi: 10.1016/0031-9384(94)00279-e. [DOI] [PubMed] [Google Scholar]
- Kotlus BS, Blizard DA. Measuring gustatory variation in mice: A short-term fluid-intake test. Physiol Behav. 1998;64:37–47. doi: 10.1016/s0031-9384(98)00016-x. [DOI] [PubMed] [Google Scholar]
- Lobaugh B, Joshua IG, Mueller WJ. Regulation of calcium appetite in broiler chickens. J Nutr. 1981;111:298–306. doi: 10.1093/jn/111.2.298. [DOI] [PubMed] [Google Scholar]
- Lush IE. The genetics of bitterness, sweetness, and saltiness in strains of mice. In: Wysocki CJ, Kare MR, editors. Genetics of Perception and Communication. Marcel Dekker; New York: 1991. pp. 227–241. [Google Scholar]
- McBurney DH, Shick TR. Taste and water taste of twenty-six compounds for man. Percep Psychophysics. 1971;10:249–252. [Google Scholar]
- Midkiff EE, Bernstein IL. The influence of age and experience on salt preference of the rat. Dev Psychobiol. 1983;16:385–394. doi: 10.1002/dev.420160504. [DOI] [PubMed] [Google Scholar]
- Midkiff EE, Fitts DA, Simpson JB, Bernstein IL. Absence of sodium chloride preference in Fischer-344 rats. Am J Physiol. 1985;249:R438–R442. doi: 10.1152/ajpregu.1985.249.4.R438. [DOI] [PubMed] [Google Scholar]
- Milner P, Zucker I. Specific hunger for potassium in the rat. Psych Sci. 1965;2:17–18. [Google Scholar]
- Morrison GR. Behavioral response patterns to salt stimuli in the rat. Can J Psychol. 1967;21:141–152. [Google Scholar]
- Ninomiya Y, Fukami Y, Yamazaki K, Beauchamp GK. Amiloride inhibition of chorda tympani responses to NaCl and its temperature dependency in mice. Brain Res. 1996;708:153–158. doi: 10.1016/0006-8993(95)01218-4. [DOI] [PubMed] [Google Scholar]
- Ninomiya Y, Sako N, Funakoshi M. Strain differences in amiloride inhibition of NaCl responses in mice, Mus musculus. J Comp Physiol Psychol A. 1989;166:1–5. doi: 10.1007/BF00190204. [DOI] [PubMed] [Google Scholar]
- Rowland NE, Fregly MJ. Sodium appetite: species and strain differences and role of renin-angiotensin-aldosterone system. Appetite. 1988;11:143–178. doi: 10.1016/s0195-6663(88)80001-1. [DOI] [PubMed] [Google Scholar]
- Rowland NE, Fregly MJ. Thirst and sodium appetite in Dahl rats. Physiol Behav. 1990;47:331–335. doi: 10.1016/0031-9384(90)90151-s. [DOI] [PubMed] [Google Scholar]
- Schiffman SS, Erickson RP. A psychophysical model for gustatory quality. Physiol Behav. 1971;7:617–633. doi: 10.1016/0031-9384(71)90117-x. [DOI] [PubMed] [Google Scholar]
- Schulkin J. Innate, learned and evolutionary factors in the hunger for salt. In: Friedman MI, Tordoff MG, Kare MR, editors. Chemical Senses: Appetite and Nutrition. Marcel Dekker; New York: 1991a. [Google Scholar]
- Schulkin J. Sodium hunger: The search for a salty taste. Cambridge University Press; Cambridge: 1991b. [Google Scholar]
- Scott EM, Verney EL, Morissey PD. Self selection of diet. XI. Appetites for calcium, magnesium and potassium. J Nutr. 1950;41:187–202. doi: 10.1093/jn/41.2.173. [DOI] [PubMed] [Google Scholar]
- Smith DV, Frank M. Cross adaptation between salts in the chorda tympani nerve of the rat. Physiol Behav. 1972;8:213–220. doi: 10.1016/0031-9384(72)90363-0. [DOI] [PubMed] [Google Scholar]
- Smith DV, Van Buskirk RL, Travers JB, Bieber SL. Gustatory neuron types in hamster brain stem. J Neurophysiol. 1983;50:522–540. doi: 10.1152/jn.1983.50.2.522. [DOI] [PubMed] [Google Scholar]
- Tordoff MG. Influence of dietary calcium on sodium and calcium intake of spontaneously hypertensive rats. Am J Physiol. 1992a;262:R370–R381. doi: 10.1152/ajpregu.1992.262.3.R370. [DOI] [PubMed] [Google Scholar]
- Tordoff MG. Salt intake of rats fed diets deficient in calcium, iron, magnesium, phosphorus, potassium, or all minerals. Appetite. 1992b;18:29–41. doi: 10.1016/0195-6663(92)90208-n. [DOI] [PubMed] [Google Scholar]
- Tordoff MG. The importance of calcium in the control of salt intake. Neurosci Biobeh Rev. 1996;20:89–99. doi: 10.1016/0149-7634(95)00051-f. [DOI] [PubMed] [Google Scholar]
- Tordoff MG. Calcium: taste, intake and appetite. Physiol Rev. 2001;81:1567–1597. doi: 10.1152/physrev.2001.81.4.1567. [DOI] [PubMed] [Google Scholar]
- Tordoff MG, Bachmanov AA. Monell Chemical Senses Center; Philadelphia, PA: Monell Mouse Taste Phenotyping Project. http//;www.monell.org/MMTPP/ [Google Scholar]
- Tordoff MG, Hughes RL, Pilchak DM. Calcium intake by the rat: Influence of parathyroid hormone, calcitonin, and 1,25-dihydroxyvitamin D. Am J Physiol. 1998;274:R214–R231. doi: 10.1152/ajpregu.1998.274.1.R214. [DOI] [PubMed] [Google Scholar]
- Wolf G, Dahl LK, Miller NE. Voluntary sodium chloride intake of two strains of rats with opposite genetic susceptibility to experimental hypertension. Proc Soc Exp Biol Med. 1965;120:301–305. doi: 10.3181/00379727-120-30517. [DOI] [PubMed] [Google Scholar]
- Yongue BG, Myers MM. Further evidence for genetic independence of blood pressure and salt appetite in spontaneously hypertensive and wistar-kyoto rats. Clin Exp Hypertens Part A Theory Pract. 1989;A11:25–33. doi: 10.3109/10641968909035288. [DOI] [PubMed] [Google Scholar]
- Zucker I. Short-term salt preference of potassium-deprived rats. Am J Physiol. 1965;208:1071–1074. doi: 10.1152/ajplegacy.1965.208.6.1071. [DOI] [PubMed] [Google Scholar]