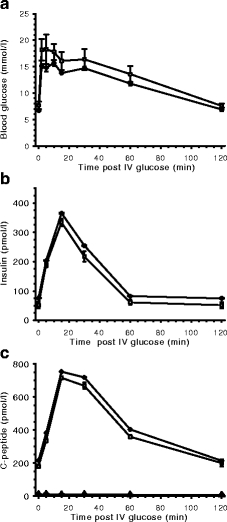
Fig. 5.

Plasma glucose (a), insulin (b) and C-peptide (c) levels after IVGTT. IVGTTs remained normal for animals maintained for 500 days (data not shown). White squares, HMD/INS-FUR-treated animals (60 days) expressing human insulin and human C-peptide; black diamonds, normal control animals expressing rat insulin and rat C-peptide; black triangles, rat C-peptide in HMD/INS-FUR-treated animals. Values are means±SEM (n = 5)
