

Abstract
In this report, we describe the Automated Epidemiological Geotemporal Integrated Surveillance system (AEGIS), developed for real-time population health monitoring in the state of Massachusetts. AEGIS provides public health personnel with automated near-real-time situational awareness of utilization patterns at participating healthcare institutions, supporting surveillance of bioterrorism and naturally occurring outbreaks. As real-time public health surveillance systems become integrated into regional and national surveillance initiatives, the challenges of scalability, robustness, and data security become increasingly prominent. A modular and fault tolerant design helps AEGIS achieve scalability and robustness, while a distributed storage model with local autonomy helps to minimize risk of unauthorized disclosure. The report includes a description of the evolution of the design over time in response to the challenges of a regional and national integration environment.
Introduction and Background
Real-time health surveillance systems are being deployed at local, state and national levels to provide public health decision-makers with the information they need to detect adverse health events, maintain situational awareness, and manage outbreak investigation and response. 1–3
A strong push is currently underway for regional and national integration of these systems. 4–6 The American Health Information Community (AHIC) 7 and the Office of the National Coordinator for Health Information Technology (ONC) have recently published a Harmonized Use Case for Biosurveillance, 8 which focuses on the functional requirements for communication between the systems of different organizations participating in a surveillance effort. Similarly, The Healthcare Information Technology Standards Panel (HITSP) established by the American National Standards Institute is working to define a widely accepted set of standards that enable widespread interoperability among healthcare software applications. 9 Additional guidelines relating to surveillance systems have also been released by CDC. 6, 10
A system functioning in an integrated environment must scale to handle new data sources, be robust to frequent communication failures between it and distributed data sources, and ensure that data remain secure even when stored in a distributed fashion. This report describes the Automated Epidemiological Geotemporal Integrated Surveillance (AEGIS) system, developed for real-time population health monitoring in the state of Massachusetts. In presenting the design objectives, system description, status report, and discussion below, we place a particular focus on how AEGIS responds to the challenges presented by an environment of regional and national integration.
Design Objectives
The objective of the AEGIS system is to provide public health personnel with automated near-real-time situational awareness of utilization patterns at participating healthcare institutions. This includes both the reporting of visit rates categorized by hospital and syndrome group, as well as the detection of temporal and spatiotemporal visit clusters. In performing these functions, the AEGIS system is intended to support the ongoing surveillance of bioterrorism and naturally occurring outbreaks.
Biosurveillance systems 11–13 being deployed in a variety of different contexts locally, 11, 12 nationally 13, 14 and around the world, 15–17 face a variety of challenges. Many of these challenges are described in detail elsewhere, and we do not focus on describing them here—these include interoperability and standards compliance, 4, 10 high quality aberration detection with high sensitivity and specificity, 18, 19 and good detection timelines, 20, 21 among others. In this paper, we place particular focus on the design objectives of scalability, robustness and data security.
Scalability
The system must be able to scale across data sources, analytical methods, and users, particularly within the context of large integrated surveillance efforts. Today’s biosurveillance systems monitor a wide range of traditional 22–24 and non-traditional 25–27 data types and must scale gracefully to incorporate new data sources. They must also scale to incorporate a growing range of complementary modeling and detection approaches. 28–31 Furthermore, as systems grow, the functionality must also be extended to meet the needs of different end-users.
Robustness through Fault Tolerance
Problems in data delivery can arise anywhere along the chain of communication between data sources and a surveillance system. As systems grow in size and complexity, the risk of data delivery delays and failures increases, and robustness to these effects becomes critical. Robustness means ensuring not only that the system continues to run in the wake of data failures or delays, but also that it continues to provide meaningful information to its users. Failures may also occur with the execution of analytical methods, though this is less likely if the appropriate software testing is done before deployment.
Data Security
The risk of unauthorized disclosure of private information grows with the number of individuals and organizations participating in a surveillance system. Not only does a larger amount of data present a more attractive target for would-be data thieves, but more users means more potential misusers of a system. As a result of the increased risk, participating organizations may become more conservative with how much data they allow to be shared, compromising the effectiveness and capabilities of the system. Furthermore, a breach in data security would likely cause organizations to understandably reconsider their participation in the surveillance effort, particularly when participation is voluntary.
System Description
The AEGIS system follows a five-stage framework for electronic public health surveillance (▶). First, daily visit data from 12 Emergency Department facilities across Massachusetts are collected, anonymized and classified. Second, the historical models are constructed for total daily visit counts for each syndrome group at each health facility. Third, the system compares current visit levels with those predicted by the historical models and generates alarms if unusual temporal and spatiotemporal aberrations are detected. Fourth, the system communicates visit and alarms information to users through a number of interfaces; and finally, the users may investigate the alarm using authorized client agents. Once initial investigation is complete, the appropriate public health response can then be initiated. This may include any of the following: no further action, further investigation, prophylaxis, containment, facilities closures, and issuing public health warnings and advisories to health providers and/or the general public.
Figure 1.
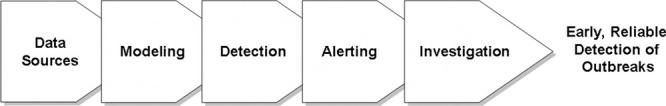
A five-stage framework for electronic public health surveillance.
Modular System Design
The AEGIS system has a modular design which enables it to scale across new data sources, analytical methods and users. This scalability is especially useful in the context of ongoing regional integration efforts, where new data sources and analysis methods must be added to the system. While this modularity requires greater development time and effort, in the long run it is less complicated to add components to the system.
AEGIS consists of a central database and a series of managers (▶), each implementing a different stage of the framework described above. Each manager can have any number of modules, allowing for easy scalability. For simplicity, three sample modules are shown for each manager, while the actual modules implemented in the current AEGIS system are shown in ▶ (excluding source manager modules, of which there is one for each data source). The database and each of the managers is now described in turn.
Figure 2.

A system diagram of AEGIS showing the different managers, with three sample modules shown for each manager. Each manager can handle any number of modules, making for easy system scalability.
Figure 3.
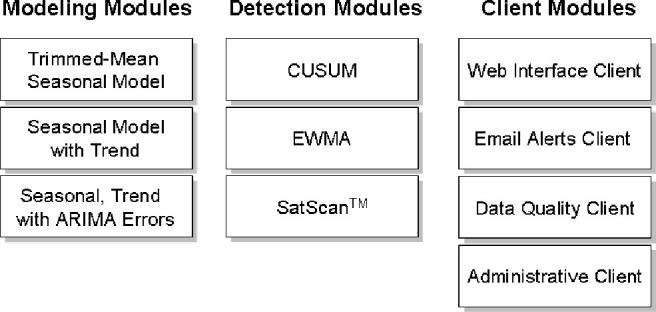
List of specific modeling, detection and client modules implemented in the current AEGIS system, excluding source manager modules, of which there is one for each data source. CUSUM—cumulative sum; EWMA—Exponentially Weighted Moving Average; SaTScan—Space and Time Scan spatiotemporal scan statistic tool. 30
The Central Database stores all the information produced by the system, including predictions and alarms data for each data source. It runs on an Oracle 10 installation behind a secure institutional firewall, and is managed by a team of dedicated in-house DBAs who provide 24/7 support. The managers in the AEGIS system access the database through a secure servlet layer using secure SOAP calls.
The Source Manager handles the reading and processing of data from external data sources. Data from each external data source (S1–S3 in ▶) are passed through a preprocessing module (P1–P3), which handles anonymization, geocoding and syndromic classification. Data sources are transparently accessed using the SPIN protocol for distributed storage, 32, 33 described below. Since the operation of each data interpretation module is self-contained and strictly defined, the addition of new data sources is straightforward.
The Modeling Manager creates historical models for each data source and generates expected values for the data currently being monitored. Each modeling module (M1–M3) executes a different modeling and prediction approach. For example, one uses a trimmed-mean seasonal model incorporating both day-of-week and day-of-year effects, while another includes a more complex modeling approach that includes ARIMA correction of model errors. 28 Both approaches can be used to model the daily visit rates of different syndrome groups at the hospitals being monitored. We have found ARIMA to be a more accurate approach to predictive modeling. The modular design allows for the easy addition and selection of new modeling methods.
The Detection Manager interprets the observed values in light of the expected values and generates alarms as appropriate. Each individual alarming module (D1–D3) implements a different alarming approach. For example, one alarming module uses a seven-day exponential temporal filter to identify temporal alarms. 21 Another alarming module uses SaTScan cluster detection 30 to identify spatial alarms—since the complete SaTScan tool is incorporated into the system as one whole, this particular alarming module includes the modeling component as well. Here too, the modular design allows for the straightforward addition of new alarming approaches.
The Client Manager securely interacts and communicates with authorized users through clients (C1–C3). All communication with the users takes place through these clients. Strict role-based access controls ensure that each party sees only the information that it has rights to see.
The AEGIS Web Client includes a geographical view showing the relevant temporal and spatial alarms, together with a time series view showing recent visit levels in temporal context (▶). Alarms are overlaid on a geographical display using the Google Maps™ API, without sending any information out to the Google Maps server. It utilizes Asynchronous JavaScript and XML (AJAX) technology to increase responsiveness to user actions and improve overall user experience.
Figure 4.

A screenshot of the AEGIS Web Client, showing visit totals for different hospitals, syndrome groups, and time periods, as well as a spatial alarm (yellow circle). The red rectangle shows the severity of the alarm and is centered on the alarming facility.
The AEGIS Email Alert Client sends out alarm-related information by email. This “push” approach complements the “pull” approach of the AEGIS Web Client. This client can also be extended to send out notifications over other communication channels, such as fax, SMS, etc. It can also be integrated through standard web service calls with existing health alerting information systems, such as the Health Alert Network of the Massachusetts Department of Public Health.
The AEGIS Data Quality Client monitors the health and performance of the data source feeds and other key system functions in real time, helping system administrators identify and diagnose any data transmission problems or failures in real time.
The AEGIS Administrative Client allows the configuration of the individual modules (data sources, modeling methods, alarming approaches, and clients) used in each of these stages. This enables the easy addition and setup of new modules. The modular nature of the system is thus exploited to increase scalability by making it easy to add new components.
Fault Tolerance
The AEGIS system includes a fault tolerant design to increase robustness to the endemic problems of data integrity, data transmission, and inter-module coordination, which become more critical as systems move towards regional and national integration. While this requires greater development time and effort, the increase in reliability means that less effort is expended dealing with failures in the long term. The design features include measures to increase data integrity, minimize data transmission problems, and increase inter-module coordination:
Data Integrity may be compromised in many ways, including record duplication, improper formatting, and outdated records. Preprocessing modules check for and remove duplication, and also “clean” received data, including ICD-9 diagnostic codes, to ensure that they conform to the required format. The source manager also processes updates to visit records, so that the latest information available is available to the system. The modeling and detection managers check to see if data for the previous two weeks has been updated and retroactively update predictions and alarms accordingly with the new visit data.
Data Transmission—In order to deal with inevitable failures in data transmission, timestamps are stored for each value in the database; thus, in the event of a data transmission failure, all other modules in the system are able to recognize the fact that data is missing. Each module of the system “expects” failure on the part of other modules and therefore makes no assumptions about the successful completion of other modules’ tasks. In the case of missing data, a detection module will continue to operate, but will communicate as part of its output that the results are based on missing or partial data. In addition, the user is notified whether data is missing for a particular day or whether the modeling or detection modules have not yet processed data for that day. When a modeling module fitting a historical model finds missing values in the historical data, this missing data is imputed, using an average of the same day in the previous and following weeks. Other systems have also dealt with data transmission issues.
Inter-module Coordination—Modules “expect” that other modules may take longer than expected to perform a given task. With a rigid module scheduling system, an alarm might detect missing data because a prediction that was expected to take 30 minutes to run instead took 40. To increase the robustness of inter-module coordination and the efficiency of the system as a whole, a messaging capability was built into the system, shown as dashed lines in ▶. This messaging architecture allows the source manager to be notified when new data has entered the system. Upon noticing that new visits have been received, the source manager triggers the modeling manager, which upon completing its processing, triggers the detection manager to analyze the data. Each manager propagates the message down to its individual modules, which verify the data and then process it. The messaging architecture maintains the isolation of data streams, by hospital and syndrome, and each model or alarm is only triggered when relevant messages arrive. Thus, failure to receive data for one hospital does not prevent predictions and alarms from being computed for other hospitals. Similarly, a lack of visits for a given syndrome at a hospital does not prevent the analysis of other syndromes at that hospital.
Data Security
Data in AEGIS is stored in a distributed fashion at the various institutions that generate it. All control over access to information is maintained by its local owners—i.e., each local facility decides who may access which data, and can limit or restrict this access at any time. In a regional or national integration environment, this ability to maintain local control is critical.
Under the distributed storage model, the AEGIS server communicates with external data sources using the SPIN local autonomy framework. A brief description of SPIN is provided here. A more detailed description is provided in. 33 SPIN was originally designed to provide researchers access to information about archived tissue specimens in multiple institutions across the nation while allowing institutions to maintain local control of the data. 32 SPIN has since been generalized into a peer-to-peer data sharing framework that combines distributed data storage with local institutional autonomy over access to that data. 33
Each hospital runs a piece of software locally that allows it to become a node on the SPIN network. The hospital configures its SPIN node with the desired disclosure policies that determine which types of data requests are accepted automatically, which require manual approval, and which are always rejected for various levels of authorization. Each organization remains in control over patient disclosures in accordance with its data sharing policies. In order to obtain data from a particular hospital, credentialed AEGIS clients query the spin network and receive aggregated responses within three to five seconds.
AEGIS can be operated in three modes, Standard, Investigation, and Emergency, each providing increased levels of security clearance and access. Standard mode provides access only to highly anonymized data. For each visit, only four fields are sent: the time of the visit; the general syndrome category; an anonymized approximate geographical location for the patient, in which patient location is randomly and irreversibly modified (“blurred”) to prevent identification while preserving general area, allowing geospatial cluster detection to be performed; 34 and an anonymized, randomly generated ID, which allows re-identification of the patient only under the appropriate authorized circumstances. While this anonymized information is available to the system, none of it is exposed to the user; the user sees only aggregate visit data in standard mode.
Investigation mode, accessed through a second level password, allows users to request further anonymized details about a specific group of visits. For example, the user may see the list of visits involved in that alarm including the age and gender of the patients; the diagnostic codes, chief complaints and doctor’s notes related to the visit; and the disposition of the visit (admitted to hospital, released, transferred). While all this information is anonymized, it still provides the user with additional information about the visits which can be valuable in deciding how to proceed. Emergency mode is accessed through a third-level password which allows the user to issue a special request for information using the anonymized linkage identifier. If the hospital approves it, the patient’s contact information is returned. It should be emphasized that this identifiable information is only available to authorized public health personnel through three levels of passwords protection, and only in specific cases where the hospital’s chosen access policies expressly approves this request, as described below.
As an example, a hospital may choose to automatically approve authorized requests for information needed in Standard mode, and require manual approval for Investigate mode and Emergency mode requests.
Comparison with RODS and ESSENCE
We now compare the design of AEGIS with that of the RODS 11–12 and ESSENCE II 13 systems. For modeling and detection, the RODS system utilizes the What’s Strange About Recent Events (WSARE 1.0) algorithm, as well as a Recursive-Least-Square (RLS) adaptive filter, 11 while ESSENCE II uses an autoregressive linear regression modeling method, an Exponentially Weighted Moving Average (EWMA) statistical process control method, as well as a zip-code resolution multivariate spatial scan statistic. 13 The modeling and detection stages are combined in the descriptions of RODS and ESSENCE., while in AEGIS they are explicitly separated. Regarding user interface, while all functions are integrated into one screen in AEGIS, RODS shows geographic and temporal information on different screens (EPIPLOT and MAPPLOT), 11 and ESSENCE II also has different screens for these functions. 13 RODS also has email and pager alerting capabilities, with a link to a set of graphs describing the alert. 11
Regarding data integrity, in the RODS system, data are checked for duplicate records, and HL7 scheduling messages with future dates are filtered out. 35 Similarly, in the Biosense system, de-duplication methods are used to remove duplicate records that have already been transmitted. 13 Regarding data transmission, if the database goes off-line in the RODS system, HL7 listeners continue to receive messages and temporarily store the messages for later storage in the database. Furthermore, if data is not received for six hours, an alert is sent to the RODS administrator and the sending health system’s administrator. Finally, all transactions are logged to ensure that the database can recover from a system failure. 35
The minimal dataset in RODS includes age, gender, zipcode and chief complaint. 11 While SPIN stores data in a distributed fashion, RODS receives de-identified HL7 messages sent by participating hospitals and stores the data in one central location. 11 ESSENCE II also stores data centrally. 13
Status Report
AEGIS has been in continuous operation and development by the Children’s Hospital Informatics Program at the Harvard-MIT Division of Health Sciences and Technology since 2000. The design of the AEGIS system has evolved over time in response to the requirements for regional and national integration. AEGIS was conceived under bioterrorism funding from the Agency for Healthcare Research and Quality and subsequently adapted for the Massachusetts Department of Pubic Health (MA-DPH). Since then, in response to the NHIN requirements, the system has scaled up to include more data sources (both adult and pediatric facilities) and more users. It has also scaled to include more modeling methodologies. This scaling was enabled primarily through its modular, fault-tolerant design.
Data use agreements exist between the MA-DPH, the participating Massachusetts hospitals and Children’s Hospital Boston (CHB), which serves as AEGIS’s home institution. The project began as a research project at CHB, and has been operating under IRB approval since it began. A scientific team and software engineering team work in tandem to develop and implement new technologies and methodologies.
AEGIS is used actively by the MA-DPH, where a specially designated team is responsible for reviewing alerts. When an alert seems worthy of follow-up, it is passed on to a general epidemiologist for further investigation. Relevant information regarding alerts and notifications are posted on the Massachusetts Homeland Alert Network (HAN), a state-wide public health information system. Notification of new postings is provided through the HAN via email, phone or beeper to the relevant individuals at the MA-DPH. For the two weeks following an alert, MA-DPH personnel pay special attention to the data streams which triggered the alert.
In January 2007, AEGIS was an integral component of one of four consortia funded by the Department of Health and Human Services through The Office of the National Coordinator for Health Information Technology to develop prototypes for the National Health Information Network (NHIN) architecture. In this demonstration, remote data was successfully accessed over SPIN from multiple sites, with the data owners setting the data availability policies, and the public health investigator utilizing different access modes (standard, investigation, etc.).
Accuracy of Models
The modeling accuracy for two sample hospitals for which data are available for all of 2005 and 2006 is reported in ▶. Modeling accuracy is measured as the mean of the absolute value of the percentage error between predicted and actual (MAPE), and is reported for each hospital by year. For example, a MAPE of 10% would mean that the difference between the actual number of visits and the model-generated prediction is, on average, 10%. Therefore, an outbreak that causes the number of visits to increase by 10% will be difficult to detect, as it falls well within the model error. 21 The results show that the modeling approach is more successful for higher-volume data streams such as total-visits, likely due to their larger signal to noise ratios.
Table 1.
Table 1 Modeling Accuracy for Two Sample Hospitals for which Data Are Available for All of 2005 and 2006
| All visits |
Gastrointestinal |
Respiratory |
|||||
|---|---|---|---|---|---|---|---|
| Hospital | Year | MAPE | Stddev | MAPE | Stddev | MAPE | Stddev |
| A | 2005 | 11.10 | 16.60 | 29.03 | 37.90 | 26.92 | 38.45 |
| A | 2006 | 9.94 | 9.34 | 24.82 | 27.07 | 29.55 | 29.59 |
| B | 2005 | 7.43 | 6.78 | 21.60 | 18.23 | 27.15 | 24.09 |
| B | 2006 | 7.30 | 6.70 | 20.65 | 18.23 | 22.81 | 19.30 |
Modeling accuracy is measured as the mean of the absolute value of the percentage error between predicted and actual (MAPE), and is reported for each hospital by year.
Number of Alarms
The total number of alarms generated by the system for select syndrome groups during 2005–2006 is shown in ▶. Over a period of two years, there were only six Level 2 (i.e., ‘High’) alerts generated for respiratory syndrome across all participating hospitals, 13 for gastrointestinal and 30 for ‘all visits’. The number of Level 1 (i.e., ‘Low’) alarms is 5–10 times higher. Based on feedback obtained from the users of the system, this is within the desired range of alarming rates.
Table 2.
Table 2 Number of Level 1 and Level 2 Alarms Generated During 2005 and 2006 for Three Syndromic Categories at All Individual Hospitals
| Syndrome | Level 1 Alarms | Level 2 Alarms |
|---|---|---|
| All Visits | 143 (1.88%) | 30 (0.40%) |
| Gastrointestinal | 61 (0.79%) | 13 (0.17%) |
| Respiratory | 47 (0.62%) | 6 (0.08%) |
The percentage of hospital-days on which alarms were generated is shown in parentheses.
▶ shows that there are more alarms generated by analyzing visits at each individual hospital on its own, rather than analyzing the combined visits from all the hospitals together as one aggregate data stream. This is likely due to the fact that the larger aggregate signal has a higher signal to noise ratio.
Table 3.
Table 3 Total Number of Level 1 and Level 2 Alarms Generated at All and Individual Hospitals During 2005 and 2006
| Level 1 Alarms | Level 2 Alarms | |
|---|---|---|
| Total for individual hospitals | 398 (0.81%) | 80 (0.16%) |
| Average per individual hospital | 36.2 (0.81%) | 7.3 (0.16%) |
| All hospitals combined into one aggregate data stream | 1 (0.12%) | 0 (0.00%) |
The percentage of hospital-days on which alarms were generated is shown in parentheses.
Discussion
Lessons Learned
Our experiences with the AEGIS system over the past few years have highlighted the need for scalability: As more data sources have become available and more users have begun to use the system, it has become critical to make the process of scaling the system easy and reliable. Failure to do so would mean spending more time dealing with technical scaling issues than with normal system operations and ongoing development. Our experiences have also confirmed the need for robustness. With a single system integrating multiple external data sources, failures in data availability were virtually inevitable, and we soon learned that the system must be designed to expect these failures. We also decided to withhold the inclusion of specific data sources from the system because they were so unreliable. With the present fault-tolerant design, the impact of specific data delays are contained and do not result in failures propagating throughout the system.
The participating organizations that provide data to the system reaffirmed the need for addressing concerns of data privacy in order to obtain organizational buy-in. The actual users of the system emphasized the need for speed and usability of the end-user client, as well as ease of remote access to the system. We therefore transitioned from a previous version of the user client written in Java, which took some time to download before using, to the current version of the AEGIS Web User Client written in AJAX and usable with little or no waiting time on a web browser. We continue to identify potential improvements that would make the client both faster and more informative. In the coming months updates will be made to vastly decrease the initial load time, as well as provide a much longer time frame for viewing data, instead of the current limit of one month.
Limitations
Initially, data was stored centrally in the central AEGIS database, but with the development of SPIN, we have been moving to a distributed storage model. This shift in data access models was made possible by the modular design of AEGIS. Though some data sources still provide anonymized data to AEGIS which is stored in the central AEGIS database, we are currently moving towards a model wherein all healthcare data used by AEGIS are stored in a distributed fashion at the local hospital sites where they are generated.
For performance reasons, a design decision was made in AEGIS to cache some highly anonymized summary historical information necessary for generating predictions at the central server. Since the prediction methods utilize many years of daily visit counts to fit the historical models, this avoids having to re-request all the historical visit data on a daily basis. It is possible to adhere strictly to the principle of distributed storage and not cache this information, but we felt that the large increase in performance and efficiency far outweighed the negligible security risk of storing highly anonymized information in a secure central location.
Future Plans
We are working towards releasing an open source version of AEGIS. The goal will be to allow health departments around the world to freely download the AEGIS software and install it locally for use in performing their public health surveillance functions. In addition to performing the local data integration work, health departments would need to have a web server, a data processing server and a database installation. The first open source release will focus on ease of installation and setup by health department technical personnel. Later releases will focus on providing more complete documentation for the source code in order to allow programmers to easily add to and augment to AEGIS’s growing capabilities. We are also working to implement novel methods such as graph-based spatial cluster detection and network-based proportional surveillance from their current status as research prototypes into working AEGIS modules.
Footnotes
This work was supported by grants N01-LM-3-3515 and 5 R01 LM007677-04 from the National Library of Medicine, National Institutes of Health, and by contract number 5225 3 338CHI from the Massachusetts Department of Public Health, and by grant 1 R01 PH000040-01 from the Centers for Disease Control and Prevention.
The following people not mentioned above contributed significantly to making the AEGIS system a reality: John Brownstein, Lucas Jordan, Emmet Sprecher, and Albert Hong.
References
- 1.Mandl KD, et al. Implementing syndromic surveillance: a practical guide informed by the early experience J Am Med Inform Assoc 2004;11(2):141-150. [DOI] [PMC free article] [PubMed] [Google Scholar]
- 2.Buehler JW, et al. Framework for evaluating public health surveillance systems for early detection of outbreaks: recommendations from the CDC Working Group MMWR Recomm Rep 2004;53(RR-5):1-11. [PubMed] [Google Scholar]
- 3.Henning KJ. What is syndromic surveillance? MMWR Morb Mortal Wkly Rep 2004;53(Suppl):5-11.15714620 [Google Scholar]
- 4.Lober WB, Trigg L, Karras B. Information system architectures for syndromic surveillance MMWR Morb Mortal Wkly Rep 2004;53(Suppl):203-208. [PubMed] [Google Scholar]
- 5.Reis BY, Mandl KD. Integrating syndromic surveillance data across multiple locations: effects on outbreak detection performance Proc AMIA Annu Symp 2003. 54953. [PMC free article] [PubMed]
- 6.Centers for Disease Control and Prevention (CDC) Progress in improving state and local disease surveillance—United States, 2000–2005 MMWR Morb Mortal Wkly Rep 2005;54(33):822-825. [PubMed] [Google Scholar]
- 7.Foxhall K. AHIC sets the tableThe American Health Information Community has an ambitious roadmap for 2006 and beyond. Healthc Inform 2006;23(8):17. [PubMed] [Google Scholar]
- 8.Office of the National Coordinator for Health Information Technology, O. Harmonized Use Case for Biosurveillance (Visit, Utilization and Lab Result Data). Available at: http://www.hhs.gov/healthit/documents/BiosurveillanceUseCase.pdf. Accessed Nov 1, 2006.
- 9.Foxhall K. HITSP working to harmonizeThe national data exchange group is making tough decisions to provide the industry with a sound set of standards. Healthc Inform 2006;23(9):28. [PubMed] [Google Scholar]
- 10.Loonsk JW, et al. The Public Health Information Network (PHIN) Preparedness initiative J Am Med Inform Assoc 2006;13(1):1-4. [DOI] [PMC free article] [PubMed] [Google Scholar]
- 11.Heffernan R, et al. New York City syndromic surveillance systems MMWR Morb Mortal Wkly Rep 2004;53(Suppl):23-27. [PubMed] [Google Scholar]
- 12.Lewis MD, et al. Disease outbreak detection system using syndromic data in the greater Washington DC area Am J Prev Med 2002;23(3):180-186. [DOI] [PubMed] [Google Scholar]
- 13.Bradley CA, et al. BioSense: implementation of a National Early Event Detection and Situational Awareness System MMWR Morb Mortal Wkly Rep 2005;54(Suppl):11-19. [PubMed] [Google Scholar]
- 14.Loonsk JW. BioSense–a national initiative for early detection and quantification of public health emergencies MMWR Morb Mortal Wkly Rep 2004;53(Suppl):53-55. [PubMed] [Google Scholar]
- 15.Cooper DL, et al. Can syndromic surveillance data detect local outbreaks of communicable disease?A model using a historical cryptosporidiosis outbreak. Epidemiol Infect 2006;134(1):13-20. [DOI] [PMC free article] [PubMed] [Google Scholar]
- 16.King C, Shih FY, Yen MY, et al. Syndromic Surveillance of Infectious Diseases in Taiwan—Before and After the Challenges of Severe Acute Respiratory Syndrome (SARS) MMWR Morb Mortal Wkly Rep 2004;53(Suppl):245. [Google Scholar]
- 17.Dafni UG, Tsiodras S, Panagiotakos D, et al. Algorithm for statistical detection of peaks—syndromic surveillance system for the Athens 2004 Olympic Games MMWR Morb Mortal Wkly Rep 2004;53(Suppl):86-94. [PubMed] [Google Scholar]
- 18.Rolka H, et al. Using simulation to assess the sensitivity and specificity of a signal detection tool for multidimensional public health surveillance data Stat Med 2005;24(4):551-562. [DOI] [PubMed] [Google Scholar]
- 19.Mandl KD, Reis B, Cassa C. Measuring outbreak-detection performance by using controlled feature set simulations MMWR Morb Mortal Wkly Rep 2004;53(Suppl):130-136. [PubMed] [Google Scholar]
- 20.Brownstein JS, Olsen K, Kleinman K, Mandl K. Effect of site of care and age on timeliness and accuracy of syndromic surveillance data MMWR Morb Mortal Wkly Rep 2005[Supplement: Syndromic Surveillance: Reports from a National Conference, 2004].
- 21.Reis BY, Pagano M, Mandl KD. Using temporal context to improve biosurveillance Proc Natl Acad Sci USA 2003;100(4):1961-1965. [DOI] [PMC free article] [PubMed] [Google Scholar]
- 22.Beitel AJ, Olson KL, Reis BY, Mandl KD. Use of emergency department chief complaint and diagnostic codes for identifying respiratory illness in a pediatric population Pediatr Emerg Care 2004;20(6):355-360. [DOI] [PubMed] [Google Scholar]
- 23.Pavlin JA, Murdock P, Elbert E, et al. Conducting population behavioral health surveillance by using automated diagnostic and pharmacy data systems MMWR Morb Mortal Wkly Rep 2004;53(Suppl):166-172. [PubMed] [Google Scholar]
- 24.Hutwagner LC, et al. Using laboratory-based surveillance data for prevention: an algorithm for detecting Salmonella outbreaks Emerg Infect Dis 1997;3(3):395-400. [DOI] [PMC free article] [PubMed] [Google Scholar]
- 25.Espino JU, Hogan WR, Wagner MM. Telephone triage: a timely data source for surveillance of influenza-like diseases AMIA Annu Symp Proc 2003;215:9. [PMC free article] [PubMed] [Google Scholar]
- 26.Besculides M, Heffernan R, Mostashari F, Weiss D. Evaluation of School Absenteeism Data for Early Outbreak Detection—New York City, 2001–2002 MMWR Morb Mortal Wkly Rep 2004;53(Suppl):230. [DOI] [PMC free article] [PubMed] [Google Scholar]
- 27.Johnson HA, Wagner MM, Hogan WR, et al. Analysis of web access logs for surveillance of influenza Medinfo 2004;11(Pt 2):1202-1206. [PubMed] [Google Scholar]
- 28.Reis BY, Mandl KD. Time series modeling for syndromic surveillance BMC Med Inform Decis Mak 2003;3(1):2. [DOI] [PMC free article] [PubMed] [Google Scholar]
- 29.Hutwagner LC, et al. A simulation model for assessing aberration detection methods used in public health surveillance for systems with limited baselines Stat Med 2005;24(4):543-550. [DOI] [PubMed] [Google Scholar]
- 30.Kulldorff M. A spatial scan statistic Comm Stat: Theory Meth 1997;26:1481-1496. [Google Scholar]
- 31.Wong WK, Moore A, Cooper G, Wagner M. WSARE: What’s Strange About Recent Events? J Urban Health 2003;80(2 Suppl 1):i66-i75. [DOI] [PMC free article] [PubMed] [Google Scholar]
- 32.Namini AH, Berkowicz DA, Kohane IS, Chueh H. A submission model for use in the indexing, searching, and retrieval of distributed pathology case and tissue specimens Medinfo 2004;11(Pt 2):1264-1267. [PubMed] [Google Scholar]
- 33.McMurry AJ, Gilbert CA, Reis BY, et al. A Self Scaling, Distributed Architecture for Public Health, Research, and Clinical Care JAMIA 2007;14(4):527-533July. [DOI] [PMC free article] [PubMed] [Google Scholar]
- 34.Cassa CA, Grannis SJ, Overhage JM, Mandl KD. A context-sensitive approach to anonymizing spatial surveillance data: impact on outbreak detection J Am Med Inform Assoc 2006;13(2):160-165. [DOI] [PMC free article] [PubMed] [Google Scholar]
- 35.Tsui FC, Espino JU, Dato VM, Gesteland PH, Hutman J, Wagner MM. Technical description of RODS: a real-time public health surveillance system J Am Med Inform Assoc 2003;10(5):399-408. [DOI] [PMC free article] [PubMed] [Google Scholar]