

Abstract
Aim
Equations for estimating % fat mass (%BF) and fat-free mass (FFM) from bioelectrical impedance analysis (BIA) that work in adolescent girls from different racial/ethnic backgrounds are not available. We investigated whether race/ethnicity influences estimation of body composition in adolescent girls.
Principal procedures
Prediction equations were developed for estimating FFM and %BF from BIA in 166 girls, 10–15 years old, consisting of 51 Black (B), 45 non-Black Hispanic (H), 55 non-Hispanic White (W) and 15 mixed (M) race/ethnicity girls, using dual energy x-ray absorptiometry (DXA) as the criterion method.
Findings
Black girls had similar %BF compared to other groups, yet were heavier per unit of height according to body mass index (BMI: kg·m−2) due to significantly greater FFM. BIA resistance index, age, weight and race/ethnicity were all significant predictors of FFM (R2 = 0.92, SEE = 1.81 kg). Standardized regression coefficients showed resistance index (0.63) and weight (0.34) were the most important predictors of FFM. Errors in %BF (~2%) and FFM (~1.0 kg) were greater when race/ethnicity was not included in the equation, particularly in Black girls. We conclude the BIA-composition relationship in adolescent girls is influenced by race, and consequently have developed new BIA equations for adolescent girls for predicting FFM and %BF.
Keywords: Bioelectrical impedance, girls, adolescents, fat-free mass, race, ethnicity, body composition, percent fat
Introduction
Pediatric overweight and obesity have increased at alarming rates over recent decades [1]. Concern over this trend has led to several initiatives, including the recent Surgeon General’s Call to Action [2] and efforts by WHO [3] which have focused attention on the need for better screening methods as well as more effective strategies for obesity prevention and treatment.
Bioelectrical impedance analysis (BIA) is a simple, portable, and inexpensive method for estimating body composition. Numerous studies [4] have demonstrated the reliability of impedance measures and validity of BIA equations for estimating FFM and %BF in children and adults, in adults, age, gender, race/ethnicity, and fatness have been shown to influence BIA estimates of body composition [4]. In children, age, gender and fatness also influence BIA estimates of body composition [4]; however, surprisingly few studies have been completed in populations with multi-ethnic samples [4–7]. Consequently, whether race/ethnicity confounds the BIA – body composition relationship in children and adolescents remains uncertain.
The aim of the present investigation was to develop an equation that includes measures from BIA together with height and weight to estimate body composition in adolescent girls of different races and ethnicities. A limitation of past studies in children and adolescents has been the use of criterion methods that require invalid assumptions of chemical constancy, thereby inflating the error in the criterion [8]. To minimize this problem, DXA was used as the criterion method. DXA is based on a three-compartment model of body composition, requires fewer assumptions than methods based on two-compartments, and therefore should be a more appropriate criterion method in adolescents.
Subjects and methods
Subjects
This study was conducted as part of the development and feasibility study of the Trial of Activity for Adolescent Girls (TAAG) [9]. Participants were recruited and measured at three sites across the USA: Tucson, AZ, San Diego, CA, and New Orleans, LA. Data from the three sites were pooled for analysis. Approval for the study was obtained from the respective IRB committees at each of the three study sites. Written parental consent and written participant assent were obtained for all subjects. The University of North Carolina at Chapel Hill served as the coordinating center.
One hundred and sixty-six Black, White and Hispanic girls volunteered to participate. Girls were enrolled in grades 6 or 8 and were between 10–15 years of age. Girls with a wide range of values BMI were recruited. All measurements were conducted during a single visit to each site’s laboratory. The girls had not eaten for ≥3 hours and were asked to wear clothing free of metal and hard plastic, and to remove their shoes, jewelry, and hair clips.
Race and ethnicity
Race and ethnicity were based on girls’ self-reported race/ethnicity using White (non-Hispanic), Black, Hispanic, Asian/Pacific Islander, American Indian or other.
Methods
DXA
The criterion estimates of fat-free mass (FFM) and %BF were obtained from whole-body DXA. Pencil-beam absorptiometers from the same manufacturer (Lunar/GE DPX-NT or DPX-IQ) were used at each site. To minimize differences across sites, a standard protocol was developed and operators were centrally trained in the proper procedures for obtaining and analyzing scans. All scans were conducted and analyzed by a single technician at each site. The densitometers were calibrated daily against the manufacturer’s standard calibration block. Precision for whole body FFM for all three machines used in the study was ~1.0%. Subjects were positioned according to the standard manufacturer’s instructions for whole-body scans, which require them to lie supine with their arms by their sides, palms down, with their knees and ankles held together with Velcro straps. They were instructed to lie still and to refrain from talking during the scanning process. Total scan time was approximately 10 minutes. Scans were analyzed using the manual mode, following the manufacturer’s standard procedures for defining the cut-points for each body region.
Anthropometry
Standing height was measured in stocking feet on a Schorr Height board (Olney MD), and body weight was measured on a portable digital scale (Seca, Hamburg, Germany). Calibration of the Seca scale was conducted before each testing session using a 5 kg weight. Body weight was recorded to the nearest 0.1 kg; height was recorded to the nearest 0.1 cm. Both weight (WT) and height (HT) were measured twice and their respective averages were used in the analyses. Body mass index (BMI) was calculated from WT and HT.
BIA
Resistance (R) and reactance (Xc) were measured with the RJL Systems, Model Quantum II, a four terminal single frequency (800 μA at 50 Khz) impedance plethysmograph (RJL Systems, Detroit, MI) with an internal calibration system. Subjects wore light clothing and were barefoot (or removed the shoe and sock from the right foot). The subject reclined in a supine position on a measuring table or a floor mat with arms adjacent to, but not touching the body, palms flat against the table, and legs adjacent to each other but not touching. Four surface, self-adhesive spot electrodes were placed on the dorsal surface of the right hand and on the dorsal surface of the right foot. Prior to electrode placement the skin was cleansed with alcohol at the four locations for electrode placement. Resistance (R) and reactance (Xc) values were determined on the right side of the body. After the electrodes had been positioned, two readings were recorded. Differences between readings were small, ranging from 0–5 Ω. The mean of two readings for R and Xc was used in the analysis. Resistance index (RI = HT2/R) was calculated from HT and R.
Statistical analysis
Body composition variables were compared by analysis of variance (testing main effect of race/ethnic group). Linear regression parameter estimates (slope and intercept) from the prediction of DXA FFM and %BF from BIA measures (RI and Xc), with covariate adjustment for weight and age were compared between groups by testing the significance of the main effect of race/ethnic group and its interaction with RI or Xc. The hypothesis of a difference in regression parameters among all groups was tested at the 0.05 level. If this first step was statistically significant, then pairwise comparisons between groups was tested. Estimates of FFM and %BF are based on the least squares means. Analyses were done with SAS (version 8.2; SAS Institute Inc, Cary, NC).
Results
The physical characteristics of the sample are shown in Table 1. Black girls had significantly greater FFM (10–13%) and significantly lower resistance (37–48% less) than Hispanic, White and mixed race/ethnicity girls. There were no significant differences among groups in other body composition measures. Percent body fat for the entire sample averaged 27.9±10.4%.
Table 1.
Sample descriptive statistics (X̄ ± sd)
| Subjects | ||||
|---|---|---|---|---|
| Characteristics | Black | Non-Black Hispanic | Non-Hispanic White | Mixed |
| n51 | n45 | n55 | n15 | |
| Age (y) | 12.0 + 1.1 | 12.3 + 1.1 | 12.1 + 1.3 | 12.5 + 1.0 |
| Weight (kg) | 56.4±18.4 | 52.1±14.9 | 50.0±14.3 | 51.6±14.7 |
| Height (cm) | 155.5±7.7 | 153.8±7.9 | 154.9±8.9 | 152.7±7.1 |
| BMI (kg·m2) | 23.1±6.4 | 21.8±5.3 | 20.6±4.8 | 21.9±5.1 |
| DXA-FFM (kg) | 38.3±7.1* | 34.3±6.1 | 34.9±6.8 | 33.7±5.6 |
| DXA-%BF | 27.2±11.2 | 29.5±10.8 | 26.4±9.1 | 30.5±10.3 |
| R(Ω) | 608±81* | 652±78 | 643±86 | 654±72 |
| Xc(Ω) | 62±8 | 62±5 | 61±8 | 65±7 |
| RI(cm2·Ω−1) | 40.6±7.5 | 37.1±7.1 | 38.2±7.5 | 36.2±5.9 |
Abbreviations: R, resistance; Xc, reactance; RI, resistance index (height2/R)
P<0.05 for comparison between Blacks and all other groups.
The results of the regression analyses with FFM and %BF as dependent variables are given in Table 2. BIA resistance index (RI), age, weight, and race/ethnicity were all significant predictors of FFM and %BF. BIA reactance was a significant predictor (P<0.02) of FFM only when the race/ethnicity contrast was not included in the equation. The interactions of race/ethnicity with RI and reactance were not significant. Of these predictors, the standardized estimate for RI was the largest in the model predicting FFM. The standardized estimate for weight, followed by RI, was the largest in the model predicting %BF. As shown in Figure 1, the residuals from the model predicting FFM were significantly correlated (r = 0.27) with FFM, and there was a trend to overestimate FFM at lower levels and underestimate FFM at higher levels of FFM (Fig. 1). Similarly, residuals from the model predicting percent fat were significantly correlated (r = 0.46) with %BF (Fig. 2), and there was a trend to overestimate %BF at lower levels and underestimate %BF at higher levels.
Table 2.
Parameter estimates from multiple linear regression analyses of DXA fat-free mass (FFM) and DXA-% fat (%BF) among girls 10–15 years of age
| Variable | Parameter estimate(SE) | P Value | Standardized estimateb |
|---|---|---|---|
| Fat-free mass | |||
| Intercept | −2.43 (1.550) | 0.119 | 0 |
| Race/ethnicitya | 1.59 (0.323) | <0.0001 | 0.11 |
| Weight (kg) | 0.15 (0.017) | <0.0001 | 0.35 |
| Age (y) | 0.81 (0.136) | <0.0001 | 0.14 |
| RI (cm2·Ω−1) | 0.52 (0.037) | <0.0001 | 0.56 |
| Adjusted R2, % | 93 | ||
| Root mean standard error (RMSE) | 1.85 | ||
| Variable | Parameter estimate(SE) | P Value | Standardized estimateb |
|
| |||
| Percent fat | |||
| Intercept | 22.87 (4.169) | <0.0001 | 0 |
| Race/ethnicitya | −3.33 (0.870) | <0.0002 | −0.15 |
| Weight (kg) | 0.85 (0.045) | <0.0001 | 1.31 |
| Age (y) | −0.82 (0.367) | 0.0272 | −0.09 |
| RI (cm2·Ω−1) | −0.76 (0.101) | <0.0001 | −0.54 |
| Adjusted R2, % | 77 | ||
| Root mean standard error (RMSE) | 4.97 | ||
Race/ethnicity contrast: African-American = 1, others = 0.
Standardized regression coefficient
Figure 1.
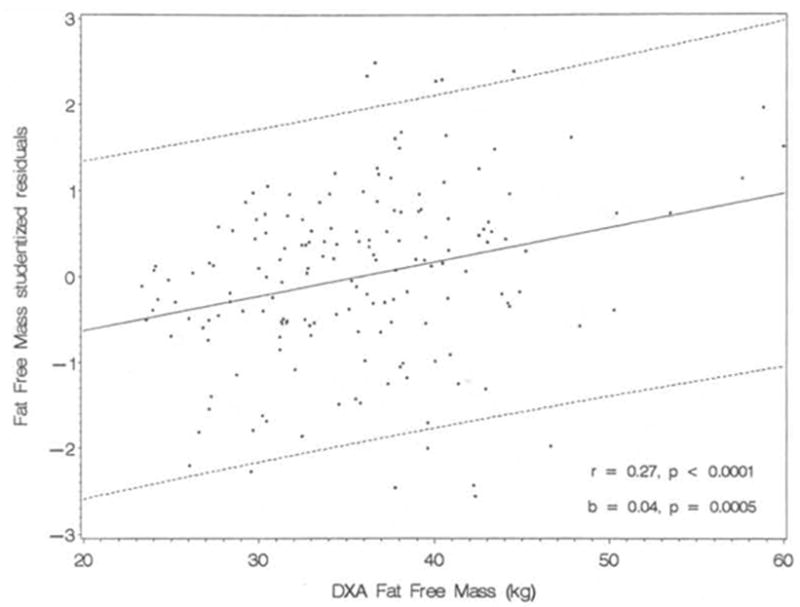
Plot of fat-free mass residuals against criterion fat-free mass from DXA (showing ± 2 × Root mean standard error)
Figure 2.
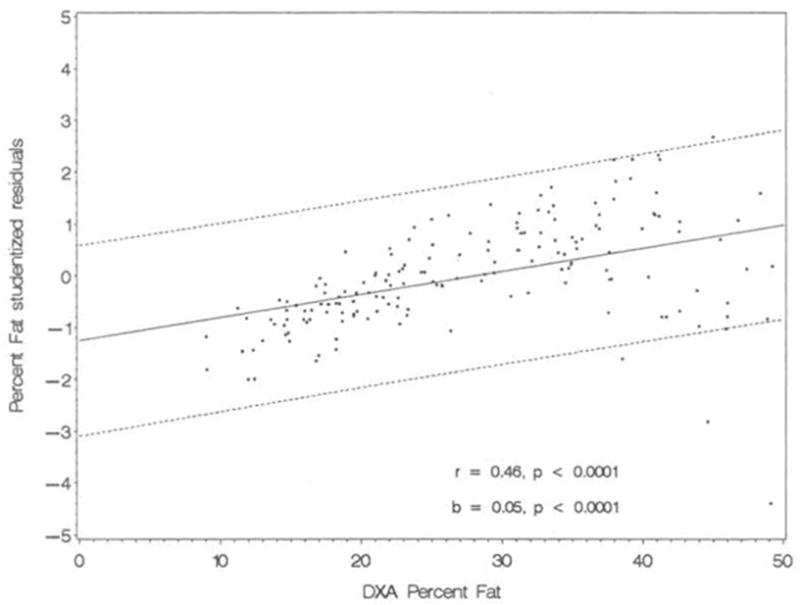
Plot of percent fat residuals against criterion percent fat from DXA (showing ± 2 × Root mean standard error
To estimate the effect of race/ethnicity differences on estimates of FFM, adjusted means from the regression model with age, WT, RI and the race/ethnicity contrast were compared to the unadjusted means shown in Table 1. The FFM adjusted means were 36.78 kg for Black girls and 35.18 kg for the other groups. Thus, with age, weight and resistance index held constant, Black girls had approximately 1.6 kg more FFM compared to Hispanic, non-Hispanic and mixed race/ethnicity girls. Without the race/ethnicity contrast, the Black girls’ average FFM would be underestimated by 0.8 kg whereas all other groups would be overestimated by 0.8 kg in comparison to the average criterion measure.
Given the curvilinear appearance of the plot of the residuals of predicted %BF against the criterion (Fig. 2), we examined additional models for estimating %BF that included quadratic terms. Models with 1) WT, WT2, RI and race, 2) WT, WT2, HT, resistance and race, and 3) BMI, BMI2, resistance and race were tested. Of these models, model 3 gave the best prediction, and BMI, BMI2, resistance and race were all significant (P<0.0001) predictors of %BF. The regression equation was as follows:
In comparison to the model with weight, age, RI and race (Table 2), the adjusted R2 was improved from 0.77 to 0.88 and the root mean squared error (RMSE) was reduced from 4.97 to 3.55%. The correlation between the percent fat residuals and DXA %BF was reduced from r=0.46 to r=0.34 (P<0.0001) and the slope from 0.04 to 0.03 (P<0.0001).
Discussion
The results of this study support the validity of BIA for estimating body composition in adolescent girls, and demonstrate the advantage of including an adjustment for race in the estimation equation. In this study, the addition of a race/ethnicity contrast improved the estimation of FFM in Black girls. For the same age, weight and RI, Black girls had approximately 1.6 kg more FFM compared to Hispanic, non-Hispanic and mixed race/ethnicity girls. The effect was apparently one of race rather than ethnicity, as contrasts comparing Hispanic and non-Hispanic girls were not significant. Ignoring the race effect would result in under-estimation of FFM in Black girls, even with weight, age, and RJ in the equation, whereas our findings suggest the relation of RI to FFM is similar in Hispanic and non-Hispanic girls. Morison et al [5], in a study designed to develop equations for use in the NHLBI’s National Growth and Health Study [10], also recommended race-specific equations to estimate FFM in Black and White girls. Rather than including race as a predictor and testing its significance, however, as we did, Morrison et al [5] developed separate equations in Black and White girls and made their recommendations based on the findings of different regression estimates for the predictor variables and differences in the best set of predictors. They also derived an equation for White girls using the same variables that contributed to the best equation for Black girls. Using that equation [7] with the mean values for predictors in White girls, we estimated the FFM for a given RI was 0.8 kg greater in Black girls than White girls, which was less than the 1.6 kg difference found in the present study although in the same direction.
Previous validation studies of BIA in children and adolescents have reported multiple correlation coefficients (R2) ranging from approximately 0.85 to 0.95 and estimation errors (RMSE) ranging from approximately 1.5 kg to 3.0 kg for FFM and 2.5% to 4.0% for %BF [4–6, 8, 11, 12]. Our multiple correlation coefficients and RMSE compared favorably with ones reported from other studies. Results among studies vary because of sampling differences and sample sizes, selection of independent variables, and differences in criterion methods. Typically RI is derived from height and bio-resistance because of its theoretical relationship with body water and FFM, although in some equations they have been entered as separate predictors. In some studies, BIA has been combined with anthropometric measures in addition to height and weight (eg skinfolds) and the addition of these variables sometimes improves prediction accuracy [5, 7]. We did not introduce additional anthropometric variables since we were interested in whether BIA measures, combined only with weight and height, predicted body composition similarly in girls of different races and ethnicities. It is possible that the prediction errors would be improved with the inclusion of additional anthropometric variables, and that the race/ethnicity contrast would no longer be needed, although in practice it may be simpler to include the contrast rather than undertake additional anthropometry. While the accuracy of %BF estimation was improved when BMI and BMI2 were used as predictors, the race/ethnicity contrast remained significant.
Few studies in adolescents have examined whether race and ethnicity influence the estimation of FFM and %BF from BIA, although our finding of an important effect of race/ethnicity is not without precedent. As noted above, Morrison et al [5] developed race specific equations in Black and White girls, but did not directly test the race effect on BIA estimates of FFM and did not study Hispanic girls. In a study of BIA in American Indian elementary age school children, Lohman et al [7] cross-validated equations that had been developed primarily in White boys and girls. All of the previously published equations applied in that sample under-predicted %BF, suggesting that population-specific equations were needed to accurately estimate body composition from BIA in American Indian children. In a heterogeneous sample of 125 Whites and 89 Blacks with wide age (14–53 y) and BMI (18–50 kg·m−2) ranges, Schoeller and Luke [13] found significantly different beta-coefficients modifying the resistance index for Blacks and Whites and recommended separate regression equations for estimating total body water in these groups. Other studies in adults have reported racial differences in the relationship between body mass and bioelectrical impedance [14, 15] and race-specific BIA equations are commonly recommended in adults [4, 8]. The reason for the significant effect of race on BIA-derived estimates of composition is not clear. Racial differences in FFM composition (eg, water, protein and mineral fractions of FFM) are known to exist that contribute to model error depending on the criterion method that is employed [8, 16–18]. Model error should not have been a significant factor in this study because we used DXA and a three-component model of composition that should minimize model error in adolescent girls. There are also racial differences in body proportions. Blacks have a greater tendency toward mesomorphy and greater appendicular skeletal muscle [19] and, on average, have shorter trunks and longer extremities [19–22] and smaller bi-iliac and bi-trochanteric widths relative to stature [23] than Caucasians. These anthropometric differences between races could have a significant effect on the estimation of FFM and %BF by BIA since total body resistance is largely determined by segmental resistances in the extremities [24]. Whether racial differences in electrical properties exist that contribute to differences in BIA estimates of composition is uncertain. However, the results of Schoeller and Luke [13] contradict this possibility. In their work, equations validated for African-Americans did not work in Jamaicans of African origin and Nigerians, whereas equations validated in Whites performed well. Thus, racial differences in BIA prediction equations do not appear to be due to simply differences in electrical properties. Based on their observation that race was a significant predictor (along with resistance index) of total body water only when body weight was included in the regression equation, Schoeller and Luke [13] suggested the racial effect was an effect of the composition of excess weight rather than an effect of electrical properties.
Our finding of significant correlations between FFM and %BF residuals and the criterion measures has been reported previously in adults and children and youth [5, 7, 25–27]. For example, both Morrison and Lehman reported that BIA equations were related to fatness in Black and White [5], and American Indian [7] children and youth. In those studies, as in this study, the performance of the equations was reasonable despite the correlations with the residuals. Morrison et al. [5], suggested that total body water (the major constituent of FFM) may predict FFM differently in obese and non-obese girls. Certainly hydration of FFM differs between obese and non-obese persons [27], but whether hydration differences explain the effect of body fatness on BIA prediction equations remains uncertain. In adults, fatness-specific equations have been published [26, 28]. To our knowledge, fatness-specific equations have not been developed for children and youth. In American Indian children, Lohman et al. [7] found a significant interaction between resistance index and triceps skinfold which may provide a means of accounting for the potential change in the relationship of BIA to body composition in fatter persons. The utility of incorporating skin-fold thicknesses and other anthropometric measures for estimating body composition across a range of fatness levels in children and adolescents deserves further investigation. While the use of BMI and BMI2 to predict %BF along with bioresistance reduced the correlation between the %BF residuals and the criterion, a significant correlation remained.
In summary, we conclude that population-specific equations are necessary to obtain the most accurate estimates of body composition from BIA in Black and White adolescent girls. Whether the need for different equations in these populations arises from differences in body proportions, tissue electrical properties, or some other factors, remains to be determined. Future studies designed to address this issue are needed. Studies recruiting different racial groups with criterion measures based on multiple component models that account for racial differences in FFM composition, and that include measures of body proportions along with whole body and segmental BIA parameters, should help identify factors underlying racial differences in BIA-body composition relationships, and, ultimately lead to more accurate prediction equations.
Acknowledgments
We would like to thank the girls who participated in the study; the project coordinators for participant recruitment; and the members of the TAAG Steering Committee, including: Russell Pate, PhD, University of South Carolina; Deborah Rohm-Young, PhD, University of Maryland College Park; Leslie Lytle, PhD, University of Minnesota; Timothy Lohman, PhD, University of Arizona; Larry Webber, PhD, Tulane University; John Elder, PhD, San Diego State University; June Stevens, PhD, The University of North Carolina at Chapel Hill; and Charlotte Pratt, PhD, National Heart, Lung, and Blood Institute.
Footnotes
This study was sponsored by the National Heart, Lung, and Blood Institute. (U01 HL66853-01)
References
- 1.Troiano RP, Flegal KM, Kuczmarski RJ, Campbell SM, Johnson CL. Overweight prevalence and trends for children and adolescents. The National Health and Nutrition Examination Surveys, 1963 to 1991. Arch Pediatr Adolesc Med. 1995;149(10):1085–91. doi: 10.1001/archpedi.1995.02170230039005. [DOI] [PubMed] [Google Scholar]
- 2.USDHHS. The Surgeon General’s Call to Action to Prevent and Decrease Overweight and Obesity. US Dept of Health and Human Services, Public Health Service, Office of the Surgeon General; Rockville, MD, USA: 2001. [PubMed] [Google Scholar]
- 3.WHO. Obesity: preventing and managing the global epidemic. Report of a WHO Consultation presented at the World Health Organization; Geneva, Switzerland: 1997. [PubMed] [Google Scholar]
- 4.Heyward VH, Wagner DR. Applied body composition. 2. Champaign, IL: Human Kinetics; 2004. [Google Scholar]
- 5.Morrison JA, Guo SS, Specker B, Chumlea WC, Yanovski SZ, Yanovski JA. Assessing the body composition of 6–17-year-old Black and White girls in field studies. Am J Hum Biol. 2001;13(2):249–54. doi: 10.1002/1520-6300(200102/03)13:2<249::AID-AJHB1035>3.0.CO;2-6. [DOI] [PubMed] [Google Scholar]
- 6.Bray GA, DeLany JP, Volaufova J, Harsha DW, Champagne C. Prediction of body fat in 12-y-old African American and white children: evaluation of methods. Am J Clin Nutr. 2002;76(5):980–90. doi: 10.1093/ajcn/76.5.980. [DOI] [PubMed] [Google Scholar]
- 7.Lohman TG, Caballero B, Himes JH, Davis CE, Stewart D, Houtkooper L, Going SB, Hunsberger S, Weber JL, Reid R, Stephenson L. Estimation of body fat from anthropometry and bioelectrical impedance in Native American children. Int J Obes Relat Metab Disord. 2000;24(8):982–8. doi: 10.1038/sj.ijo.0801318. [DOI] [PubMed] [Google Scholar]
- 8.Lohman TG. Current issues in exercise science series. Champaign, IL: Human Kinetics Publishers; 1992. Advances in body composition assessment. Monograph No. 3. [Google Scholar]
- 9.Stevens J, Murray DM, Catellier DJ, Hannan PJ, Lytle LA, Elder JP, Young DR, Simons-Morton DG, Webber LS. Design of the trial of activity in adolescent girls (TAAG) Contemp Clin Trials. 2005;26(2):223–33. doi: 10.1016/j.cct.2004.12.011. [DOI] [PMC free article] [PubMed] [Google Scholar]
- 10.NHLBI. Obesity and cardiovascular disease risk factors in black and white girls: the NHLBI Growth and Health Study. Am J Publ Hlth. 1992;82(12):1613–20. doi: 10.2105/ajph.82.12.1613. [DOI] [PMC free article] [PubMed] [Google Scholar]
- 11.Houtkooper LB, Lohman TG, Going SB, Hall MC. Validity of bioelectric impedance for body composition assessment in children. J Appl Physiol. 1989;66(2):814–21. doi: 10.1152/jappl.1989.66.2.814. [DOI] [PubMed] [Google Scholar]
- 12.Houtkooper LB, Going SB, Lohman TG, Roche AF, Van Loan M. Bioelectrieal impedance estimation of fat-free body mass in children and youth: a cross-validation study. J Appl Physiol. 1992;72(1):366–73. doi: 10.1152/jappl.1992.72.1.366. [DOI] [PubMed] [Google Scholar]
- 13.Schoeller DA, Luke A. Bioelectrical impedance analysis prediction equations differ between African Americans and Caucasians, but it is not clear why. Ann NY Acad Sci. 2000;904:225–6. doi: 10.1111/j.1749-6632.2000.tb06456.x. [DOI] [PubMed] [Google Scholar]
- 14.Heitmann BL, Swinburn BA, Carmichael H, Rowley K, Plank L, McDermott Leonard D, O’Dea K. Are there ethnic differences in the association between body weight and resistance, measured by bioelectrical impedance? Int J Obes. 1997;21:1085–92. doi: 10.1038/sj.ijo.0800477. [DOI] [PubMed] [Google Scholar]
- 15.Ward LC, Heitmann BL, Craig P, Stroud D, Azinge EC, Jebb SA, Cornish BH, Swinburn B, O’Dea K, Rowley K, McDermott R, Thomas BJ, Leonard D. Association between ethnicity, body mass index, and bioelectrical impedance: Implications for the population specificity of prediction equations. Ann NY Acad Sci. 2000;904:199–202. doi: 10.1111/j.1749-6632.2000.tb06449.x. [DOI] [PubMed] [Google Scholar]
- 16.Schutte JE, Townsend EJ, Hugg J, Shoup RF, Malina RM, Blomqvist CG. Density of lean body mass is greater in blacks than in whites. J Appl Physiol. 1984;56(6):1647–9. doi: 10.1152/jappl.1984.56.6.1647. [DOI] [PubMed] [Google Scholar]
- 17.Slaughter MH, Lohman TG, Boileau RA, Christ CB, Stillman RJ. Differences in the subcomponents of fat-free body in relation to height between black and white children. Am J Hum Biol. 1990;2:209–217. doi: 10.1002/ajhb.1310020302. [DOI] [PubMed] [Google Scholar]
- 18.Wagner DR, Heyward V. H Measures of body composition in blacks and whites: a comparative review. Am J Clin Nutr. 2000;71(6):1392–402. doi: 10.1093/ajcn/71.6.1392. [DOI] [PubMed] [Google Scholar]
- 19.Ortiz O, Russell M, Daley TL, Baumgartner RN, Waki M, Lichtman S, Wang J, Pierson RN, Jr, Heymsfield SB. Differences in skeletal muscle and bone mineral mass between black and white females and their relevance to estimates of body composition. Am J Clin Nutr. 1992;55(1):8–13. doi: 10.1093/ajcn/55.1.8. [DOI] [PubMed] [Google Scholar]
- 20.Malina RM. Anthropometry. In: Maud PJ, Foster C, editors. Physiological assessment of human fitness. Human Kinetics Publishers; Champaign, IL: 1995. 1995. pp. 205–19. [Google Scholar]
- 21.Malina RM. In: Regional body composition: Age, sex, and ethnic variation, in Human body composition. Roche AF, Heymsfield SB, Lohman TG, editors. Human Kinetics Publishers; Champaign, IL: 1996. 1996. pp. 217–55. [Google Scholar]
- 22.Trotter M, Hixon BB. Sequential changes in weight, density, and percentage ash weight of human skeletons from an early fetal period through old age. Anat Rec. 1974;179(1):1–18. doi: 10.1002/ar.1091790102. [DOI] [PubMed] [Google Scholar]
- 23.Hampton MC, Huenemann RL, Shapiro LR, Mitchell BW, Behnke AR. A longitudinal study of gross body composition and body conformation and their association with food and activity in a teen-age population. Anthropometric evaluation of body build. Am J Clin Nutr. 1966;19(6):422–35. doi: 10.1093/ajcn/19.5.422. [DOI] [PubMed] [Google Scholar]
- 24.Baumgartner RN, Chumlea WC, Roche AF. Bioelectric impedance for body composition. Exerc Sport Sci Rev. 1990;18:193–224. [PubMed] [Google Scholar]
- 25.Graves JE, Pollock ML, Colvin AB, Van Loan M, Lohman TG. Comparison of different bioelectrical impedance analyzers in the prediction of body composition. Am J Hum Biol. 1989;1:603–11. doi: 10.1002/ajhb.1310010511. [DOI] [PubMed] [Google Scholar]
- 26.Segal KR, Van Loan M, Fitzgerald PI, Hogdson JA, Van Ittalie TB. Lean body mass estimation by bioelectrical impedance analysis: a four site cross-validation study. Am J Clin Nutr. 1988;47:7–14. doi: 10.1093/ajcn/47.1.7. [DOI] [PubMed] [Google Scholar]
- 27.Lohman TG. Advances in human body composition. Champaign, IL: Human Kinetics; 1992. [Google Scholar]
- 28.Gray DS, Bauer M. The relationship between body fat mass and fat-free mass. J Am Coll Nut. 1991;10(1):63–8. doi: 10.1080/07315724.1991.10718128. [DOI] [PubMed] [Google Scholar]