Dear Editor,
We would like to thank Drs. Kim and Dionne for their thoughtful comments regarding our paper Catechol-O-methyltransferase gene polymorphisms are associated with multiple pain-evoking stimuli that was published in the December issue of Pain. We enthusiastically support their desire to maintain rigorous standards for studies in the area of pain genetics and we also appreciate the opportunity to address the key concerns and criticisms that Kim and Dionne have raised about our publication. The impact of population stratification and phenotyping procedures should be taken into account by any genetic association study. While these study design concerns were not specifically discussed in the December article, they are issues that we have carefully considered and largely addressed in past publications pertaining to this patient population. (Diatchenko et al. 2005;Bhalang et al. 2005).
The first concern raised by Kim and Dionne relates to the problem of false genetic associations that can occur as a result of population stratification. The patterns of genetic variation (Pritchard and Rosenberg 1999;Gabriel et al. 2002) and pain sensitivity (Edwards et al. 2001) are not uniform between ethnically diverse populations. However, population stratification may lead to spurious associations only when the specific investigated phenotype as well as genotype distributions are not the the same among the subjects of the different ethnic groups in the cohort considered (Enoch et al. 2006). Because our recruited population was ethnically mixed, we investigated this important issue and reported the outcome of the analysis in a previous publication (Diatchenko et al. 2005). We viewed this verification as a “best practice” and because of space limitations we did not include a detailed analysis in the December article. Briefly, there were too few non-Caucasian participants (N = 31; 15 %) genotyped to permit meaningful statistical analyses by treating this group as a separate strata. In addition, the percentage of subjects classified as HPS/APS was virtually identical between Caucasians (35%) and non-Caucasians (36% - Chi-square test, P = 0.89) and the mean derived measure of global pain sensitivity (pain z-scores) did not differ between the two groups (t-test, P = 0.30). Furthermore, when a factorial analysis of COMT haplotypes was restricted to Caucasians only, the results associated with pain z-score for COMT haplotypes was virtually the same. Specifically, a main effect of haplotype was observed (P < 0.03), and pairwise effects were significant for ATCA vs. GCGG (P = 0.03) and for ACCG vs. GCGG (P < 0.001; (Diatchenko et al. 2005).
One theoretical limitation is that the study may not have been sufficiently powered to detect differences in pain phenotype or genotype frequency between populations. To provide additional evidence that the observed associations are not ethnically-dependent, the results should be reproduced within one ethnic group. On the other hand, the study may not be sufficiently powered to detect an association if we limit our analysis to Caucasians due to reduced sample size. Therefore, we selected the temporal summation dataset to repeat our analyses restricted to Caucasians, as the within subject’s repeated measures of this dataset allows for the most robust associations to emerge with the fewest number of subjects.
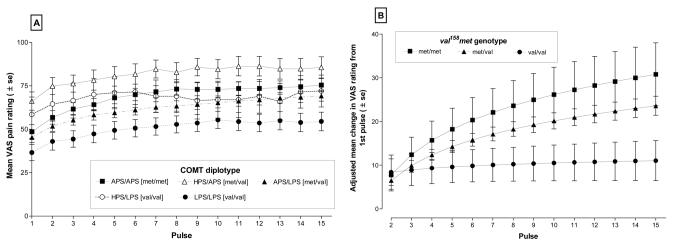
When responses to repeated thermal stimuli were analyzed for Caucasians only the characteristic pattern of heat pain summation was observed (Fig.1A). Visual inspection of the data suggested that there was a diplotype effect on the responses to the first pulse and this effect was similar to the findings shown in Fig. 2A of the published December article. Participants carrying the HPS/APS diplotype reported the highest first pulse response while those with the LPS/LPS diplotype reported the lowest VAS rating to the initial heat pulse. There was also indication that, similar to the mixed ethnic population, the slope of temporal summation curves varied among diplotypes, appearing steepest for the APS/APS diplotype, and flattest for the LPS/LPS diplotype (Fig. 1A). Statistical evaluation of the data in Fig. 1A generated results virtually identical to those reported for the mixed ethnic population. A main effect of diplotype was observed (P=0.0151 compared to P = 0.017 for the mixed population), and APS/HPS was the only diplotype that differed from LPS/LPS after correction for multiple comparisons at P < 0.007. Specifically, APS/HPS was 29.127 VAS units higher than LPS/LPS (compare with 27.711 VAS for mixed population). In contrast, APS/APS was only 11.960 higher than LPS/LPS (compare with 12.145 VAS for the mixed population), and not statistically different. These results further confirm that the COMT haplotype associations with individual variations in resting nociceptive sensitivity were not spurious associations that resulted from an effect of population stratification.
Figure 1. Responses to the Temporal Summation of Repeated Heat Stimuli categorized by five major diplotypes of COMT.
Mean visual analog scale (VAS) responses to 15 thermal pulses were plotted for five diplotypes of COMT (Panel 1A). VAS responses in the range 0-19 were truncated to 9. Data are expressed as Mean ± SEM. Adjusted mean values of temporal change in VAS among val158met genotypes were derived from the analysis of covariance models (Panel 2B). The adjusted means reveal a significant curvilinear gradient of log(pulse) which was greater for the met/met genotype compared with val/val genotype (P=0.005). Adjusted means isolated the contribution of val158met polymorphism to overall haplotype variation after controlling for effects if other SNPs in the haplotype (rs6269, rs4633 and rs4818).
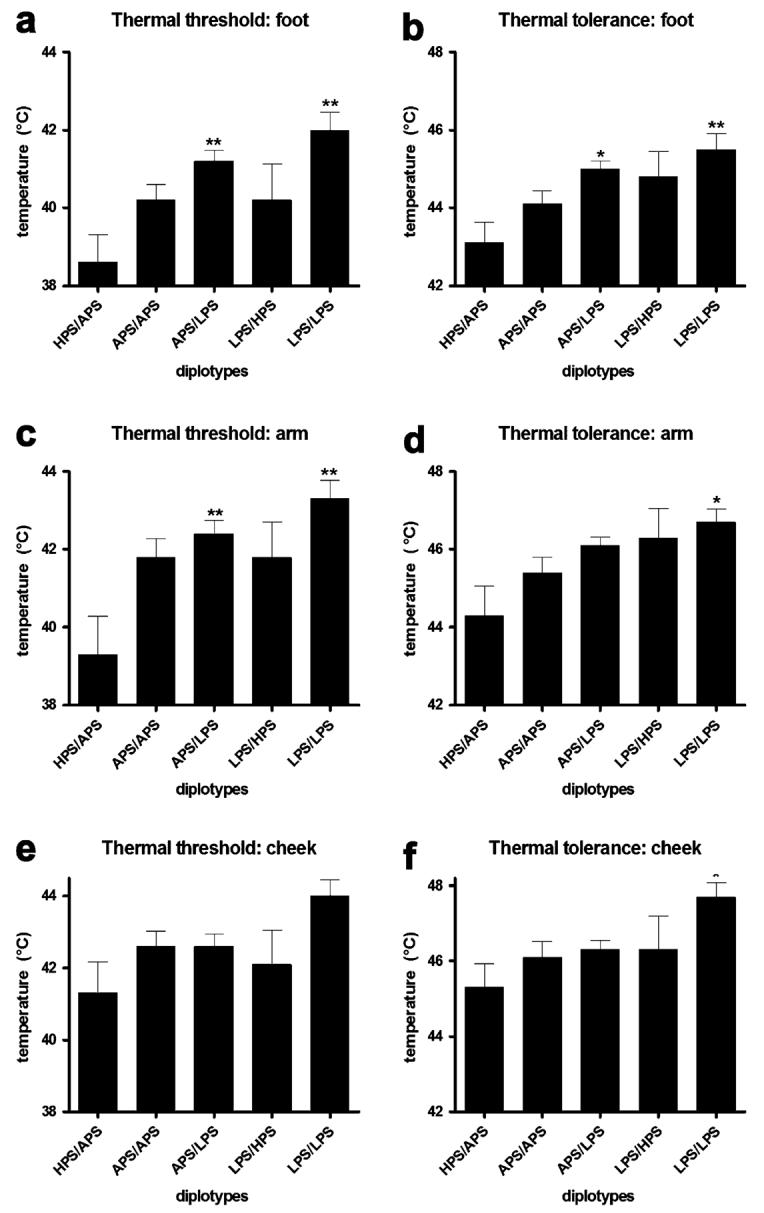
Figure 2. Thermal pain sensitivity categorized by three major COMT haplotype combinations.

Thermal pain threshold and tolerance values (°C) assessed from the skin overlying the arm, cheek and foot. Each value represents the mean and associated s.e.m. Group comparisons were performed using a one-way ANOVA followed by Bonferroni adjustment for post-hoc testing. *P < 0.05, **P < 0.01, ***P < 0.001.
We have also reexamined the contribution of val158met polymorphism to the pattern of temporal summation in Caucasians alone. We first confirmed that the frequency of the A allele, which coded for the met variant of COMT, was not significantly different between ethnic groups. Our analysis showed again, that the percentage of subjects carrying the A allele was virtually identical between Caucasians (27.1%) and non-Caucasians (21.0% - Chi-square test, P=0.56). Then, we performed a statistical evaluation of the rate of increase in the temporal pattern of responses and confirmed that the val158met SNP contributed significantly to the rate of increase in VAS responses when the analysis was limited to Caucasians only (Table 1). The temporal patterns are depicted in Fig. 1B. As described in the original article, we applied a partial factorial analysis of covariance model to the data used to construct Fig. 1A. Similar to our original findings with a mixed ethnic population, we found a significant difference in slope due to the val158met SNP contribution to the haplotype, (ie. P values for dummy1 × log(pulse) and dummy2 × log(pulse) are P = 0.005 and P = 0.003, respectively). In contrast, interactions between the residual effects of the COMT diplotype were not statistically significant (Table 1). We thus confirmed that the associations between the rate of increase in VAS responses to repeated heat stimuli and the val158met SNP in our original paper were not due to population stratification.
Table 1.
Generalized estimating equation analysis of covariance model of COMT diplotype effects on change in VAS response from first pulse in repeated thermal stimuli among 167 Caucasian subjects.
| Parameter* | β coefficient | standard error of β | P-value† |
|---|---|---|---|
| log(pulse) | 6.3 | 2.6 | 0.016 |
| dummy1 (met/met) | -7.7 | 6.1 | 0.210 |
| dummy2 (met/val) | -6.9 | 5.0 | 0.166 |
| dummy3 (residual diplotype) | 9.4 | 6.2 | 0.131 |
| dummy4 (residual diplotype) | 5.3 | 5.4 | 0.329 |
| dummy1 × log(pulse) | 10.1 | 3.6 | 0.005 |
| dummy2 × log(pulse) | 7.2 | 2.4 | 0.003 |
| dummy3 × log(pulse) | -7.6 | 4.1 | 0.063 |
| dummy4 × log(pulse) | -5.0 | 3.4 | 0.146 |
| Intercept | 2.3 | 2.5 | 0.376 |
Parameters for COMT diplotype are explained in Table 1 of the original paper
Threshold for statistical significance is P<0.01 after adjustment for five outcome variables assessed in the original paper
The second concern of Drs. Kim and Dionne relates to our use of a combined pain z-score for thermal, pressure, and ischemic experimental pain modalities. They questioned the rationale for deriving a chimeric phenotype that combines pain threshold and pain tolerance. While we recognize that different modalities of nociceptive stimuli are coded and modulated differently by the nervous system, it is also clear that there are phenotypic differences in the aggregate responses to these stimuli (see Fig.1;(Diatchenko et al. 2005). At one end of the distribution, individuals are extremely sensitive, while at the other end they are very insensitive to the intensity and temporal properties of noxious stimuli across several anatomical sites. It is generally accepted that a large subgroup of patients with a variety of persistent pain conditions demonstrate enhanced pain sensitivity to a number of nociceptive modalities across several body regions (Diatchenko et al. 2006). We originally conceptualized and used the combined pain z-score to assess the risk of developing TMJD, a common idiopathic pain condition (Diatchenko et al. 2005;Slade, Diatchenko et al. 2006).
In the current paper, it was our intention to deconstruct the aggregate global pain z-score into individual modalities in order to determine the effects COMT genetic polymorphisms on the variables that we have historically used to construct a global measure of pain sensitivity. We fully agree with Drs. Kim and Dionne that a more traditional approach would have been to report our findings using absolute values rather than z-scores. In fact, in our original submission of December manuscript we took this approach. Because of very valid concerns raised the reviewers regarding the number of statistical procedures, and the observation that the pattern of association did not differ between threshold and tolerance within a pain modality across anatomical sites, we were requested to aggregate our findings within modalities. However, we are not in agreement with Kim and Dionne’s suggestion that it is improper to aggregate threshold and tolerance measures from thermal and ischemic tests. Specifically, for the cohort used in this study, we have reported a high within modality correlation between heat and ischemic measures of threshold and tolerance (Bhalang et al. 2005). A factor analysis conducted on an independent cohort, which employed very similar psychophysical procedures, showed that measures of heat pain threshold and tolerance significantly load on the same factor (Hastie et al. 2005). These findings, coupled with statistical concerns related to multiple testing, support our approach of aggregating measures of threshold and tolerance.
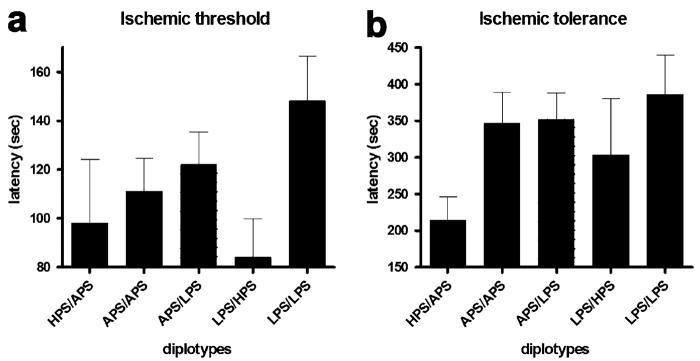
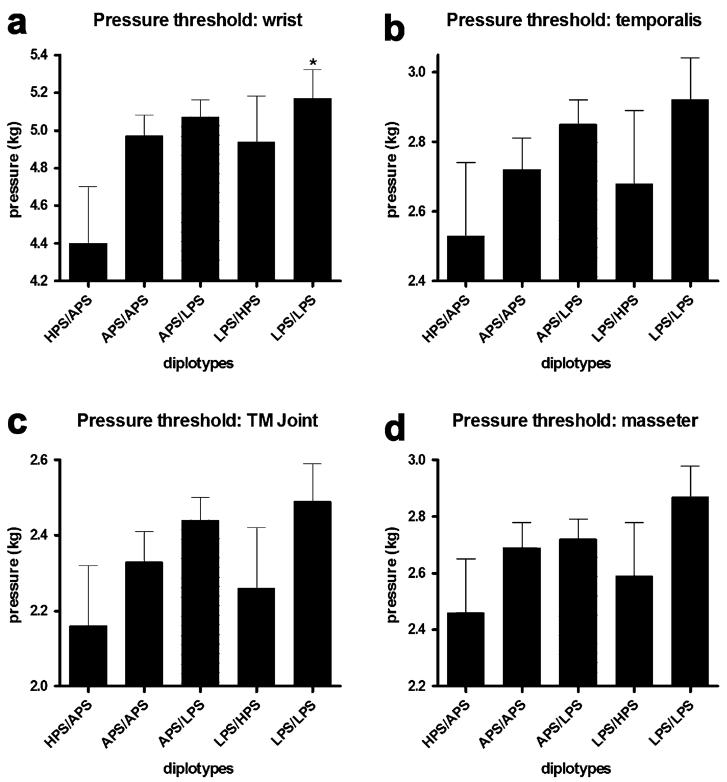
Given this opportunity, with recognition of the valid concerns noted by the reviewers, we would like to show that a similar qualitative pattern of associations for COMT diplotypes across all tested pain measures was observed. Subjects homozygous for the LPS haplotype had the lowest pain responsiveness, subjects homozygous for the APS haplotype had average pain responsiveness, and subjects heterozygous for APS and HPS haplotypes had the greatest pain responsiveness to all of the examined noxious stimuli (Fig. 2-4). Subjects with the HPS/APS diplotype had lower foot thermal pain threshold (F4,180 = 5.09, P < 0.0008; Fig. 2A) and tolerance (F4,180 = 4.52, P < 0.002; Fig. 2B) relative to those possessing the LPS/LPS diplotype. Similarly, subjects with the HPS/APS diplotype had lower arm thermal pain threshold (F4,180 = 4.22, P < 0.003; Fig. 2C) and tolerance (F4,180 = 3.46, P < 0.01; Fig. 2D) relative to those with the LPS/LPS diplotype. Cheek thermal pain threshold (P = 0.057; Fig. 2E) and tolerance (F4,180 = 2.81, P < 0.03; Fig. 2F) was also lower for individuals with the HPS/APS diplotype. Pressure pain threshold for the wrist (Fig. 3A), temporalis muscle (Fig. 3B), TMD joint (Fig. 3C), and masseter muscle (Fig. 3D) was lowest for subjects possessing the HPS/APS diplotype. Significant group differences were observed for the wrist (F4,180 = 2.41, P = 0.05). Ischemic threshold (Fig. 4A) and tolerance (Fig. 4B), while showing a similar qualitative pattern, did not significantly vary between different diplotypes (P > 0.3).
Figure 4. Ischemic pain sensitivity categorized by three major COMT haplotype combinations.
Threshold and tolerance measures (sec) to ischemic pain. Each value represents the mean and associated s.e.m. Group comparisons were performed using a one-way ANOVA followed by Bonferroni adjustment for post-hoc testing. *P < 0.05, **P < 0.01, ***P < 0.001.
Figure 3. Pressure pain sensitivity categorized by three major COMT haplotype combinations.
Mechanical pain thresholds (kg) assessed over the temporalis and masseter muscles, the temporomandibular joint and the ventral surfaces of the wrists. Each value represents the mean and associated s.e.m. Group comparisons were performed using a one-way ANOVA followed by Bonferroni adjustment for post-hoc testing. *P < 0.05, **P < 0.01, ***P < 0.001.
In summary, we would like to stress that we greatly appreciate the nature of the concerns raised by Drs. Kim and Dionne. We fully agree with their concluding statement that given the large number of genetic variations, and our limited current knowledge about the human genome, it is important to follow principles of genetic research for complex traits in order to avoid false positive associations. We hope that we have demonstrated in our response that we embrace the best practices in genetic research and that our results make a credible contribution to our understanding of human pain genetics.
Footnotes
Publisher's Disclaimer: This is a PDF file of an unedited manuscript that has been accepted for publication. As a service to our customers we are providing this early version of the manuscript. The manuscript will undergo copyediting, typesetting, and review of the resulting proof before it is published in its final citable form. Please note that during the production process errors may be discovered which could affect the content, and all legal disclaimers that apply to the journal pertain.
Reference List
- 1.Bhalang K, Sigurdsson A, Slade GD, Maixner W. Associations among four modalities of experimental pain in women. J.Pain. 2005;6:604–611. doi: 10.1016/j.jpain.2005.04.006. [DOI] [PubMed] [Google Scholar]
- 2.Diatchenko L, Nackley AG, Slade GD, Fillingim RB, Maixner W. Idiopathic pain disorders--pathways of vulnerability. Pain. 2006;123:226–230. doi: 10.1016/j.pain.2006.04.015. [DOI] [PubMed] [Google Scholar]
- 3.Diatchenko L, Slade GD, Nackley AG, Bhalang K, Sigurdsson A, Belfer I, Goldman D, Xu K, Shabalina SA, Shagin D, Max MB, Makarov SS, Maixner W. Genetic basis for individual variations in pain perception and the development of a chronic pain condition. Hum.Mol.Genet. 2005:135–143. doi: 10.1093/hmg/ddi013. [DOI] [PubMed] [Google Scholar]
- 4.Edwards CL, Fillingim RB, Keefe F. Race, ethnicity and pain. Pain. 2001;94:133–137. doi: 10.1016/S0304-3959(01)00408-0. [DOI] [PubMed] [Google Scholar]
- 5.Enoch MA, Shen PH, Xu K, Hodgkinson C, Goldman D. Using ancestry-informative markers to define populations and detect population stratification. J.Psychopharmacol. 2006;20:19–26. doi: 10.1177/1359786806066041. [DOI] [PubMed] [Google Scholar]
- 6.Gabriel SB, Schaffner SF, Nguyen H, Moore JM, Roy J, Blumenstiel B, Higgins J, DeFelice M, Lochner A, Faggart M, Liu-Cordero SN, Rotimi C, Adeyemo A, Cooper R, Ward R, Lander ES, Daly MJ, Altshuler D. The structure of haplotype blocks in the human genome. Science. 2002;296:2225–2229. doi: 10.1126/science.1069424. [DOI] [PubMed] [Google Scholar]
- 7.Hastie BA, Riley JL, III, Robinson ME, Glover T, Campbell CM, Staud R, Fillingim RB. Cluster analysis of multiple experimental pain modalities. Pain. 2005;116:227–237. doi: 10.1016/j.pain.2005.04.016. [DOI] [PubMed] [Google Scholar]
- 8.Pritchard JK, Rosenberg NA. Use of unlinked genetic markers to detect population stratification in association studies. Am.J.Hum.Genet. 1999;65:220–228. doi: 10.1086/302449. [DOI] [PMC free article] [PubMed] [Google Scholar]
- 9.Slade G, Diatchenko L, Bhalang K, Sigurdsson A, Fillingim R, Belfer I, Max MB, Goldman D, Maixner W. Contribution of genetic and psychological factors to experimental pain sensitivity and the risk of developing temporomandibular disorder. Journal of Dental Research. 2006 doi: 10.1177/154405910708601119. In Press


