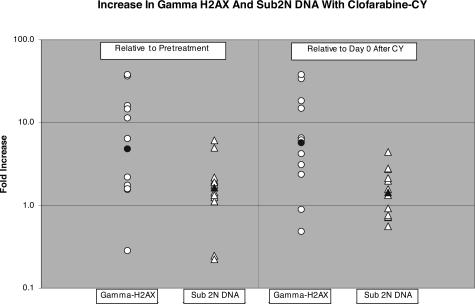
Figure 2.
Increase in γH2AX and sub-2N DNA with clofarabine-CY. Measurements of DNA damage (γH2AX; ○) and apoptosis (sub2N DNA; △) were made on peripheral blood blasts obtained from 13 patients before treatment, after CY on day 0, and after clofarabine-CY on day 1. Values obtained from day 1 after clofarabine-CY blasts were compared with values obtained from pretreatment blasts and day 0 after CY blasts. The relative changes are expressed as fold increase. ● indicates median fold change in γH2AX; and ▴, median fold change in sub-2N DNA.

