

Abstract
The genes MYB11, MYB12 and MYB111 share significant structural similarity and form subgroup 7 of the Arabidopsis thaliana R2R3-MYB gene family. To determine the regulatory potential of these three transcription factors, we used a combination of genetic, functional genomics and metabolite analysis approaches. MYB11, MYB12 and MYB111 show a high degree of functional similarity and display very similar target gene specificity for several genes of flavonoid biosynthesis, including CHALCONE SYNTHASE, CHALCONE ISOMERASE, FLAVANONE 3-HYDROXYLASE and FLAVONOL SYNTHASE1. Seedlings of the triple mutant myb11 myb12 myb111, which genetically lack a complete subgroup of R2R3-MYB genes, do not form flavonols while the accumulation of anthocyanins is not affected. In developing seedlings, MYB11, MYB12 and MYB111 act in an additive manner due to their differential spatial activity; MYB12 controls flavonol biosynthesis mainly in the root, while MYB111 controls flavonol biosynthesis primarily in cotyledons. We identified and confirmed additional target genes of the R2R3-MYB subgroup 7 factors, including the UDP-glycosyltransferases UGT91A1 and UGT84A1, and we demonstrate that the accumulation of distinct and structurally identified flavonol glycosides in seedlings correlates with the expression domains of the different R2R3-MYB factors. Therefore, we refer to these genes as PFG1–3 for ‘PRODUCTION OF FLAVONOL GLYCOSIDES’.
Keywords: flavonoid biosynthesis, R2R3-MYB, PRODUCTION OF FLAVONOL GLYCOSIDES, gene regulation, Arabidopsis
Introduction
Flavonoids are widely distributed in the plant kingdom, although they are usually not essential for plant growth. They are classified into flavonols, flavones, isoflavones and anthocyanins (among others) according to the structure of and the modifications to the A, B and C rings of the C15 scaffold. Although the most visible function of the flavonoids is the formation of red and purple anthocyanin pigments, non-pigmented flavonoid compounds play central roles in plant biology. They serve as signals for pollinators and other organisms, participate in plant hormone signaling, facilitate pollen-tube growth, protect plants from UV-B radiation and function as phytoalexins and allelopathic compounds (Harborne and Williams, 2000; Mol et al., 1998; Pietta, 2000; Winkel-Shirley, 2001). The colorless flavonols are among the most abundant flavonoids in plants (Böhm et al., 1998), usually in the form of mono-, di- or triglycosides. Flavonols accumulate in their glycosylated form after an inductive light treatment in the vacuoles of epidermal cells or occasionally in epicuticular waxes (Weisshaar and Jenkins, 1998), absorb UV-B light in the 280–320 nm region and are therefore thought to be effective UV filters (Olsson et al., 1998; Ormrod et al., 1995; Solovchenko and Schmitz-Eiberger, 2003). There is evidence that auxin retention or transport in vivo is regulated by the accumulation of flavonoids, including the flavonols quercetin and kaempferol (Brown et al., 2001; Buer and Muday, 2004; Jacobs and Rubery, 1988; Murphy et al., 2000; Peer et al., 2001). Also, flavonols play a role in human nutrition and have pharmaceutical potential (summarized in Harborne and Williams, 2000; Ross and Kasum, 2002).
The fine regulation of flavonoid biosynthesis (Figure 1) is achieved by combinatorial action(s) of transcription factors, expressed in a spatially and temporally controlled manner (reviewed in Koes et al., 2005; Lepiniec et al., 2006). Regulators belonging to different transcription factor families, including WD40, WRKY, BZIP, MADS-box, R2R3-MYB and basic helix-loop-helix (BHLH) factors, are involved in the transcriptional control of flavonoid biosynthesis genes (FBGs) (reviewed in Ramsay and Glover, 2005).
Figure 1. Simplified, schematic representation of the biosynthesis of flavonols and anthocyanins in the A. thaliana Col-0 seedling.

To make this figure more comprehensive, the results from this paper have been included. Enzymes are indicated by bold, capital letters. Regulatory proteins are given in gray boxes beside their target genes. Abbreviations are as follows: GPP, general phenylpropanoid pathway; PAL, phenylalanine ammonium lyase; C4H, cinnamate-4-hydroxylase; 4CL, 4-coumaroyl-CoA synthase; CHS, chalcone synthase; CHI, chalcone isomerase; F3H, flavanone 3-hydroxylase; FLS, flavonol synthase; F3′H, flavonoid 3′-hydroxylase; DFR, dihydroflavonol 4-reductase; F3GT, flavonol 3-O-glycosyltransferase; F7RT, flavonol 7-O-rhamnosyltransferase; FGT, flavonol glycosyltransferase; K, kaempferol; Q, quercetin; K 3-O-[glc-rha]-7-O-rha, kaempferol 3-O-[(rhamnosyl) glucoside]-7-O-rhamnoside; Q 3-O-[glc-rha]-7-O-rha, quercetin 3-O-[(rhamnosyl) glucoside]-7-O-rhamnoside; PFG, PRODUCTION OF FLAVONOL GLYCOSIDES. Note that the action of FLS is required for the biosynthesis of flavonols (light gray box) while DFR is necessary for the formation of anthocyanidins. Adapted from Routaboul et al. (2006). The pathway leading to the formation of isorhamnetin is not illustrated.
In Arabidopsis thaliana, some R2R3-MYB transcription factors have been identified that are involved in the regulation of flavonoid biosynthesis. PRODUCTION OF ANTHOCYANIN PIGMENT1 (PAP1/MYB75) and PAP2/MYB90 are regulators of genes required for the production of anthocyanins, including PHENYLALANINE AMMONIUM LYASE (PAL), CHALCONE SYNTHASE (CHS), dihydroflavonol 4-reductase (DFR) and GLUTATHIONE-S-TRANSFERASE (GST; see Figure 1 for full enzyme names). Both factors depend on a BHLH partner that might be present constitutively (Borevitz et al., 2000; Zimmermann et al., 2004). The seed-specific R2R3-MYB factor TRANSPARENT TESTA2 (TT2/MYB123) (Nesi et al., 2001) also needs the interaction with a BHLH factor, namely TT8/BHLH42 (Nesi et al., 2000), to activate the target genes DFR, BANYULS (BAN) and the multidrug and toxic compound extrusion (MATE)-type transporter TT12.
Recently, the A. thaliana R2R3-MYB factor MYB12 was identified as a flavonol-specific regulator of flavonoid biosynthesis (Mehrtens et al., 2005) that activates in parallel CHS, CHALCONE ISOMERASE (CHI), FLAVANONE 3-HYDROXYLASE (F3H) and FLAVONOL SYNTHASE 1 (FLS1). These four flavonol biosynthesis genes are co-regulated in A. thaliana (Hartmann et al., 2005) and are required for the formation of the basic flavonol aglycon. MYB12, like the homologous Zea mays factor P, does not need a BHLH partner for activation and is suggested to bind similar cis-element(s) in the promoters of different target genes (Mehrtens et al., 2005).
There is a lot of apparent structural redundancy among the R2R3-MYB factors that is intensively studied. A prominent example represents the three highly sequence-related factors GLABROUS1 (GL1/MYB0), WEREWOLF (WER/MYB66) and MYB23 which build subgroup 15 (SG15) of the R2R3-MYB family (Kranz et al., 1998; Stracke et al., 2001). WER/MYB66 and GL1/MYB0 are functionally equivalent proteins (Lee and Schiefelbein, 2001) that display their different biological functions in root hair and trichome formation, respectively, only because of their different spatial expression patterns (reviewed in Schiefelbein, 2003). Furthermore, MYB23 has functions redundant to or overlapping with GL1/MYB0 in controlling the initiation of trichome development (Kirik et al., 2001). Another recently published example for redundant R2R3-MYB function is the subgroup 14 (SG14), covering the REGULATORS OF AXILLARY MERISTEMS proteins RAX1/MYB37, RAX2/MYB38 and RAX3/MYB84 (Muller et al., 2006), homologous to the tomato (Solanum lycopersicum) BLIND gene (Schmitz et al., 2002) controlling the formation of lateral meristems in different, but overlapping zones along the shoot axis.
We studied functional redundancy and differential spatial expression characteristics of subgroup 7 (SG7) of the R2R3-MYB factors from A. thaliana in the seedling. Subgroup 7 includes the factors MYB11, MYB12 and MYB111 which all display amino acid sequence similarity to ZmP. We show that all members of SG7 are flavonol-specific transcriptional regulators and demonstrate that the final flavonol accumulation pattern is the result of the additive expression patterns of these three factors. Our results indicate that the detailed composition of the flavonols that accumulate in different parts of the A. thaliana seedling depends on the differential (tissue- or cell-type-specific) responsiveness of genes that encode flavonol glycosidases, and other enzymes of the downstream part of the biogenesis, to SG7 R2R3-MYB factors.
Results
Identification of potential target genes by transfection experiments
To test whether the two MYB factors MYB11 and MYB111 are functional flavonol-specific transcriptional regulators, their activation potential was tested in co-transfection experiments using A. thaliana protoplasts. Potential target gene promoters were fused to the uidA ORF (GUS), and standardized β-glucuronidase activity (GUS′) was taken as a measure for target promoter activity. We assayed six promoters for their responsiveness to MYB11 and MYB111 and included MYB12 as an effector control (Figure 2). The CHS, CHI, F3H and FLS1 gene promoters were responsive to all three assayed R2R3-MYB transcription factors. MYB11 and MYB111 show the highest transactivation capacity for CHS with a 36- and 399-fold induction, respectively. Generally, MYB111 displayed stronger transactivation than MYB11. Neither the flavonoid 3′-hydroxylase (F3′H) nor the DFR gene promoters were significantly responsive to MYB11, MYB12 or MYB111 in this assay system. These results show that MYB11, MYB111 and MYB12 have the potential to activate the four flavonol biosynthesis genes required for the formation of the flavonol aglycon.
Figure 2. Co-transfection analysis of target gene specificities in At7 protoplasts.

Results from co-transfection experiments in A. thaliana protoplasts. Promoter fragments of the CHS, CHI, F3H, FLS, F3′H and DFR genes (reporters) were assayed for their responsiveness to the effectors (a) MYB11 (b) MYB111 and (c) MYB12, respectively. The reporter constructs are as described in Mehrtens et al. (2005). The figure shows GUS′ activity resulting from the influence of tested effector proteins on different reporters. The values above or beside the error bars indicate fold induction values. The mean value of luciferase activity was 6094 relative luminescence units (RLU) μg protein−1 sec−1 using MYB11 as effector, 1825 RLU μg protein−1 sec−1 with MYB111 and 6800 RLU μg protein−1 sec−1 with MYB12.
Identification and characterization of R2R3-MYB SG7 gene mutants
To examine whether MYB11 and MYB111 are flavonol-specific regulators in planta, we isolated Col-0 plants with mutant alleles of these factors by reverse genetics. A MYB11 and a MYB111 mutant line with T-DNA insertions in the second and third exon, respectively, were identified (Figure 3). In addition, a homozygous myb12 mutant carrying a null allele (myb12-1f) was used. The homozygous single-mutants are designated in the following by myb11, myb12 and myb111, respectively.
Figure 3. Wild-type and mutant alleles of R2R3-MYB SG7 genes.

(a) SALK077068 line with T-DNA insertion in At3g62610/MYB11. The mutant allele contains a premature Stop codon at codon position 79 of the MYB11 open reading frame that encodes for 343 amino acids in the wild type.
(b) GABI-Kat291D01 line with a T-DNA insertion in the third exon of At5g49330/MYB111 at amino acid position 204 of 342.
(c) myb12-1f knock-out line (Mehrtens et al., 2005). In each panel of (a)–(c) the exon/intron structure is depicted, where black boxes indicate coding regions and thin black lines symbolize non-coding regions. Positions of T-DNA insertions are given as vertical black lines; primers used in PCR genotyping are indicated by arrows and named. See Experimental procedures for primer sequences.
(d) Results from RT-PCR showing the expression of ACT2, MYB11 and MYB111 in 5-dag A. thaliana wild type and SG7 triple mutant seedlings, indicating that myb11 and myb111 are null alleles.
(e) Multiple alignment of SG7 R2R3-MYB proteins. Amino acids identical in all three proteins are marked black, amino acids found in two proteins are marked in gray. The R2 and R3 MYB domains as the SG7 motif are marked according to Stracke et al. (2001).
Since the three sequence-related R2R3-MYB gene products (Figure 3e) seem to have similar functional activity, we included double mutants and the triple mutant in our analyses. The mutants myb11 myb12, myb11 myb111, myb12 myb111 and the triple mutant myb11 myb12 myb11 myb111 did not show any visible difference in comparison to Col-0 wild-type plants when grown under greenhouse conditions.
Expression analysis of R2R3-MYB SG7 genes in developing seedlings
To determine SG7 gene transcript levels in developing A. thaliana seedlings, quantitative PCR (qPCR) analyses were performed (Figure 4b). In order to discriminate between the three main zones of flavonol accumulation, wild-type seedlings at 5 days after germination (dag) were dissected into three parts (Figure 4a), namely the cotyledons with a small part of the upper hypocotyl (designated C), the hypocotyl-root transition zone and the upper part of the root (H/TZ), and the lower part of the root including the root tip (R). Additionally, whole seedlings (S) were analyzed. MYB11 transcripts were detected at low levels in all seedling samples. In contrast, MYB12 and MYB111 transcripts displayed differential expression patterns with reciprocal expression in roots and cotyledons: MYB12 transcript levels were predominantly detected in roots where MYB111 transcripts were hardly detectable, and MYB111 transcripts showed higher levels in cotyledons where MYB12 transcript levels were very low. The expression of the three SG7 genes was further examined by promoter:GUS fusion analysis. Transgenic A. thaliana plants expressing GUS under the control of 893-bp MYB11 (ProMYB11:GUS), 1467-bp MYB12 (ProMYB12:GUS) and 1074-bp MYB111 promoter fragments (ProMYB111:GUS), respectively, were studied (Figure 4c). MYB11 promoter activity was found at the region of the apical meristem, the primary leaves, the apex of cotyledons, at the hypocotyl–root transition, the origin of lateral roots and the root tip as well as the vascular tissue of lateral roots. MYB12 promoter activity was predominantly detected in the root, in the vascular tissue of the hypocotyl–root transition zone and at low levels at the region of apical meristem and the apex of cotyledons. MYB111 promoter activity was restricted to the cotyledons and primary leaves. Taken together, these data indicate that the R2R3-MYB SG7 member MYB12 is mainly expressed in the root, while MYB111 is mainly expressed in cotyledons. MYB11 seems to be expressed at well-defined domains distributed around the developing seedling. These results were obtained with several independent promoter:GUS lines for each promoter, indicating that the observed staining pattern is not due to position effects of the insertion of the transgene.
Figure 4. MYB11, MYB12 and MYB111 are differentially expressed in distinct parts of 5-dag A. thaliana Col-0 wild type seedlings.
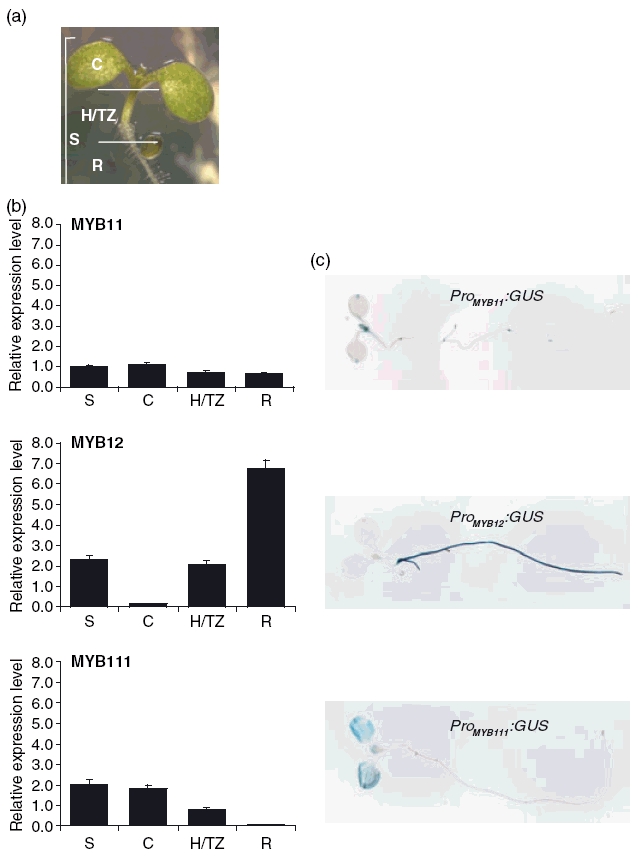
(a) Arabidopsis thaliana seedlings were grown on vertically oriented MS-agar plates and cut into three parts as indicated by the white lines. These three parts represent the different regions of main flavonol accumulation and are referred to as C (cotyledons), H/TZ (hypocotyl/transition zone) and R (root). The whole, uncut seedling is referred to as S.
(b) Quantitative PCR results showing relative expression levels referred to the MYB11 transcript level in whole seedlings (set as one). Complementary DNA concentrations were normalized to the 18S rRNA transcript levels as standard. Expression was determined in triplicate measurements in two independent biological replicates.
(c) Representative whole mount GUS stainings of ProMYB11:GUS, ProMYB12:GUS and ProMYB111:GUS transformants.
Screening for SG7 factors’ target genes
To screen for additional SG7 MYB target genes we used Affymetrix ATH1 GeneChips (http://www.affymetrix.com/), looking for genome-wide changes in transcript levels caused by the absence of R2R3-MYB SG7 gene activity. Hybridizations were conducted with cDNA samples derived from roots of 5-dag Col-0 wild-type seedlings and myb11 myb12 myb111 seedlings. Since the predominant R2R3-MYB SG7 gene expressed in roots is MYB12, this experimental design mainly addresses genes regulated by MYB12 and avoids at least in part complications caused by the activation of other phenylpropanoid biosynthesis genes in the aerial part of the seedling. When evaluating expression levels for reduction in the triple mutant compared to wild type, a number of ‘downregulated genes’ were identified (see Table 1). These include genes encoding known flavonoid biosynthetic enzymes (CHS, At5g13930; FLS1, At5g08640; CHI, At3g55120; F3′H, At5g07990; F3H, At3g51240) and one encodes one of four 4-coumarate-CoA ligase isoenzymes (4CL3, At1g65060) which act in the general phenylpropanoid pathway (see Figure 1). In addition to genes encoding enzymes of flavonol aglycon biosynthesis and a number of unknown genes, several genes annotated to encode glycosyltransferases (At5g17040, At2g22590 and At4g15480) were among the candidates for being responsive to R2R3-MYBs of SG7. Since flavonols accumulate in their glycosylated form, the detection of these glycosyltransferase genes fits well to the expectations for transcriptional control of the production of specific flavonol derivatives.
Table 1.
Screening for SG7 MYB candidate target genes by transcriptome analysis. Expression data obtained from ATH1 GeneChip hybridizations with RNA from roots of 5-dag Col-0 wild type and myb11 myb12 myb111 triple mutant seedlings. Only genes showing a ≥ 2.5-fold reduction in the mutant and an absolute expression values of ≥ 20 in wild type roots were considered. The identified genes are referred to as candidates since the experiment was designed as a screening transcriptome approach that is not sufficient for detailed statistical analyses value: absolute signal intensity, P: signal is present, A: signal is absent
| ATH1 code | AGI code | Wild-type root value | Triple mutant root value | ‘Fold change’ | Name, annotation | ||
|---|---|---|---|---|---|---|---|
| 247463_at | At5g62210 | 374.1 | P | 1.9 | A | 196.9 | Embryo-specific protein 3-related; membrane anchored |
| 251182_at | At3g62600 | 1026.3 | P | 22.9 | P | 44.8 | DNAJ heat shock family protein |
| 250207_at | At5g13930 | 4251.2 | P | 137.7 | P | 30.9 | CHS; chalcone synthase (TT4) |
| 246467_at | At5g17040 | 33.9 | P | 1.6 | A | 21.2 | UDP-glucoronosyl/UDP-glucosyl transferase family protein |
| 265290_at | At2g22590 | 96.4 | P | 6.0 | A | 16.1 | Glycosyltransferase family protein (UGT91A1) |
| 250533_at | At5g08640 | 1176.9 | P | 75.9 | P | 15.5 | FLS1; flavonol synthase |
| 251827_at | At3g55120 | 895.7 | P | 63.7 | P | 14.1 | CHI; chalcone isomerase (TT5) |
| 248625_at | At5g48880 | 656.7 | P | 65.7 | P | 10.0 | Acetyl-CoA C-acyltransferase 1 / 3-ketoacyl-CoA thiolase 1 (PKT1) |
| 261907_at | At1g65060 | 299.1 | P | 36.8 | P | 8.1 | 4CL3; 4-coumarate:CoA ligase 3 |
| 245560_at | At4g15480 | 220.8 | P | 29.2 | A | 7.6 | UDP-glucoronosyl/UDP-glucosyl transferase family protein (UGT84A1) |
| 250467_at | At5g10100 | 21.7 | P | 3.3 | A | 6.6 | Trehalose-6-phosphate phosphatase |
| 250558_at | At5g07990 | 327.8 | P | 51.2 | P | 6.4 | F3′H; flavonoid 3′-monooxygenase/flavonoid 3′-hydroxylase (TT7) |
| 251191_at | At3g62590 | 28.6 | P | 6.4 | A | 4.5 | Lipase class 3 family protein |
| 245567_at | At4g14630 | 26.2 | P | 5.9 | A | 4.4 | Germin-like protein (GLP9) |
| 250794_at | At5g05270 | 586.9 | P | 132.7 | P | 4.4 | Chalcone-flavanone isomerase family protein |
| 266578_at | At2g23910 | 409.6 | P | 102.9 | P | 4.0 | Cinnamoyl-CoA reductase-related protein |
| 250620_at | At5g07190 | 50.9 | P | 13.3 | A | 3.8 | Embryo-specific protein 3 |
| 265422_at | At2g20800 | 32.7 | P | 9.8 | A | 3.3 | Pyridine nucleotide-disulphide oxidoreductase family protein |
| 256940_at | At3g30720 | 26.7 | P | 8.2 | P | 3.3 | Expressed protein |
| 266900_at | At2g34610 | 73.3 | P | 23.4 | P | 3.1 | Expressed protein |
| 263268_at | At1g33860 | 30.1 | P | 9.7 | A | 3.1 | Hypothetical protein |
| 253669_at | At4g30000 | 37.1 | P | 12.6 | P | 2.9 | Dihydropterin pyrophosphokinase, putative dihydropteroate synthase |
| 248564_at | At5g49700 | 24.1 | P | 8.3 | A | 2.9 | DNA-binding protein-related |
| 252123_at | At3g51240 | 2102 | P | 728 | P | 2.9 | F3H; flavanone 3-hydroxylase (TT6) |
| 253195_at | At4g35420 | 94.7 | P | 32.9 | P | 2.9 | Dihydroflavonol 4-reductase family protein |
| 252215_at | At5g34930 | 21.3 | P | 7.7 | P | 2.8 | Arogenate dehydrogenase |
| 266851_at | At2g26820 | 24.3 | P | 8.8 | A | 2.8 | Avirulence-responsive family protein |
| 261773_at | At1g76250 | 28.5 | P | 10.4 | A | 2.7 | Expressed protein |
| 258241_at | At3g27650 | 52.9 | P | 19.4 | A | 2.7 | Lateral organ boundaries (LOB) domain protein 25 (LBD25) |
| 266618_at | At2g35480 | 27.4 | P | 10.2 | A | 2.7 | Expressed protein |
| 259136_at | At3g05470 | 20.6 | P | 7.7 | P | 2.7 | Formin homology 2 domain-containing protein |
| 244934_at | Atcg01080 | 57.3 | P | 21.5 | A | 2.7 | NADH dehydrogenase ND6 (chloroplast encoded, Atc) |
| 252128_at | At3g50870 | 20.3 | P | 7.7 | P | 2.6 | Zinc finger (GATA type) family protein, GATA transcription factor 3 |
| 260558_at | At2g43600 | 37.6 | P | 14.4 | P | 2.6 | Glycoside hydrolase family 19 protein |
| 253638_at | At4g30470 | 340.2 | P | 132 | P | 2.6 | Cinnamoyl-CoA reductase-related protein |
| 247020_at | At5g67020 | 22.1 | P | 8.6 | A | 2.6 | Expressed protein |
| 260643_at | At1g53270 | 42.6 | P | 17 | P | 2.5 | ABC transporter family protein |
| 256376_s_at | At1g66690 | 25.2 | P | 10.1 | P | 2.5 | S-adenosyl-l-methionine:carboxyl methyltransferase family protein |
| 261496_at | At1g28360 | 26.4 | P | 10.7 | P | 2.5 | ERF domain protein 12 (ERF12) |
Value is the absolute signal intensity; P, signal is present; A, signal is absent.
Confirmation of candidate target genes
We used qPCR and co-transfection assays to verify the results of the transcriptome analysis screening and to check whether SG7 R2R3-MYB factors are able to directly activate the promoters of three candidate genes identified. The most responsive gene At5g62210 which encodes a membrane anchored protein of unknown function and two genes coding for the glycosyltransferases UGT91A1 (At2g22590) and UGT84A1 (At4g15480) which displayed the highest absolute signal values among all UGTs in the wild-type sample were chosen. All three putative target genes displayed strongly reduced transcript levels in the triple mutant (Figure 5a), verifying the results obtained from the ATH1 chip hybridizations. We also tested the responsiveness of the gene promoters (ProAt5g62210, ProAt2g22590 and ProAt4g15480) to SG7 factors in co-transfection experiments using At7 protoplasts (Figure 5b). All three candidate promoters were highly responsive to MYB12, MYB111 and MYB11. In conclusion, the results from the screening are validated by qPCR data and the transient in vivo assay. As already observed for the promoters of the genes required for flavonol aglycon biosynthesis, the activating potential decreases from MYB12 via MYB111 to MYB11.
Figure 5. Confirmation of candidate SG7 R2R3-MYB target genes.

(a) Confirmation of microarray results. Results from qPCR showing the relative expression of At5g62210, At2g22590 and At4g15480 in roots of A. thaliana Col-0 wild type and myb11 myb12 myb111 triple mutant 5-dag seedlings. Columns represent the relative expression levels of distinct target genes tested. Values were normalized to 18S rRNA and relative expression levels were referenced to the amount of mRNA in the wild-type sample. The values above the bars indicate the fold increase in the mutant.
(b) Co-transfection analysis of activation potential in At7 protoplasts. Results from co-transfection experiments in A. thaliana protoplasts. Promoter fragments of At5g62210, At2g22590, At4g15480 and DFR, CHS (as controls) were tested on their responsiveness to MYB11, MYB12 and MYB111 as effector. The figure shows absolute GUS′ activity resulting from the influence of MYB protein on the different reporters. The mean value of luciferase activity was 2516 RLU μg protein−1 sec−1 for MYB11, 3366 RLU μg protein−1 sec−1 for MYB12 and 2350 RLU μg protein−1 sec−1 for MYB111.
Flavonol accumulation analysis of mutant seedlings and identification of flavonol derivatives
To be able to correlate gene expression data with the accumulation of flavonols in different parts of the seedling, we analyzed the secondary metabolite constituents of the single, double and triple mutant seedlings by high-performance liquid chromatography (HPLC). Phenylpropanoid compounds were extracted from the SG7 myb mutants, from Col-0 wild type, and from two transparent testa (tt) mutants with Col-0 genetic background. chs/tt4-2YY6, a mutant that lacks flavonoids, and f3′h/tt7-GK349F05, a mutant lacking quercetins (see Figure 1).
Clearly detectable HPLC peaks in the wild-type sample were numbered from 1 to 9 with increasing retention times as shown in Figure 6(a). In addition, the extracts were analyzed by high-performance thin layer chromatography (HPTLC; Figure 6b). The fluorescence color of the diphenylboric acid 2-aminoethylester (DPBA)-stained phenylpropanoids provides information about their basic chemical structure. In the Col-0 sample, three kaempferol derivatives (green), two quercetin derivatives (orange) and up to seven sinapate derivatives (blue) were detectable.
Figure 6. Metabolic analyses of methanolic extracts of mutant seedlings.
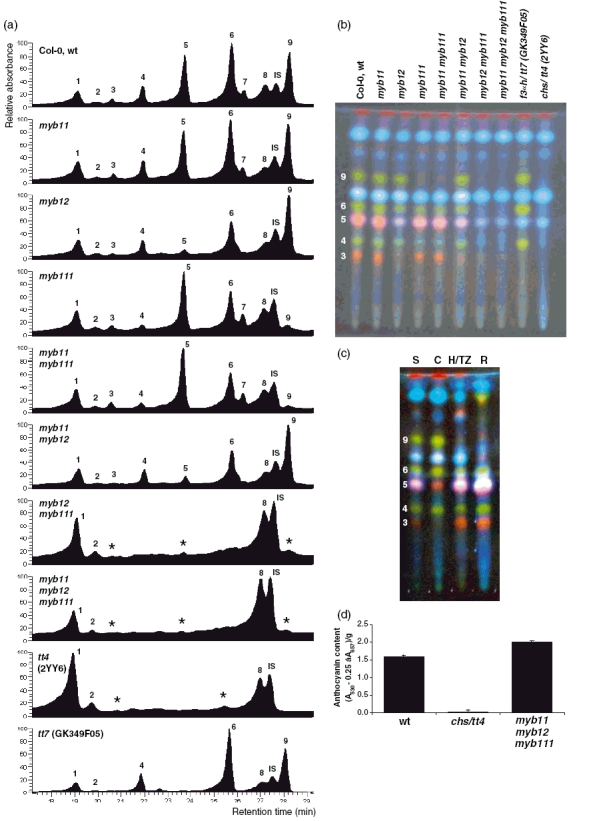
(a) Typical representative HPLC-PDA chromatograms (monitored by absorbance at 354 nm) obtained from 80% methanolic extracts of 5-dag A. thaliana seedlings of the indicated genotypes. Peaks are numbered in the chromatogram of Col-0 wild-type seedlings, where IS is the abbreviation for the internal standard used for quantification, the digitoflavone luteolin-7-glycoside. Peaks were classified by UV spectral analysis as corresponding to flavonol or sinapate derivatives. Minor peaks with UV spectra that do not fit to the known spectrum of flavonols are indicated by asterisks.
(b) Representative result of the same methanolic extracts analyzed in (a) after separation by HPTLC on silica gel-60 plates followed by DPBA staining. Pictures were taken under UV illumination. Color key: green, kaempferol derivative; orange, quercetin derivative; faint blue, sinapate derivative; pink, overlapping quercetin and sinapate derivatives; dark red, chlorophyll. Numbers given at the left correspond to the peak numbers as mentioned in (a). Names of identified structures are indicated in Table 2.
(c) The HPTLC analysis of methanolic extracts showing different flavonoid compositions in distinct parts of 5-dag A. thaliana Col-0 wild-type seedlings. Peak numbers are as in (a) and (b). Arabidopsis thaliana seedlings were grown and cut as described in the legend of Figure 4: C, cotyledons; H/TZ, hypocotyl/transition zone; R, root; S, whole uncut seedling.
(d) Photometric determination of the anthocyanin content in acidic methanolic extracts of A. thaliana seedlings: A530, absorption at 530 nm; A657, absorption at 657 nm.
Flavonol derivatives detected by HPLC and HPTLC were correlated with each other by HPLC analysis of HPTLC-separated compounds that had been re-extracted from the plates. The results are summarized in Figure 6(b) by numbering the spots on the HPTLC plate with the peak numbers from HPLC. Subsequently, the chemical nature of the respective compounds was analyzed by a successive combination of HPLC–photodiode array (PDA) analyses and electrospray ionization/mass spectroscopy (ESI/MS). Sugar analyses of flavonol glycosides were achieved by gas chromatography-mass spectroscopy (GC-MS). The results including the ESI/MS mass/charge ratios are summarized in Table 2. Finally, the combination of the various chromatographic and spectroscopic methods, and comparison with published data (see legend of Table 2) allowed the identification of two quercetin derivatives (peak 3, quercetin 3-O-[(rhamnosyl) glucoside]-7-O-rhamnoside; peak 5, quercetin 3-O-glucoside-7-O-rhamnoside) and three kaempferol derivatives (peak 4, kaempferol 3-O-[(rhamnosyl) glucoside]-7-O-rhamnoside; peak 6, kaempferol 3-O-glucoside-7-O-rhamnoside; peak 9, kaempferol 3-O-rhamnoside-7-O-rhamnoside). This identification also fits the expected compound accumulation patterns for the tt mutants analyzed, that are the lack of flavonols in chs/tt4-2YY6 and the lack of quercetins in f3′h/tt7-GK349F05.
Table 2.
Identification of flavonol derivatives in methanolic extracts of Col-0 seedlings. Structure identification of flavonol derivatives extracted from HPTLC plates was performed using a successive combination of HPLC-PDA-ESI/MS. Sugar analysis of flavonol glycosides was performed with GC/MS. Flavonol derivatives were identified by comparison with MS results and known flavonol glycosides from the literature (Graham et al., 1998; Jones et al., 2003; Routaboul et al., 2006; Stobiecki et al., 2006;Tohge et al., 2005). RT: retention time, ESI/MS: ElectroSpray Ionization/Mass Spectrometry, m/z: mass/charge ratio, MSn: tandem mass spectrometry, qr: quercetin, km: kaempferol, glc: glucose, rha: rhamnose, n.a.: not analyzed, IS: internal standard. aDetected in MS and/or in tandem mass spectrometry (MSn) data
| Peak | RT (min) | ESI/MS (m/z) | Fragmenta (m/z) | Compound name |
|---|---|---|---|---|
| 1 | 18.85 | 387 [M + H]+ 409 [M + Na]+ | n.a. | Sinapate glucoside |
| 2 | 19.70 | 773 [2M + H]+ 795 [2M + Na]+ | n.a. | Sinapate derivative |
| 3 | 20.40 | 757 [M + H]+ 779 [M + Na]+ | 303 [qr + H]+ 449 [qr + rha + H]+ 611 [qr + rha + glc + H]+ | Quercetin [rhamnosyl-glucoside]-rhamnoside |
| 4 | 21.75 | 741 [M + H]+ 763 [M + Na]+ | 287 [km + H]+ 433 [km + rha + H]+ 595 [km + rha +glc + H]+ | Kaempferol [rhamnosyl-glucoside]-rhamnoside |
| 5 | 23.50 | 611 [M + H]+ 633 [M + Na]+ | 303 [qr + H]+ 449 [qr + rha + H]+ | Quercetin glucoside-rhamnoside |
| 6 | 25.45 | 595 [M + H]+ 617 [M + Na]+ | 287 [km + H]+ 433 [km + rha + H]+ | Kaempferol glucoside-rhamnoside |
| 7 | 25.95 | 625 [M + H]+ 647 [M + Na]+ | 339 [IR + Na]+ 501 [IR + glc + Na]+ | Isorhamnetin glucoside-rhamnoside |
| 8 | 26.90 | 681 [M + H]+ 703 [M + Na]+ | n.a. | Sinapate derivative |
| 9 | 27.95 | 579 [M + H]+ 601 [M + Na]+ | 287 [km + H]+ 433 [km + rha + H]+ | Kaempferol rhamnoside-rhamnoside |
| IS | 27.30 | 449 [M + H]+ | n.a. | Luteolin 7-glycoside (internal standard) |
RT, retention time; ESI/MS, electrospray ionization/mass spectrometry; m/z, mass/charge ratio; qr, quercetin; km, kaempferol; glc, glucose; rha, rhamnose; n.a., not analyzed; IS, internal standard.
Detected in MS and/or in tandem mass spectrometry data.
The data show a selective reduction of specific flavonol derivatives in the different mutants, indicating that MYB12 and MYB111 direct the accumulation of flavonol derivatives that differ with respect to hydroxylation and glycosylation patterns.
HPTLC profiling of different parts of the wild-type seedling
To investigate whether the expression domains of the SG7 MYB genes display differential secondary metabolite accumulation patterns, we analyzed extracts from the three parts of wild-type seedlings described above (C, H/TZ, R,S; see Figure 4a) by HPTLC/DPBA staining. Clear differences in the pattern of accumulation of phenylpropanoid compound in the different parts of the seedlings were observed (Figure 6c). The kaempferol–rhamnoside–rhamnoside band (peak 9) is absent in the root, while the quercetin–[(rhamnosyl) glucoside]–rhamnoside band (peak 3) is drastically reduced in the cotyledons. In the hypocotyl–root transition zone and the root additional compounds become detectable. These compounds seem to be under-represented in the seedling (S) sample due to dilution effects and were therefore not covered by the compound characterization described above.
The metabolic profiles detected for the seedling parts are in accordance with the accumulation data obtained from mutant seedlings and the expression patterns of the different SG7 factors. For example, MYB111 expressed in cotyledons controls the accumulation of kaempferol–rhamnoside–rhamnoside (peak 9); peak 9 is found in cotyledons but not in other parts of the seedlings, and is missing in the myb111 mutant.
In summary, the accumulation data indicate that there is organ specificity with regard to accumulation of phenylpropanoid in the seedling that is to a large extend controlled by SG7 R2R3-MYB factors.
Analysis of anthocyanin content
Based on the information about the biochemical pathway (see Figure 1), we reasoned that changes in the activity of SG7 factor may affect the formation of anthocyanins in the seedling because CHS is a target gene of the SG7 factors and is required for anthocyanidin biosynthesis. Anthocyanins are present in the Col-0 wild-type seedling but are absent from the chs/tt4-2YY6 mutant (Figure 6d). Anthocyanins were clearly detectable in the myb11 myb12 myb111 mutant seedlings, demonstrating that CHS and DFR are active in the triple myb mutant. The level to which anthocyanins accumulate in the triple myb mutant is slightly but reproducibly higher than in the wild type, indicating that precursors usually channeled to flavonols are used to form anthocyanins. We concluded that in the seedling part which is programmed to synthesize anthocyanins the flavonoid biosynthesis genes are under the control of factors different from the R2R3-MYBs of SG7.
In situ flavonoid staining of mutant seedlings
The distribution of flavonol accumulation in the various myb mutant and wild-type seedlings was visualized with DPBA and imaged by epifluorescence microscopy. Representative pictures are shown in Figure 7. In the wild-type, the cotyledons show intense orange fluorescence indicating a massive accumulation of flavonols. Also the hypocotyl, the hypocotyl–root transition zone, the root vascular tissue and the root tip display orange staining indicative of flavonols. The chs/tt4-2YY6 and f3′h/tt7-GK349F05 mutants were included as controls and either do not show any staining (absence of flavonols in the chs/tt4 mutant) or display greenish kaempferol-specific staining (f3′h/tt7 mutant). The triple mutant myb11 myb12 myb111 essentially displays staining identical to that of the chs/tt4-2YY6 mutant, confirming the absence of flavonols in seedlings that lack R2R3-MYB SG7 activity.
Figure 7. Flavonol staining in wild-type and mutant seedlings.
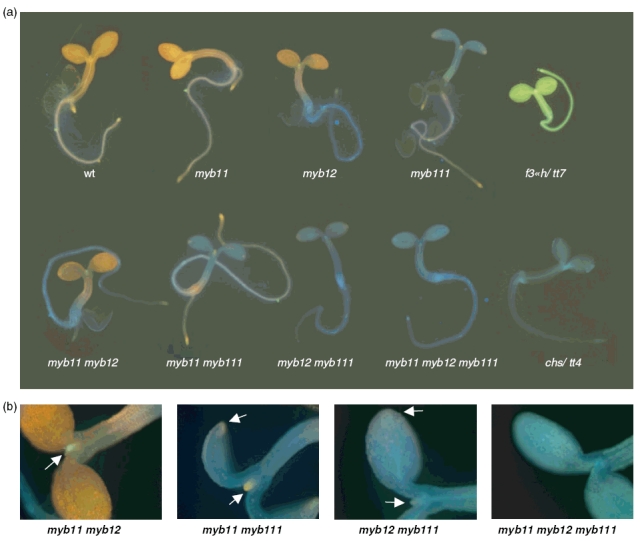
(a) Flavonols in intact, norflurazon-bleached seedlings were stained with DPBA until saturation and imaged by epifluorescence microscopy. Photographs of representative seedlings are shown.
(b) Close-ups to show accumulations of flavonol at the apical meristem region and at the tip of cotyledons, indicated by arrows. The greenish color at the apical meristem region in the myb11 myb12 mutant indicates accumulation of kaempferol derivatives, while orange indicates quercetin derivatives in the other double mutants.
Consistent with the data presented above, the myb11 seedlings did not significantly differ in flavonol accumulation from wild type. On the other hand, the myb12 myb111 double mutant showed a staining similar to that of the triple mutant with the exception of a faint orange staining at the apical meristem region, the tips of the cotyledons (Figure 7b) and in some cases at the root tip (data not shown). Clearly different spatial flavonol accumulation patterns were obtained for myb12 and myb111 seedlings. The myb12 mutant seedlings display drastically reduced flavonol levels in the root and the hypocotyl–root transition zone, while myb111 mutant seedlings lack flavonols in the cotyledons. In conclusion, the in situ visualization of flavonols in the seedling clearly supports the differential accumulation of flavonols in different parts of the seedling as a function of the expression of different R2R3-MYB SG7 factors.
Discussion
In wild-type A. thaliana seedlings flavonols accumulate in three main zones: the cotyledonary node, the hypocotyl–root transition zone and the root tip (Murphy et al., 2000; Peer et al., 2001; Saslowsky and Winkel-Shirley, 2001; Sheahan and Rechnitz, 1993). The flavonol accumulation pattern we observed by in situ DPBA staining in Col-0 wild-type seedlings is in strict accordance with that found for the accumulation of aglycone flavonols in 5-day-old A. thaliana seedlings of the Landsberg erecta accession (Murphy et al., 2000; Peer et al., 2001). The chs/tt4 mutant is not able to synthesize flavonoids; consequently no flavonols are detected in seedlings containing the chs null alleles tt4-2YY6 (Col-0; Burbulis et al., 1996) or tt4-1 (Ler; Sheahan and Rechnitz, 1992). The observed faint blue coloration in tt4 seedlings is probably a result of accumulation of sinapate ester (Saslowsky et al., 2000), an interpretation that is confirmed by our HPTLC data. The myb triple mutant displayed the same lack of flavonols as a tt4 null mutant. We concluded that a lack activity of R2R3-MYB SG7 genes in seedlings causes the absence of flavonols only, while the accumulation of anthocyanins is essentially not affected. In contrast to the situation in tt4, SG7 triple mutant seedlings show anthocyanin accumulation in the seedlings (Figure 6d) and normal pigmentation of the seed produced by adult plants (data not shown). In fact, the anthocyanin level in SG7 triple mutant seedlings was slightly higher than in the wild type. This observation is consistent with a presumed rechanneling of flavonol precursors to the anthocyanin branch of the pathway which is also known from the ban mutation (Albert et al., 1997) that causes anthocyanin accumulation in the seed coat.
The SG7 triple mutant is the first described A. thaliana line that produces seedlings which specifically lack flavonols but not other flavonoids. Therefore, the mutant is a useful tool for the analyses of the functions attributed to flavonols, like their influence on light or gravity responses (Buer and Muday, 2004; Buer et al., 2006; Peer et al., 2001) or their capacity to repress bud outgrowth that affects lateral branching (Lazar and Goodman, 2006). In this biological context preliminary experiments showed no measurable altered gravitropic response, nor a distinctive branching pattern in the triple myb mutant (data not shown). This lack of phenotypes may indicate that these traits are not due to the lack of flavonols.
The apparent differential spatial accumulation pattern of flavonol obtained in myb12 and myb111 seedlings was shown to be a function of differential expression of R2R3-MYB SG7 factors. Clearly, MYB12 and MYB111 are the main regulators of flavonol biosynthesis in seedlings. There exists an obvious ‘job sharing’ between the R2R3-MYB SG7 genes in regulating similar target genes from the main flavonoid pathway required for the formation of the flavonol aglycon in different locations, that is traced back to different expression domains of the individual genes in the A. thaliana seedling. On the basis of the results discussed above, we rename the R2R3-MYB genes from SG7 as PRODUCTION OF FLAVONOL GLYCOSIDES1–3, namely PFG1/MYB12, PFG2/MYB11 and PFG3/MYB111.
SG7 R2R3-MYB target genes
Since the single myb mutants were shown to affect different flavonol derivatives, it is conceivable that the individual PFG factors also regulate different target genes that are involved in the formation of specific flavonol compounds. From the available results, particularly the metabolite analysis in the pfg mutants (Figure 6b), we assume that the synthesis of some specific flavonol glycosylates seems to be mainly controlled by one PFG transcription factor (e.g. synthesis of kaempferol-rhamnoside-rhamnoside, peak 9 by PFG3/MYB111), while others seem to be regulated by more than one PFG factors (e.g. synthesis of kaempferol–glucoside–rhamnoside, peak 6 by PFG1/MYB12 and PFG3/MYB111). However, it remains to be determined whether differences in the modification pattern in the various seedling organs are due to differences in the set of target genes of individual PFG factors. It is possible that additional organ- or tissue-specific factors positively or negatively regulate the expression of genes acting on the modification processes.
We have assayed the promoters of six different FBGs in co-transfection experiments, but we must assume that the PFG factors also control the activity of additional target genes that are involved in flavonol biosynthesis. On the basis of the biochemical phenotype (chemotype), we hypothesize that all three factors are flavonol-specific regulators and that they do not activate genes encoding enzymes with exclusive specificity for other branches of flavonoid biosynthesis. This hypothesis is supported by biochemical data from the PFG1/MYB12-overexpression line (Mehrtens et al., 2005) and the transcriptome analysis presented in this work. Nevertheless, the regulon of PFG factors is not restricted to the pathway starting with CHS and ending with FLS. The ATH1 chip hybridization results (Table 1) indicated that in addition to the flavonol aglycon biosynthesis genes also the 4CL3 gene is activated. 4-Coumaroyl-CoA synthase 3 (4CL3) catalyses one of the three enzymatic steps of the general phenylpropanoid pathway (GPP, see Figure 1). We conclude that the PFG regulon also covers parts of the genes from the GPP. Such coordinated regulation of GPP genes together with genes belonging to specific branches of the flavonoid biosynthesis pathway also occurs by PAP1/MYB75 (Borevitz et al., 2000; Tohge et al., 2005) which activates the GPP gene PAL1 and anthocyanin-specific genes, and also for MYB4 (Jin et al., 2000) which represses the GPP gene C4H and genes encoding enzymes of hydroxycinnamic acid metabolism.
F3′H was also observed as potential PFG target in the transcriptome analysis, although this gene seems not to be a target in the co-transfection assay (Figure 2). This can be explained: (i) by ‘metabolic feedback’ that takes place in planta (Jorgensen et al., 2005; Winkel-Shirley, 1999) and (ii) by the assumption that for the activation of the F3′H in At7 protoplasts an unknown additional co-factor is required that might not be present in the cultured At7 cells, or because the 1291-bp F3′H promoter fragment used in co-transfection assays does not cover the full-length promoter.
Other noteworthy putative PFG target genes are At1g53270, encoding an ABC transporter family protein, and At5g34930, encoding an arogenate dehydrogenase. The ABC transporter might be able to facilitate the transport of flavonols across the tonoplast. In the study of Tohge et al. (2005) two transporters encoded by the genes At1g34580 and At4g04750, as well as the MATE-type transporter TT12 (Debeaujon et al., 2001), which has been proposed to load pro-vacuoles with flavonoid intermediates required for proanthocyanin biosynthesis, were identified as putative targets of the anthocyanin-specific regulator PAP1/MYB75. Arogenate dehydrogenases are known to be involved in the biosynthesis of aromatic amino acids (Lingens and Keller, 1983), covering the synthesis of phenylalanine, being the entry substrate of the GPP. It seems that the transcription factor regulons reach from the phenylalanine biosynthesis, GPP genes, the FBGs required for aglycon formation, genes for modifying functions like glycosidases (see below) down to transporters which are potentially specific for different flavonoid classes. Obviously, this hypothesis has to be proven in the future by analyzing mutants in the respective genes for their chemotype.
Regarding the genes encoding functions that modify the flavonol aglycon, the genes that code for the glycosyltransferases UGT91A1 and UGT84A1 (Bowles, 2002) were confirmed to be targets of all three PFGs (Figure 5). Since the degree and function of glycosylation of flavonols have not yet been characterized in detail, and genetic characterization of most glycosyltransferases, as well as data about their localization and spatial and temporal regulation are still missing, we can only speculate about the function of the UGTs controlled by PFG factors. The two glycosyltransferases UGT91A1 and UGT84A1 might be involved in the glycosylation of specific flavonols or flavonol-glycosides (see Figure 1). Similar biochemical functions were shown for UGT73C6 and UGT78D1 which transfer sugar moieties to specific flavonols or flavonol-glycosides, for UGT78D1 which catalyzes the transfer of rhamnose to the 3-OH position of quercetin and kaempferol, whereas UGT73C6 catalyzes the transfer of glucose to the 7-OH position of flavonol 3-O-glycosides (Jones et al., 2003). Recombinant UGT84A1 has been analyzed before in vitro and was shown to form glucose-esters of sinapic acid and other cinnamic acids (Lim et al., 2001; Messner et al., 2003), indicating an involvement of this UGT in phenylpropanoid metabolism.
Regulatory principles of flavonoid biosynthesis network
It is getting increasingly clear that in the regulation of flavonoid biosynthesis it is the rule (and not the exception) that a single target gene is controlled by a fairly high number of transcription factors. In many cases, these factors are members of the same transcription factor gene family and share the same DNA-binding domain. TT2/MYB123 is known to regulate the expression of DFR and BAN (Nesi et al., 2001) and potentially other steps towards proanthocyanidin biosynthesis in the seed coat, PAP1/MYB75 regulates PAL, CHS and DFR (Borevitz et al., 2000) and other genes required for anthocyanin biosynthesis (Tohge et al., 2005), while DFR as well as the ANTHOCYANIDIN SYNTHASE (ANS/TT18) are targets of MYB32 (Preston et al., 2004).
This network of transcriptional control is thought to be integrated at the level of the target gene by addressing similar or (at least when a single target gene is considered) identical cis-acting elements. In the case of R2R3-MYB transcription factors this cis-acting element is the MYB recognition element (MRE) (Feldbruegge et al., 1997; Hartmann et al., 2005) that was described previously as Box-I (Hartmann et al., 1998; Kaiser and Batschauer, 1995; Schulze-Lefert et al., 1989), and that is also related to the P box (Grotewold et al., 1994; Lois et al., 1989). The MRE consensus sequence 5′-AcCTACCa-3′ is conserved among the promoters of the coactivated A. thaliana FBGs CHS, CHI, F3H and FLS1 (Hartmann et al., 2005) and was also detected in the CHS gene promoters of a number of different plant species (Hartmann et al., 1998). This cis-acting element is also found at least once in the −600-bp to −1-bp regions of the promoters of most of the putative SG7 factors target genes listed in Table 1 (data not shown). We hypothesize that the MRE is recognized by the R2R3-MYB DNA-binding domain present in the R2R3-MYB factors, potentially with a certain subgroup specificity. The different expression patterns of the various R2R3-MYB genes which vary with respect to their individual temporal, spatial and stimulus-responsive transcript accumulation patterns allow us to explain the complex co-ordination of the different gene sets required for formation of a given (phenylpropanoid) compound. This adds an important aspect to the understanding of differential gene regulation. The principle of a ‘one cis-element – many factors’ type of regulation is possibly a feature of the large transcription factor gene families found in plants. This feature may turn out to significantly complicate bioinformatic prediction of target gene/transcription factor relationships.
Obviously, the pattern and timing of gene activity of the regulatory genes determine where the transcription factors can act as such. The differential expression of several functionally identical factors seems to be a more successful evolutionary approach to the creation of complex compound accumulation patterns than an increased complexity of the activity pattern of a single factor gene. This hypothesis is supported by the view that cis-elements are a primary target of natural selection. Promoter evolution acts not only at the level of (enzyme-coding) target genes, but also (after gene duplication) at the level of transcription factor genes.
Clearly, the promoters of the regulatory PFG1/MYB12, PFG2/MYB11 and PFG3/MYB111 genes have acquired different responsiveness to spatial (cell-type specific) information. Now, the goal is to determine what controls the regulator. To achieve this, the application of innovative technology like GFP-based fluorescence-activated cell sorting of different cell types combined with gene chip analyses, that has been shown to work for roots (Birnbaum et al., 2003), should be helpful.
Experimental procedures
Standard molecular biology methods
Standard molecular biology techniques were carried out essentially as described by Sambrook et al. (1989). All plasmid constructions were verified by DNA sequencing. The DNA sequencing was performed using BigDye terminator chemistry on ABI 377 and 3730 sequencers (Applied Biosystems, http://www.appliedbiosystems.com/). Oligonucleotides were purchased from Metabion (http://www.metabion.com/), or Invitrogen (http://www.invitrogen.com/).
Plant material
All mutant seed stocks were in the A. thaliana accession Columbia-0 genetic background. Mutant alleles were identified from the SALK (Alonso et al., 2003) and GABI-Kat (Rosso et al., 2003) populations. Seed stocks were obtained from Nottingham Arabidopsis Stock Centre (NASC) and GABI-Kat, respectively. The myb11 mutant carries a T-DNA insertion in At3g62610/MYB11/PFG2 (SALK077068, NASC ID N577068), the myb111 mutant carries a T-DNA insertion in At5g49330/MYB111/PFG3 (GK291D01) and the tt7-GK349D05 mutant contains an insertion in At5g07990/F3′H (GK349D05; Rosso et al., 2003). The myb12-1f and tt4-2YY6 mutants were described before (Mehrtens et al., 2005; Saslowsky et al., 2000). Sequences of characterized alleles were submitted to GenBank (DQ178603 and DQ178604 for the myb111-GK291D01 allele, DQ178605 and DQ178606 for the myb11-SALK077068 allele and DQ224277 for the myb12-1f allele). Homozygous double and triple mutants were produced by crossings and the progenies were analyzed using PCR markers and cleaved amplified polymorphic sequence (CAPS) markers that distinguish between mutant and wild-type alleles (see).
Growth conditions
Surface-sterilized A. thaliana seeds were sown on 0.5× MS/1.5% sucrose/0.8% agar plates, kept for 2 days at 4°C in the dark, and then transferred to a phytochamber with 16 h of light illumination per day at 22°C. Plates were set up in vertical orientation and at the fifth day after germination (6 days after transfer into the light) seedlings were harvested.
Transfection experiments
Protoplast isolation and transfection experiments for the detection of transient expression were performed as described by Mehrtens et al. (2005). The flavonoid biosynthesis enzymes reporter constructs and the MYB12 effector construct have been described previously (Mehrtens et al., 2005). See for details of the creation of new reporter and effector constructs. In the co-transfection experiments, a total of 25 μg of pre-mixed plasmid DNA was transfected, consisting of 10 μg of reporter plasmid, 1 μg of effector plasmid and 5 μg of the luciferase (LUC) standardization plasmid. Protoplasts were incubated for 20 h at 26°C in the dark before LUC and GUS enzyme activities were measured. Specific GUS activity is given in pmol MU per mg protein per min. Standardized specific GUS activity (GUS′) was calculated by multiplication of the specific GUS activity value with a correction factor derived from the ratio of the specific LUC activity in the given sample to the mean specific LUC activity (describing the transformation efficiency) of a set of six complete experiments. The error bars indicate the standard deviation of the six GUS′ values for the respective construct.
Creation of promoter:GUS transgenic plants and GUS staining
See Supplementary Material.
Ribonucleic acid isolation
Ribonucleic acid from seedlings or parts of seedlings were isolated using the RNeasy® Plant Mini Kit (no. 74904, Qiagen, http://www.qiagen.com/) following the manufacturer’s instructions.
Reverse transcriptase-PCR
Complementary DNA was synthesized from 3 μg total RNA in 20 μl volume using an oligo dT primer and SuperscriptII RT (Invitrogen) at 42°C in 1 h. One microliter of resulting cDNA was used as template in the following PCR: 25 μl volume containing 20 mm 2-amino-2-(hydroxymethyl)1,3-propanediol (TRIS)-HCl (pH 8.4), 50 mm KCl, 1.5 mm MgCl2, 0.2 mm each dNTP, 0.2 μm each primer and 1.5 U Taq DNA polymerase (Invitrogen) using the cycling protocol: 3 min, 95°C – 33 cycles of 20 sec, 95°C; 20 sec, 57°C and 80 sec, 72°C – 2 min, 72°C. Nine microliters of the amplification products were analyzed by electrophoresis and visualized by ethidium bromide on a 1% agarose gel. The following primers were used: RS469 (5′-TCCGCTCTTTCTTTCCAAGCTCAT-3′) and RS470 (5′-TCCAGCACAATACCGGTTGTACG-3′) giving a product of about 500 bp for detection of ACT2 transcripts, RS601 (5′-CCCAAAAATGCCGGGCTAAAGAGATG-3′) and RS819 (5′-GCCAAAATCGTATTTACACATGAA-3′) for MYB11 (1086-bp amplicon) and RS820 (5′-ATATTCAGACCAATGGTGAAGGTT-3′) and RS821 (5′-CCCATAGATCATCACTTTGACAAG-3′) for detection of MYB111 cDNA giving a PCR product of 912 bp.
Quantitative real-time RT-PCR (qPCR)
Complementary DNA was synthesized from 2 μg total RNA after DNaseI treatment as described by Mehrtens et al. (2005). Quantitative PCRs analyzing the transcript level of MYB11, MYB12 and MYB111, as well as for SG7 MYB target gene confirmation were performed using the Platinum SYBR Green qPCR SuperMix UDG Kit (Invitrogen) following the manufacturer’s instructions on a Rotor-Gene 3000 DNA detection system (Corbett Research, http://www.corbettlifescience.com/). Transcript levels were normalized to 18S rRNA transcript levels. The primers were as follows: 18S rRNA, forward primer FM137 (5′-TCTGTGATGCCCTTAGATGTTCTG-3′), reverse primer FM138 (5′-GGCAAGGTGTGAACTCGTTGA-3′); MYB11, forward primer RS601 (5′-CCCAAAAATGCCGGGCTAAAGAGATG-3′), reverse primer RS710 (5′-CTTCTTCGGGAGTTATGTTT-3′); MYB12, forward primer RS658 (5′-CACTTTGGGAAACAGGTGGTCACT-3′), reverse primer RS709 (5′-GTTGTGGAGTTTACGGCTGA-3′); MYB111, forward primer RS711 (5′-AAAGAGGAAATATTACTTCCGACGAA-3′), reverse primer RS712 (5′-TTGTCT-GTTCTTCCTGGTAGATGTG-3′); target gene At2g22590, forward primer RS675 (5′-GACGAGACAGAAGGTTTCTTTAC-3′), reverse primer RS676 (5′-CCACATAACGATCTTGTCTATCC-3′); target gene At4g15480, forward primer RS679 (5′-GTAAAGGGATGATTGTGGATTG-3′), reverse primer RS680 (5′-CAAAGATTCCATTGTCGAGTTC-3′); target gene At5g62210, forward primer RS685 (5′-GACG-ATAACCAGGTGGTCGCAC-3′), reverse primer RS686 (5′-CGTCGGTACCGGAACGGTAGATGT-3′). Average results of two biological replicates, each with triple values, are given.
Transcriptome analysis using ATH1 gene chips
Preparation of cDNA from total RNA and hybridization to ATH1 DNA arrays (Affymetrix) were performed by the Integrated Functional Genomic (IFG) service unit of the Interdisciplinary Center for Clinical Research (IZKF) in Münster, Germany. The resulting cabinet-file (.cab) was processed using the GeneChip-Operating System (GCOS; Affymetrix). Calculations and analysis of transcriptome data were performed using MS Excel (Microsoft, http://www.microsoft.com/). Fold change was calculated as the ratio of signal intensity in the mutant to that in the wild-type plant. To reduce the number of false positives, we selected genes with ‘present’ absolute values out of the baseline data (arbitrarily set to P ≥ 20). The microarray data and Minimum Information About a Microarray Experiment (MIAME) documentation has been submitted to ArrayExpress (http://www.ebi.ac.uk/arrayexpress/), a public repository for microarray data. It could be found under accession number E-ATMX-5.
Methanolic extracts for HPLC and HPTLC analyses
Methanolic extracts from 5-dag seedlings were produced from 20–150 mg plant material in 2 ml reaction tubes by addition of 0.4 ml 80% methanol and about 10–15 zirconia beads of 1 mm diameter (Roth, http://www.carlroth.com/). Samples were homogenized at maximum speed in a Ribolyser (Qbiogene, http://www.qbiogene.com) at a setting of 6.5 msec, twice for 45 sec. Homogenized samples were incubated for 15 min at 70°C and centrifuged for 10 min at 15 000 g in a standard table centrifuge. Supernatants were vacuum-dried in a SpeedVac at 60°C. The dried pellets were dissolved in 1 μl of 80% methanol mg−1 starting material for HPTLC analysis and in 80% methanol containing 5 μg ml−1 luteolin-7-glycoside (Roth) for HPLC analysis. The digitoflavone luteolin-7-glycoside was used as an internal standard for the relative quantification of compounds.
HPLC-PDA-ESI/MS analyses
A HPLC-PDA-ESI/MS system composed of Finnigan Spectra System P4000 HPLC, UV6000 photodiode array, Autosampler AS3000 and Finnigan LCQ DECA mass spectrometer (Thermo Scientific, http://www.thermo.com) with a custom spray head having a spray angle of 30º was used to analyze 20 μl of the methanolic extracts. High-performance liquid chromatography was carried out on a LiChroCART C18, 4 μm, 2 ×125 mm column (Merck, http://www.merck.com/) at a flow rate of 0.2 ml min−1. Solvent A was acetonitrile with 0.1% formic acid, and solvent B was 0.1% formic acid in water (J.T. Baker, http://www.mallbaker.com/). The elution gradient program was a linear gradient from solvent A to solvent B. The gradient program was started with 5% A (5 min), linearly increased to 25% A (30 min) and ended with 100% A (35 min). A PDA was used for detection of UV-visible absorption in the range of 200–700 nm. Nitrogen was used as the sheath gas (6 bar at a flow rate of 0.8 l min−1) for the positive-ion ESI/MS which was performed at a capillary temperature and voltage of 320°C and 5.0 kV, respectively. The tube lens offset was set at 10.0 V. Full scan mass spectra were acquired from 80–2000 m/z at 2 scans sec−1. Stepwise fragmentation analysis was carried out with different activation energies depending on the compound class.
Gas chromatography-MS analysis
The HPTLC-purified flavonol glycosides and 100 nm solutions of pure reference substances were aliquotted into 1 ml tight reacti-vials (Supelco, http://www.sigmaaldrich.com/Brands/Supelco_Home.html). Methanolic HCl (0.5 ml at 1.25 m concentration) was added and the samples were incubated at 80°C for 6 h. Subsequently, the samples were dried under a nitrogen stream and 50 μl of both pyridine and N-methyl-N-(trimethylsilyl) trifluoroacetamide (Macherey-Nagel, http://www.mn-net.com/) were added. The samples were stirred at 37°C for 30 min. After hydrolysis and derivatization, the samples were analyzed on a Trace GC/PolarisQ bench-top GC/MS system equipped with an AS 2000 autosampler (Finnigan Corp.). The GC separation was performed on a 30 m Equity5 column with 0.5 μm film thickness (Supelco). The temperature of the injection port was adjusted to 200°C and to 250°C for the transfer line. Helium was used as carrier gas at a flow rate of 1 ml min−1. Samples of 1 μl were injected in a splitless mode. The initial column temperature was 80°C. This temperature was held for 3 min and was gradually increased at a rate of 5°C min−1 to a final temperature of 325°C. To equilibrate the system for the next sample injection, the temperature was lowered to 80°C again and held constant for additional 5 min. Mass spectra were recorded with a scanning range of 50–650 m/z at 2 scans sec−1.
High-performance thin layer chromatography with subsequent DPBA staining
High-performance thin layer chromatography and followed by DPBA staining was performed according to Wagner and Bladt (1995). Two microliters of methanolic extracts was spotted on 10 cm × 10 cm silica-60 HPTLC-plates (Merck) used as the stationary phase. Adsorption chromatography was carried out using a system of ethyl acetate, formic acid, acetic acid and water (100:26:12:12) as the mobile phase in a closed glass tank. Separated phenylpropanoid compounds were stained by spraying a 1% DPBA (w/v) (also known as Naturstoffreagenz A; Roth 9920-1) solution in methanol, followed by spraying 5% methanolic polyethylene glycol (PEG) 4000 (w/v) solution. The stained chromatograms were examined under UV light (312 nm) and photographed.
Flavonoid staining of whole seedlings
For the visualization of flavonoids a method from Sheahan and Rechnitz (1992) was adapted. Arabidopsis thaliana seedlings were grown after germination for 5 days with 16 h light per day on filter paper soaked with 3 p.p.m. of the bleaching reagent norflurazon (Supelco; PS-1044) that blocks the synthesis of carotenoids. The bleached seedlings were stained to saturation for at least 1.5 h in a freshly prepared solution of 0.25% (w/v) DPBA, 0.00375% (v/v) Triton X-100. Fluorescence was visualized on a Leica DM5500 B epifluorescence microscope (http://www.leica-microsystems.com/) using Leica Filtercube A with an excitation wavelength of 340–380 nm and a 425-nm long-pass splitter. Pictures were taken using the Diskus digital imaging software (version 4.50.1638) with the same imaging setting parameters for each picture series. Pictures were assembled using Adobe Photoshop (Adobe Systems Inc., http://www.adobe.com/) software without changing the color parameters.
Acknowledgments
We thank Melanie Kuhlmann for excellent technical assistance. Many thanks to Martin Sagasser for critical reading of the manuscript and to Bettina Kah for help with some of the qPCR experiments. We are grateful to Brenda Winkel for providing tt4-2YY6 seeds. Also a ‘Thanks’ to the Sequencing Core Facility for doing an excellent job in determining DNA sequences. This work was supported by the DFG (WE1576/7-1), the Fonds der Chemischen Industrie and initially also by the Max-Planck Society (MPG).
Supplementary material
The following supplementary material is available for this article online:
Experimental procedures. Creation of double and triple myb mutant(s), Genotyping of mutants, Transfection experiments, Creation of promoter:GUS transgenic plants and GUS staining. This material is available as part of the online article from http://www.blackwell-synergy.com
References
- Albert S. BANYULS, a novel negative regulator of flavonoid biosynthesis in the Arabidopsis seed coat. Plant J. 1997;11:289–299. doi: 10.1046/j.1365-313x.1997.11020289.x. [DOI] [PubMed] [Google Scholar]
- Alonso JM, et al. Genome-wide insertional mutagenesis of Arabidopsis thaliana. Science. 2003;301:653–657. doi: 10.1126/science.1086391. [DOI] [PubMed] [Google Scholar]
- Birnbaum K. A gene expression map of the Arabidopsis root. Science. 2003;302:1956–1960. doi: 10.1126/science.1090022. [DOI] [PubMed] [Google Scholar]
- Böhm H. Flavonols, flavone and anthocyanins as natural antioxidants of food and their possible role in the prevention of chronic diseases. Zeitschrift für Ernährungswissenschaften. 1998;37:147–163. doi: 10.1007/pl00007376. [DOI] [PubMed] [Google Scholar]
- Borevitz JO. Activation tagging identifies a conserved MYB regulator of phenylpropanoid biosynthesis. Plant Cell. 2000;12:2383–2393. doi: 10.1105/tpc.12.12.2383. [DOI] [PMC free article] [PubMed] [Google Scholar]
- Bowles D. A multigene family of glycosyltransferases in a model plant, Arabidopsis thaliana. Biochem. Soc. Trans. 2002;30:301–306. doi: 10.1042/. [DOI] [PubMed] [Google Scholar]
- Brown DE. Flavonoids act as negative regulators of auxin transport in vivo in Arabidopsis. Plant Physiol. 2001;126:524–535. doi: 10.1104/pp.126.2.524. [DOI] [PMC free article] [PubMed] [Google Scholar]
- Buer CS. The transparent testa4 mutation prevents flavonoid synthesis and alters auxin transport and the response of Arabidopsis roots to gravity and light. Plant Cell. 2004;16:1191–1205. doi: 10.1105/tpc.020313. [DOI] [PMC free article] [PubMed] [Google Scholar]
- Buer CS. Ethylene modulates flavonoid accumulation and gravitropic responses in roots of Arabidopsis. Plant Physiol. 2006;140:1384–1396. doi: 10.1104/pp.105.075671. [DOI] [PMC free article] [PubMed] [Google Scholar]
- Burbulis IE. A null mutation in the first enzyme of flavonoid biosynthesis does not affect male fertility in Arabidopsis. Plant Cell. 1996;8:1013–1025. doi: 10.1105/tpc.8.6.1013. [DOI] [PMC free article] [PubMed] [Google Scholar]
- Debeaujon I. The TRANSPARENT TESTA12 gene of Arabidopsis encodes a multidrug secondary transporter-like protein required for flavonoid sequestration in vacuoles of the seed coat endothelium. Plant Cell. 2001;13:853–872. doi: 10.1105/tpc.13.4.853. [DOI] [PMC free article] [PubMed] [Google Scholar]
- Feldbruegge M. PcMYB1, a novel plant protein containing a DNA-binding domain with one MYB repeat, interacts in vivo with a light-regulatory promoter unit. Plant J. 1997;11:1079–1093. doi: 10.1046/j.1365-313x.1997.11051079.x. [DOI] [PubMed] [Google Scholar]
- Grotewold E. The myb-homologous P gene controls phlobaphene pigmentation in maize floral organs by directly activating a flavonoid biosynthetic gene subset. Cell. 1994;76:543–553. doi: 10.1016/0092-8674(94)90117-1. [DOI] [PubMed] [Google Scholar]
- Harborne JB. Advances in flavonoid research since 1992. Phytochemistry. 2000;55:481–504. doi: 10.1016/s0031-9422(00)00235-1. [DOI] [PubMed] [Google Scholar]
- Hartmann U. Identification of UV/blue light-response elements in the Arabidopsis thaliana chalcone synthase promoter using a homologous protoplast transient expression system. Plant Mol. Biol. 1998;36:741–754. doi: 10.1023/a:1005921914384. [DOI] [PubMed] [Google Scholar]
- Hartmann U. Differential combinatorial interactions of cis-acting elements recognized by R2R3-MYB, BZIP, and BHLH factors control light-responsive and tissue-specific activation of phenylpropanoid biosynthesis genes. Plant Mol. Biol. 2005;57:155–171. doi: 10.1007/s11103-004-6910-0. [DOI] [PubMed] [Google Scholar]
- Jacobs M. Naturally occuring auxin transport regulators. Science. 1988;241:346–349. doi: 10.1126/science.241.4863.346. [DOI] [PubMed] [Google Scholar]
- Jin H. Transcriptional repression by AtMYB4 controls production of UV-protecting sunscreens in Arabidopsis. EMBO J. 2000;19:6150–6161. doi: 10.1093/emboj/19.22.6150. [DOI] [PMC free article] [PubMed] [Google Scholar]
- Jones P. UGT73C6 and UGT78D1, glycosyltransferases involved in flavonol glycoside biosynthesis in Arabidopsis thaliana. J. Biol. Chem. 2003;278:43910–43918. doi: 10.1074/jbc.M303523200. [DOI] [PubMed] [Google Scholar]
- Jorgensen K. Metabolon formation and metabolic channeling in the biosynthesis of plant natural products. Curr. Opin. Plant Biol. 2005;8:280–291. doi: 10.1016/j.pbi.2005.03.014. [DOI] [PubMed] [Google Scholar]
- Kaiser T. Cis-acting elements of the CHS1 gene from white mustard controlling promoter activity and spatial patterns of expression. Plant Mol. Biol. 1995;28:231–243. doi: 10.1007/BF00020243. [DOI] [PubMed] [Google Scholar]
- Kirik V. Ectopic expression of the Arabidopsis AtMYB23 gene induces differentiation of trichome cells. Dev. Biol. 2001;235:366–377. doi: 10.1006/dbio.2001.0287. [DOI] [PubMed] [Google Scholar]
- Koes R. Flavonoids: a colorful model for the regulation and evolution of biochemical pathways. Trends Plant Sci. 2005;10:236–242. doi: 10.1016/j.tplants.2005.03.002. [DOI] [PubMed] [Google Scholar]
- Kranz HD, et al. Towards functional characterisation of the members of the R2R3-MYB gene family from Arabidopsis thaliana. Plant J. 1998;16:263–276. doi: 10.1046/j.1365-313x.1998.00278.x. [DOI] [PubMed] [Google Scholar]
- Lazar G. MAX1, a regulator of the flavonoid pathway, controls vegetative axillary bud outgrowth in Arabidopsis. Proc. Natl Acad. Sci. USA. 2006;103:472–476. doi: 10.1073/pnas.0509463102. [DOI] [PMC free article] [PubMed] [Google Scholar]
- Lee MM. Developmentally distinct MYB genes encode functionally equivalent proteins in Arabidopsis. Development. 2001;128:1539–1546. doi: 10.1242/dev.128.9.1539. [DOI] [PubMed] [Google Scholar]
- Lepiniec L. Genetics and biochemistry of seed flavonoids. Annu. Rev. Plant Biol. 2006;57:405–430. doi: 10.1146/annurev.arplant.57.032905.105252. [DOI] [PubMed] [Google Scholar]
- Lim EK. Identification of glucosyltransferase genes involved in sinapate metabolism and lignin synthesis in Arabidopsis. J. Biol. Chem. 2001;276:4344–4349. doi: 10.1074/jbc.M007263200. [DOI] [PubMed] [Google Scholar]
- Lingens F. Biosynthesis of phenylalanine and tyrosine: arogenic acid, a new intermediate product. Naturwissenschaften. 1983;70:115–118. doi: 10.1007/BF00401594. [DOI] [PubMed] [Google Scholar]
- Lois R. A phenylalanine ammonia-lyase gene from parsley: Structure, regulation and identification of elicitor and light responsive cis-acting elements. EMBO J. 1989;8:1641–1648. doi: 10.1002/j.1460-2075.1989.tb03554.x. [DOI] [PMC free article] [PubMed] [Google Scholar]
- Mehrtens F. The Arabidopsis transcription factor MYB12 is a flavonol-specific regulator of phenylpropanoid biosynthesis. Plant Physiol. 2005;138:1083–1096. doi: 10.1104/pp.104.058032. [DOI] [PMC free article] [PubMed] [Google Scholar]
- Messner B. Arabidopsis glucosyltransferases with activities toward both endogenous and xenobiotic substrates. Planta. 2003;217:138–146. doi: 10.1007/s00425-002-0969-0. [DOI] [PubMed] [Google Scholar]
- Mol J. How genes paint flowers and seeds. Trends Plant Sci. 1998;3:212–217. [Google Scholar]
- Muller D. Blind homologous R2R3 Myb genes control the pattern of lateral meristem initiation in Arabidopsis. Plant Cell. 2006;18:586–597. doi: 10.1105/tpc.105.038745. [DOI] [PMC free article] [PubMed] [Google Scholar]
- Murphy A. Regulation of auxin transport by aminopeptidases and endogenous flavonoids. Planta. 2000;211:315–324. doi: 10.1007/s004250000300. [DOI] [PubMed] [Google Scholar]
- Nesi N. The TT8 gene encodes a basic helix-loop-helix domain protein required for expression of DFR and BAN genes in arabidopsis siliques. Plant Cell. 2000;12:1863–1878. doi: 10.1105/tpc.12.10.1863. [DOI] [PMC free article] [PubMed] [Google Scholar]
- Nesi N. The Arabidopsis TT2 gene encodes an R2R3 MYB domain protein that acts as a key determinant for proanthocyanidin accumulation in developing seed. Plant Cell. 2001;13:2099–2114. doi: 10.1105/TPC.010098. [DOI] [PMC free article] [PubMed] [Google Scholar]
- Olsson LC. Differential flavonoid response to enhanced UV-B radiation in Brassica napus. Phytochemistry. 1998;49:1021–1028. [Google Scholar]
- Ormrod DP. Shortterm UVB radiation and ozone exposure effects on aromatic secondary metabolite accumulation and shoot growth of flavonoid-deficient Arabidopsis mutants. Physiol. Plant. 1995;93:602–610. [Google Scholar]
- Peer WA. Flavonoid accumulation patterns of Transparent Testa mutants of Arabidopsis. Plant Physiol. 2001;126:536–548. doi: 10.1104/pp.126.2.536. [DOI] [PMC free article] [PubMed] [Google Scholar]
- Pietta PG. Flavonoids as antioxidants. J. Nat. Prod. 2000;67:1035–1042. doi: 10.1021/np9904509. [DOI] [PubMed] [Google Scholar]
- Preston J. AtMYB32 is required for normal pollen development in Arabidopsis thaliana. Plant J. 2004;40:979–995. doi: 10.1111/j.1365-313X.2004.02280.x. [DOI] [PubMed] [Google Scholar]
- Ramsay NA. MYB-bHLH-WD40 protein complex and the evolution of cellular diversity. Trends Plant Sci. 2005;10:63–70. doi: 10.1016/j.tplants.2004.12.011. [DOI] [PubMed] [Google Scholar]
- Ross JA. Dietary flavonoids: bioavailability, metabolic effects, and safety. Annu. Rev. Nutr. 2002;22:19–34. doi: 10.1146/annurev.nutr.22.111401.144957. [DOI] [PubMed] [Google Scholar]
- Rosso MG. An Arabidopsis thaliana T-DNA mutagenised population (GABI-Kat) for flanking sequence tag based reverse genetics. Plant Mol. Biol. 2003;53:247–259. doi: 10.1023/B:PLAN.0000009297.37235.4a. [DOI] [PubMed] [Google Scholar]
- Routaboul JM. Flavonoid diversity and biosynthesis in seed of Arabidopsis thaliana. Planta. 2006;224:96–107. doi: 10.1007/s00425-005-0197-5. [DOI] [PubMed] [Google Scholar]
- Sambrook J. Molecular Cloning: A Laboratory Manual. 2. New York, NY: Cold Spring Harbor Laboratory Press; 1989. [Google Scholar]
- Saslowsky D. Localization of flavonoid enzymes in Arabidopsis roots. Plant J. 2001;27:37–48. doi: 10.1046/j.1365-313x.2001.01073.x. [DOI] [PubMed] [Google Scholar]
- Saslowsky DE. An allelic series for the chalcone synthase locus in Arabidopsis. Gene. 2000;255:127–138. doi: 10.1016/s0378-1119(00)00304-8. [DOI] [PubMed] [Google Scholar]
- Schiefelbein J. Cell-fate specification in the epidermis: a common patterning mechanism in the root and shoot. Curr. Opin. Plant Biol. 2003;6:74–78. doi: 10.1016/s136952660200002x. [DOI] [PubMed] [Google Scholar]
- Schmitz G. The tomato Blind gene encodes a MYB transcription factor that controls the formation of lateral meristems. Proc. Natl Acad. Sci. USA. 2002;99:1064–1069. doi: 10.1073/pnas.022516199. [DOI] [PMC free article] [PubMed] [Google Scholar]
- Schulze-Lefert P. Functional architecture of the light-responsive chalcone synthase promoter from parsley. Plant Cell. 1989;1:707–714. doi: 10.1105/tpc.1.7.707. [DOI] [PMC free article] [PubMed] [Google Scholar]
- Sheahan JJ. Flavonoid-specific staining of Arabidopsis thaliana. Biotechniques. 1992;13:880–883. [PubMed] [Google Scholar]
- Sheahan JJ. Differential visualization of Transparent Testa mutants in Arabidopsis thaliana. Anal. Chem. 1993;65:961–963. [Google Scholar]
- Solovchenko A. Significance of skin flavonoids for UV-B-protection in apple fruits. J Exp. Bot. 2003;54:1977–1984. doi: 10.1093/jxb/erg199. [DOI] [PubMed] [Google Scholar]
- Stobiecki M. Profiling of phenolic glycosidic conjugates in leaves of Arabidopsis thaliana using LC/MS. Metabolomics. 2006;2:197–219. [Google Scholar]
- Stracke R. The R2R3-MYB gene family in Arabidopsis thaliana. Curr. Opin. Plant Biol. 2001;4:447–456. doi: 10.1016/s1369-5266(00)00199-0. [DOI] [PubMed] [Google Scholar]
- Tohge T, et al. Functional genomics by integrated analysis of metabolome and transcriptome of Arabidopsis plants over-expressing an MYB transcription factor. Plant J. 2005;42:218–235. doi: 10.1111/j.1365-313X.2005.02371.x. [DOI] [PubMed] [Google Scholar]
- Wagner H. Plant Drug Analysis – A Thin Layer Chromatography Atlas. 2. Berlin: Springer; 1995. [Google Scholar]
- Weisshaar B. Phenylpropanoid biosynthesis and its regulation. Curr. Opin. Plant Biol. 1998;1:251–257. doi: 10.1016/s1369-5266(98)80113-1. [DOI] [PubMed] [Google Scholar]
- Winkel-Shirley B. Evidence for enzyme complexes in the phenylpropanoid and flavonoid pathways. Physiol. Plant. 1999;107:142–149. [Google Scholar]
- Winkel-Shirley B. Flavonoid biosynthesis. A colorful model for genetics, biochemistry, cell biology, and biotechnology. Plant Physiol. 2001;126:485–493. doi: 10.1104/pp.126.2.485. [DOI] [PMC free article] [PubMed] [Google Scholar]
- Zimmermann IM. Comprehensive identification of Arabidopsis thaliana MYB transcription factors interacting with R/B-like BHLH proteins. Plant J. 2004;40:22–34. doi: 10.1111/j.1365-313X.2004.02183.x. [DOI] [PubMed] [Google Scholar]
Associated Data
This section collects any data citations, data availability statements, or supplementary materials included in this article.
Supplementary Materials
Experimental procedures. Creation of double and triple myb mutant(s), Genotyping of mutants, Transfection experiments, Creation of promoter:GUS transgenic plants and GUS staining. This material is available as part of the online article from http://www.blackwell-synergy.com