Abstract
A generic DNA microarray design applicable to any species would greatly benefit comparative genomics. We have addressed the feasibility of such a design by leveraging the great feature densities and relatively unbiased nature of genomic tiling microarrays. Specifically, we first divided each Homo sapiens Refseq-derived gene's spliced nucleotide sequence into all of its possible contiguous 25 nt subsequences. For each of these 25 nt subsequences, we searched a recent human transcript mapping experiment's probe design for the 25 nt probe sequence having the fewest mismatches with the subsequence, but that did not match the subsequence exactly. Signal intensities measured with each gene's nearest-neighbor features were subsequently averaged to predict their gene expression levels in each of the experiment's thirty-three hybridizations. We examined the fidelity of this approach in terms of both sensitivity and specificity for detecting actively transcribed genes, for transcriptional consistency between exons of the same gene, and for reproducibility between tiling array designs. Taken together, our results provide proof-of-principle for probing nucleic acid targets with off-target, nearest-neighbor features.
INTRODUCTION
Today's DNA microarray devices contain upwards of five million features, each containing a unique probe sequence. Technological advances have continually pushed this feature density higher, ultimately allowing the construction of genomic tiling microarrays wherein large stretches of genomic sequence are represented by probes targeting it at regular intervals (1). These intervals are typically 100 nt or finer and allow the unbiased monitoring of genomic functions such as DNA transcription (2,3) and replication (4), among many other uses.
From a technological standpoint the tiling microarray's greatest achievement is in moving the DNA microarray technology from an application-specific (gene expression or genotyping) one that relies heavily on genomic annotation to a more general purpose tool. For instance, a single tiling microarray design can be used for transcript mapping, transcription factor localization and DNA replication timing, as evidenced by the recent ENCODE consortium's series of genomic experiments (5).
In this respect, it may be argued that the goals of DNA microarray technology are coming full circle—a general application tool for detecting nucleic acids. With this aim, an initial vision for the DNA microarray was a matrix of oligonucleotide containing features, each containing unique n-mer probes (6). This matrix could, in theory, be used to query a biological sample for the presence of any nucleic acid sequence. A hindrance to the n-mer construction is that such an array requires synthesizing 4n features. Naturally, larger values of n infuse greater specificity into the arrayed probes, but as n increases, the number of required features grows rapidly. Despite this limitation, generic n-mer microarrays were initially conceptualized as a means to generate primary sequence data for the human genome sequencing effort and although this ‘sequencing by hybridization’ (7,8) approach has been demonstrated in a number of test cases (6,8–10), it has not enjoyed widespread use because of somewhat unrealistic thermodynamic assumptions about microarray hybridization. For the arguably simpler application of measuring gene expression, theoretical studies have suggested that universal arrays containing all possible 10-mers would be adequate (11) but this claim is yet to be substantiated in a working system.
Although the n-mer approach has largely been abandoned with at least one notable exception (12), we hypothesize that generic microarrays may be unintentionally re-emerging with the development of tiling arrays. Several contributing factors have led us to contemplate this hypothesis. First, in situ oligonucleotide fabrication technology has improved microarray feature density upwards to five million features per array. This allows for the vast sequence coverage needed in a universal array system. Second, in many tiling array applications (e.g. transcript mapping and ChIP-chip applications) only a very small fraction of the genome is expected to be ‘active’. This would leave most of the array's features with very little target-specific activity, if any. Third, it is well known that the short oligonucleotides used in many tiling microarrays may be prone to bind weakly with off-targets (13). These points, when taken together, suggest that biologically active regions of a genome not represented on a tiling microarray may still leave weak signatures of their activity in the ‘inactive’ regions targeted by tiling array probes.
If this hypothesis were true, a consequence would be that tiling microarrays targeting the human genome (or random oligonucleotides, for that matter) could be used to bridge the gap towards making DNA microarrays generally applicable to any organism and/or application. One would simply hybridize labeled nucleic acids to the tiling (or random) array and then read off intensities corresponding to probes that cross-hybridize to the targets that they are interested in. The target specificity for a single cross-hybridizing probe would, of course, be much less than that of a perfectly complementary probe but one could theoretically pool data from the M features that might cross-hybridize to the M subsequences present within the target sequence. In this way, the loss in specificity may be made up for by greater coverage of the region.
Should such data prove useful, this approach would certainly be attractive to researchers studying organisms poorly supported by array manufacturers. A similar method suggested for coping with this reality is to perform so-called cross-species hybridizations (14). As the name implies, this procedure calls for the hybridization of RNA (or reverse-transcribed cDNA) obtained from one species to a microarray designed to target another species’ genetic material. Cross-species strategies have yielded many meaningful results (14–17), indicating that useful information can be measured from cross-hybridization signals alone.
To investigate whether the concept of a species-non-specific universal array may be re-emerging with tiling arrays, we have simulated the scenario of using nearest-neighbor features to measure transcript abundances by using tiling microarray data that targets one part of the human genome to predict expression levels genome-wide. We have adopted an intensity prediction strategy for gene expression profiling and while we believe that this approach would not replace existing microarray strategies currently in use for studying human and other model organisms’ gene expression patterns, we do offer the technique as a theoretically viable option for someone studying RNA expression in a species for which no commercial arrays exist or for someone wishing to assay non-genic regions in an organism for which no tiling arrays are available. While our results do not indicate perfect concordance with signals that might be obtained via traditional means, we do demonstrate very significant trends that can certainly be useful in a hypothesis-generating setting, where DNA microarrays are typically employed (18).
MATERIALS AND METHODS
Microarray data
The data set we studied uses 98 unique microarray designs to tile ten human chromosomes at a five base pair resolution (19). Each array probes approximately 760 000 unique genomic tiles with one perfectly matching 25 nt oligo and one 25 nt oligo identical to the perfect match, save the 13th nucleotide; this nucleotide is replaced by the complement nucleotide of the perfect match probe's 13th nucleotide. With these arrays, eleven different RNA populations isolated from nine different cell lines were probed. Samples were probed an average of three times. Nine samples contained polyA-selected RNA and two contained total RNA. Nine of the eleven samples contained cytosolic RNA while two contained nuclear RNA.
In our work, we focused primarily on data gathered using just two of the 98 designs. Arbitrarily, we concentrated on the array designs named ‘chip01’ and ‘chip02’ in the original experiment which target different regions of human chromosome 6.
Data normalization
Microarray data were normalized as follows. First, the minimum feature intensity was computed for each array and decremented by one intensity unit. This value was then subtracted from every measurement in every array such that each array subsequently had a minimum signal intensity of one. This subtraction approximates the removal of optical background noise (20). Each array's signals were then log2 transformed and the entire data set was subsequently quantile normalized (21) to remove any array-specific effects such as differences in cDNA concentration hybridized to the arrays.
Nearest-neighbor queries
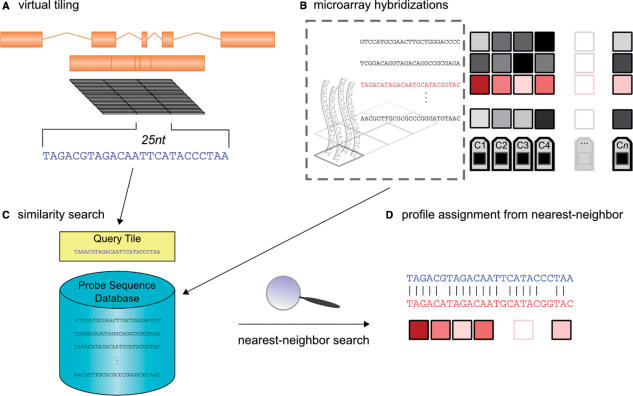
To find features that are close in sequence to a desired nucleic acid target, we first divided the target's nucleotide string into all of its length 25 substrings. Then each of these substrings was used as a query to the database of probe sequences that exist in a given microarray design (e.g. chip01). The nearest-neighbor feature for a substring was then defined such that its probe sequence had fewer mismatches to the query substring than any other probe sequence present on the array. If multiple features had probes with an identical maximal number of matches to the query substring, then one is chosen at random to be the nearest-neighbor feature. This procedure is schematized in Figure 1. Unless otherwise noted, we ignored features whose probes were an exact match to a query substring.
Figure 1.
Outline of nearest-neighbor microarray analysis. (A) A gene with several exons is merged into a single transcriptional unit, from which all 25nt tiles are extracted. (B) In parallel, a database is constructed such that each entry represents a single feature's expression profile across n cell types and/or conditions, C1, … Cn. Each of these entries is indexed by its feature's probe sequence. (C) For each query tile, a nearest-neighbor query is performed against this database. (D) When the nearest-neighbor probe is found, its expression profile is assigned to the query tile.
Target genes
The Refseq database of well-curated human genes, based on the March 2006 build of the human genome, was downloaded on 6 February from the UCSC table browser (22). As of this download date, Refseq contained 25 319 nucleotide sequences for which our nearest-neighbor queries were conducted.
Transcript detection
In determining whether or not a gene is transcribed, we first found all n of its nearest-neighbor features as described above. For each of these identified features, we sampled an additional feature from the same array whose probe sequence had identical GC content. We then counted the number of times the nearest-neighbor feature had signal greater than the GC-content matched feature's signal and added to this quantity half the number of times these two quantities were equal. Dividing this value by n gave us the observed proportion, P0, of nearest-neighbor features exhibiting signal greater than their GC-content matched control features. The significance of this proportion under the null hypothesis of P0 = 0.5 can be computed directly via summing the tail of the binomial probability distribution function. Since we had a very large number of nearest-neighbor features per gene, we simplified this computation by converting P0 to a standardized z-score:
| (1) |
with variance estimated by the central limit theorem applied to binomial random variables. Specifically, the 0.25 in the denominator follows from the formulation of a Bernouli random variable's variance as its expected value multiplied by one minus its expected value. Since our expected value under the null hypothesis is 0.5, our variable's variance is 0.5(1−0.5) = 0.25. The z-score was then converted to a P-value using the standard normal curve.
RESULTS
We sought to determine whether existing tiling microarray platforms might be converging towards general-purpose nucleic acid detecting devices with their higher feature densities. To assess this hypothesis, we simulated the scenario by ‘measuring’ Refseq transcript abundances with existing tiling microarray data for which these transcripts were not the intended target.
Choice of data set
We began by downloading tiling microarray data from the ten chromosome Affymetrix transcript mapping project (19). This work consists of 98 unique microarray designs, each targeting a distinct region of the human genome. Of available tiling data sets, this one comes closest to representing a universal array platform. This is because its arrays have high feature densities and the probe sequences come from a very fine tiling resolution (5 nt). The fine resolution ensures that there is very little room for probe selection, and therefore the sequences are unbiased, relative to other tiling designs. Since this data set has the additional advantage of probing multiple different RNA samples, we were not limited to checking if nearest-neighbor features gave similar intensities as their perfectly matching counterparts on a single array; we were able to check for correlations across cellular conditions, a much stronger indicator of the suggested method's efficacy.
For simplicity in our work, we focused on just two of the data set's designs, designated ‘chip01’ and ‘chip02’ by the study's authors. To microarrays actualizing these designs, researchers at Affymetrix hybridized 11 different cDNA samples, each derived from a different population of RNA transcripts. All hybridizations were done in triplicate. There are, therefore, 33 hybridizations worth of data for each chip design. The 33 hybridizations provided adequate sample size for computing meaningful correlation coefficients in our analyses.
Cross-hybridization increases with probe similarity
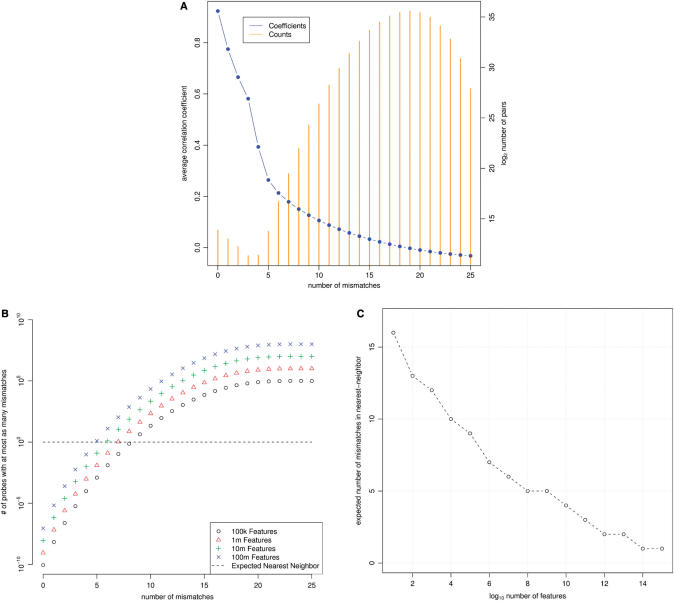
We next investigated the extent to which non-exact match microarray probes might hybridize to off-targets. For each perfect match feature in the chip01 design, we aligned its probe sequence to that of every other perfect match feature present in the design and recorded the number of mismatches that exist between the two. We simultaneously computed the correlation coefficient (Pearson's) between this pairs’ normalized array signals across samples. For each of the possible mismatch counts (0 … 25), we averaged those correlation coefficients between features whose probes have that many mismatches and plotted these averages in Figure 2. It can be seen from this figure that correlation between features with similar sequences increases with their degree of similarity. From a data set (human transcription) for which we might not expect an abundance of activity at most features, this result is striking. It suggests that there is variable activity being observed at a large number of features.
Figure 2.
Properties of the nearest-neighbor strategy. (A) Feature pairs with several mismatches are weak predictors of signal. All possible pairs of features from a single tiling microarray design were analyzed. The average correlation coefficients (blue circles, left axis) and number of pairs contributing to those averages (orange bars, right axis) are plotted for all possible number of mismatches. (B) Expected number of mismatches between a tile and its nearest-neighbor probe sequence. For a number of mismatches, k, the expected number of features having k or fewer mismatches to any 25nt tile is plotted. These expectations are plotted for array designs having 105, 106, 107 and 108 features. The value of k for which a series crosses unity on the y-axis represents the expected number of mismatches between a tile and its nearest-neighbor probe sequence. (C) Detail of this cross-section.
Detection of transcription from known genes
Assuming that the observed positive correlations were at least partly due to features binding one or many common cDNA species relatively specifically, we sought to exploit the weak predictive power illustrated in Figure 2 for aiding transcript detection. For each transcript of length M curated into Refseq, we first identified those having >75% of their length covered by transcribed fragments, or ‘transfrags’, identified in the original Affymetrix study. These sequences were then divided up into all M-24 25 nt tiles computationally. Each of these tiles was then used as a query into the chip01 design, identifying the feature whose probe sequence most closely matches that of the query (Figure 1). We subsequently called this feature the tile's nearest-neighbor feature and assumed that, based on our observations from Figure 2, that this feature might have a small capacity for indicating transcription from this tile's corresponding genomic DNA.
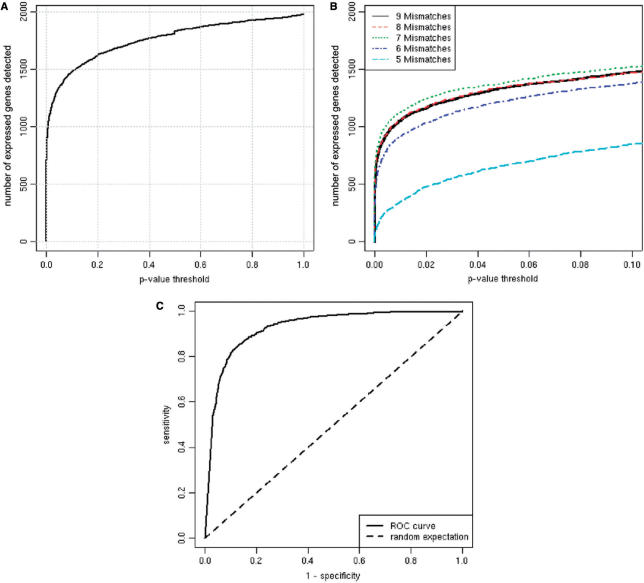
We then focused on a single hybridization of polyA-selected RNA from A375 cells and tested if the signals from nearest-neighbor features were higher than randomly selected features having the same GC content. At a significance threshold of P < 0.05, we were able to detect transcription at 71% of all Refseq genes with transfrag support, where we expected 5% simply by chance (Figure 3A). In Figure 3C, we plot the percent detected for a variety of thresholds. We also investigated the trade off that exists between the specificity of nearest-neighbor features with few mismatches and the rate at which such specific probe sequences occur (Figure 3B). We found that if we only accept nearest-neighbor features having seven or fewer mismatches, our method performed better than if we accepted nine of fewer mismatches. But when we further restricted our nearest-neighbors to five or fewer mismatches, the method performed much more poorly. Presumably, this is due to the paucity of nearest-neighbors that exist with so few mismatches. There clearly exists a tradeoff here that could be compensated for with greater array feature densities.
Figure 3.
Many genes are detected using nearest-neighbor features’ signals. (A) Significance was computed for every Refseq gene with at least 75% transfrag coverage using their nearest-neighbor features. These features were compared with features whose probes have identical GC content to compute their significance, or P-value (‘Methods’ section). (B) A tradeoff exists between the specificity of nearest-neighbor features and their coverage. We restricted the analysis depicted in panel (A) to nearest-neighbor features having at least 9, 8, 7, 6, or 5 mismatches. The ‘8 Mismatches’ series cannot be seen because it is nearly identical to that of ‘9 Mismatches’. Restricting to seven or fewer mismatches increases power because these probes are more specific to the nearest-neighbor target. Restricting further to six and to five mismatches decreases power because there are fewer probes that meet these criteria. (C) A set of known positives was defined as the Refseq genes with at least 75% transfrag coverage. A set of known negatives was constructed by permuting the sequences in the set of known positives. For various thresholds, sensitivity and specificity were computed and then plotted. Here, we have defined sensitivity as TP/(TP+FN) and specificity as TN/(TN+FP) where TP, TN, FP and FN stand for counts of true positives, true negatives, false positives and false negatives, respectively.
Nearest-neighbor estimates are biologically relevant
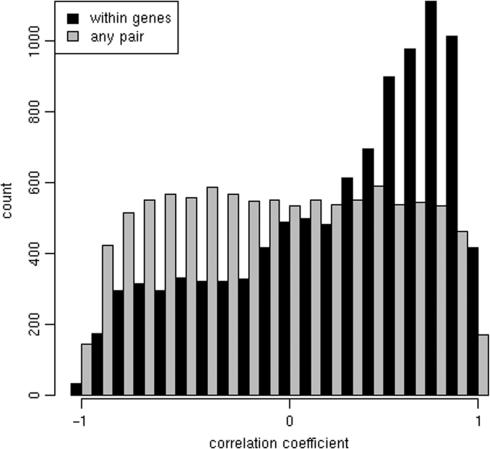
Beyond simple transcript identification, we expected that any gene expression platform would exhibit correlation between exons of the same gene since, when spliced together, they form a single transcriptional unit. We tested for this by first computing the average signal (as reported by nearest-neighbor features) for each exon within each hybridization. We then filtered the exons by testing whether they exhibit any cell line effects (P < 0.05, Kruskal–Wallis test). Correlation coefficients computed across all hybridizations were then recorded for randomly sampled pairs of exons from this filtered set and that belong to the same gene. Coefficients were also computed for randomly selected exons from the original set. These two sets of correlation coefficients were then binned and plotted in Figure 4. The observed differences between these two distributions suggest that exons within the same gene tend to be up- and down-regulated in unison as one would expect. This result furthered our conjecture that biologically relevant results can be seen in signals obtained through nearest-neighbor signal mapping.
Figure 4.
Nearest-neighbor-derived exon expression levels are correlated within genes. Nearest-neighbor features’ signals were averaged within each exon and hybridization. Correlation coefficients across the 33 hybridizations were computed between pairs of randomly selected exons and between exons from the same gene. The coefficients were binned and the differences plotted. Only exons exhibiting significant change across cell lines were included in the analysis (P < 0.05, Kruskal–Wallis test).
Nearest-neighbor estimates generally agree with PM estimates of signal
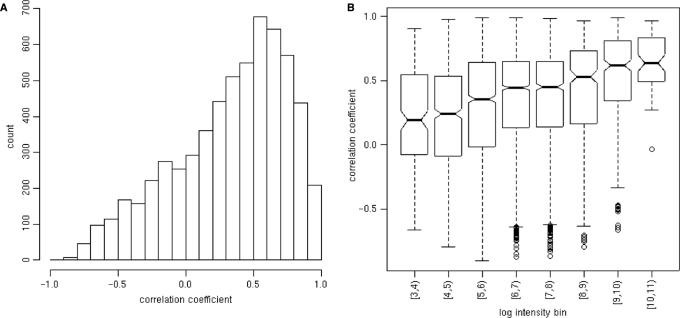
Going further, we expected that signals obtained from nearest-neighbor signals should correlate with signals obtained from perfect-match-derived signals obtained for the same gene. For all genes tiled by the Cheng et al. (19) data set, we computed the average signal obtained from their perfect matching features across each hybridization. We did the same for their nearest-neighbor features derived from chip01. Correlation coefficients were then computed for each gene between its perfect match and nearest-neighbor-derived signals. The distribution is summarized in Figure 5. We observed much greater correlation coefficients across samples than we expected by random chance but also that the coefficients were still relatively low. As expected, we also found that genes with higher expression levels led to higher correlation between perfect-match-derived signals and nearest-neighbor-derived signals.
Figure 5.
Agreement between perfect match and nearest-neighbor-derived gene summaries. Average signals were computed for each gene and for each hybridization. These summaries were computed using (1) only the nearest-neighbor probes from chip01 and (2) only perfect match probes from the entire experiment. Correlation coefficients between these summaries were computed for each gene across all hybridizations. (A) A histogram of these coefficients is shown. Genes having at least twenty perfect match features were included in this analysis. (B) Box plots of these coefficients are shown for different average logged intensity bins.
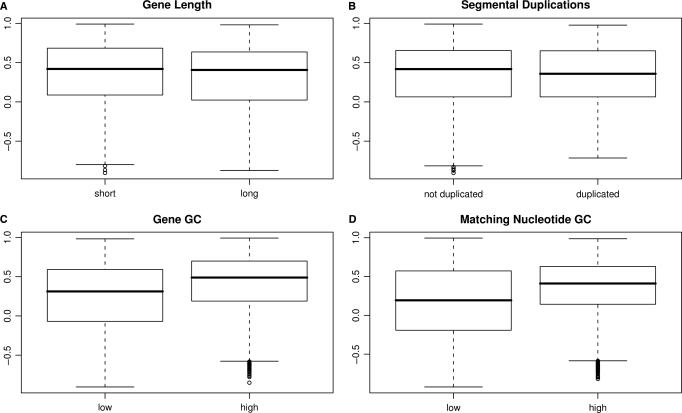
Given the above noted variability in the efficacy of our method, we next investigated the effect that various genomic properties have on our nearest-neighbor strategy (Figure 6). In each of the following three analyses, we again focused on correlations observed between perfect match and nearest-neighbor-derived gene profiles.
Figure 6.
Correlations between nearest-neighbor-derived gene summaries and perfect-match-derived gene summaries were binned on various criteria. (A) Genes were divided into ‘short’ and ‘long’ genes based on their length being less or greater than the median gene length. (B) Genes were binned based on whether or not they are present in known segmental duplications. (C) Genes were binned based on whether or not their GC content is less than or greater than the median GC content. (D) Genes were binned on their GC content (excluding nucleotides that mismatch with their nearest-neighbor probe). GC-contents greater than 50% were defined as ‘high’.
First, we hypothesized that longer genes might work better than shorter ones in our nearest-neighbor strategy since these transcripts have a larger number of measurements to average over, and therefore better smooth over noise potentially present in nearest-neighbor signals. A coarse comparison between long and short genes is depicted in Figure 6A. No striking relationship seemed to exist. However, we did find a statistically significant (P < 0.0004, Spearman's correlation) negative relationship between gene length and correlation but that the magnitude of this relationship (Spearman's ρ = −0.045) was extremely marginal. The relationship observed was probably obtained due to an unknown factor correlated with gene length, such as the increased likelihood of alternative splicing in longer transcripts, which is known to impact measurements in Affymetrix GeneChip brand microarrays (23).
Our second hypothesis considered a gene's presence within an annotated duplicated region of the genome. We, therefore, downloaded the Segmental Duplication Database (24) and divided the Refseq genes into those that are present within a duplication, and those that are not. Our hypothesis was that genes within duplicated regions might be more difficult to assay with nearest-neighbor features but we found no such relationship (Figure 6B).
Finally, we investigated the effect of GC content on our method's performance. This was pursued since one might expect that higher GC content within probes would lead to greater affinity for off-targets. We carried out this investigation with two related studies. First, we simply looked for any connection between correlation coefficients and the genes’ overall GC content. This was done by binning genes into those with more or less GC content than the median of all genes’ GC content (Figure 6C). Second, we restricted our calculation of GC content to those nucleotides which form perfect matches with their target subsequence (Figure 6D). The motivation for this latter examination is that the only nucleotides that might have provided any specificity are those that are complementary to their target. That is, if a guanine or cytosine is aligned with an adenine or a thymine, we would expect that any GC effect on correlation would be minimal. In both examinations, we found that genes with high GC-content tended to work better within our analysis scheme.
Choice of k
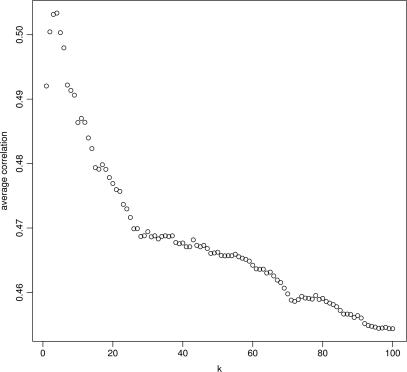
Our lookup scheme is essentially a k-nearest-neighbors query where we have set k = 1. We simply looked for the most similar probe sequence to each query. We also investigated whether setting k to larger values might boost nearest-neighbor-derived gene summaries’ correlation with their perfect-match-derived counterparts. Specifically, we re-submitted nearest-neighbor queries for 50 randomly selected genes and recorded the k nearest-neighbors for each subsequence where we varied k from 1 to 100. In Figure 7, we plot the average correlation coefficient obtained for the varying values of k. We found that we achieved peak mean correlation at k = 4, where after correlation dropped steadily. The overall improvement from k = 1 was small and, in our opinion, not significant enough to warrant the corresponding added complexity in our gene length, GC content and segmental duplication analyses.
Figure 7.
Correlations between k-nearest-neighbor-derived gene summaries and perfect-match-derived gene summaries are plotted for k = 1 … 100. For a given k, the k probe sequences closest to each tile were identified. A gene's expression summary is the average over all k probes’ signals for all tiles within the gene.
Nearest-neighbor estimates agree between array designs
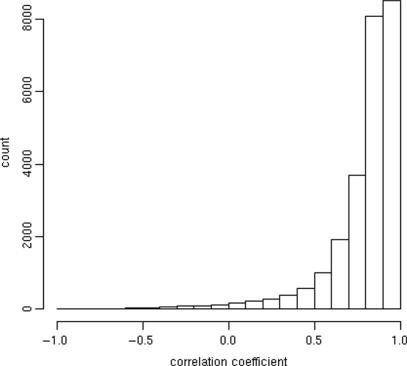
Finally, we wished to see if there exists agreement between nearest-neighbor-derived gene summaries derived from two different array designs and their corresponding hybridizations. In Figure 8, we plot a histogram that summarizes correlation coefficients between gene profiles derived from the two different nearest-neighbor lookups (from chip01 and chip02). We see reasonably good reproducibility despite the fact that we derived gene expression estimates from completely different datasets using unique array designs. This is a strong indicator of the robustness of the technique and for the ability of random probes to measure transcript abundances with good reproducibility.
Figure 8.
Nearest-neighbor features yield results comparable between array designs. Nearest-neighbor lookups were performed for two different tiling array designs. Each design was used for 33 hybridizations. Histograms of between-gene correlations are shown.
DISCUSSION
Tiling microarrays allow for unbiased analysis of genome function. This is achieved by allocating a microarray's features to probes that target genomic sequence at regularly spaced intervals. These intervals of genomic DNA are largely inactive in transcript mapping experiments. We sought to exploit these voids and the fact that short oligonucleotides can cross-hybridize to unintended sequences to measure gene expression solely with off-target nearest-neighbor features. Specifically, we have shown that these potentially cross-hybridizing features can detect the transcription of a large number of known genes. We complemented this analysis by showing that nearest-neighbor-derived summaries of exon expression correlate within genes, that nearest-neighbor-derived gene summaries correlate with perfect-match-derived gene summaries, and that nearest-neighbor summaries derived from different array designs agree with one another. Together, these findings provide evidence that a tiling microarray can function as a ‘universal’ array that could be applied to the study of any query nucleic acid sequence. This approach differs from the complete n-mer complement of oligos that traditionally define universal microarrays and is potentially useful for multi-species studies such as those being carried out by the ENCODE consortium.
In addition to our proof-of-principle work, we have quantified the main limitation of using our technique. This limitation manifests as a fair amount of gene-to-gene variation in how our nearest-neighbor strategy performs with respect to correlation with signals from traditional microarray measurements (Figure 5A). Therefore, we would urge that results obtained with our method be taken as suggestive and warranting of follow-up study with traditional, lower-throughput experiments. This suggestion is generally true for almost any microarray technology and is why these platforms are usually deemed hypothesis-generating ones. In our current work, we have extended this ability for hypothesis generation to a wider spectrum of applications and for a more inclusive list of species. While a greater fraction of the generated hypotheses are probably false, the technique still whittles down the large space of putative hypotheses to a more manageable list suitable for further experimentation.
The statistically significant trends present in our analyses further suggest that our approach could enable genomic-scale hypotheses to be investigated in non-model systems, where higher error rates are easily accommodated by large sample sizes (e.g. 20 000 genes). Such hypotheses might involve biological network prediction, sample clustering and classification or ontological analyses. Many valuable conclusions have been made by pursuing these questions in model organisms with traditional DNA microarrays, even when they were in their infancy and contained very high levels of gene-to-gene variability in their performance.
Again, the work that we have presented is largely a proof-of-principle. There are several extensions that could broaden the approach's usefulness. In the current work, we have used a very simple function for assessing tile:probe similarity, namely the number of mismatches between the two short oligonucleotide sequences. Functions based on their dinucleotide mismatch distance, Gibbs free energy, or length of longest common substring could be explored. Beyond changing the similarity function for finding a single nearest-neighbor probe, one can imagine using several nearest-neighbor probes’ expression profiles to predict the query's in a weighted fashion. For example, we have explored using different values for k in our k-nearest-neighbor lookups but found increasing k beyond k = 4 steadily decreased performance. We have not only concentrated on using k = 1 for simplicity in our analyses and discussion, but also because the increase in correlations with perfect match probes proved to be quite small (Figure 7). There are a plethora of further directions research in this area could go, especially when one considers various weighting functions. Here, we have limited ourselves to just the simplest of models for probe: target similarity to demonstrate feasibility.
Another area that might benefit from further research is the algorithm's runtime. As we have implemented our strategy, we compare a query sequence to each probe sequence within the database. Since there are upwards of five million probe sequences in the database, and query transcripts consist of thousands of queries, finding expression summaries for all of Refseq can be a time-consuming task (several days to lookup all of Refseq). Currently, we have used a brute-force parallelization to perform our lookups, but more elegant strategies may be applicable. One obvious approach would be to use short sub-sequence hashing to accelerate lookups. This could be achieved by splitting up a query into all of its component 8-mers, for example, and using these as keys into a data structure (such as a hash table or suffix tree) that records the identities of probes having all possible 8-mer sub-sequences. Such an approach would enable fast lookups and would find similar probe sequences but would not guarantee the identification of the nearest-neighbor probe. This is analogous to the ability of BLAST to identify very similar sequences to a query despite not guaranteeing the identification of the closest sequence within a nucleic acid database (25).
Our work has similar aims as those where one species’ genetic material is hybridized to arrays targeting that of another, closely related species. Both this strategy, and that described here, seek to obtain functional genomic data for unintended nucleic acid targets. Data obtained in this fashion can be used in comparative genomics and other evolution-based studies of gene expression, a currently very exciting field of study (26,27). It is likely that gene expression summaries derived from arrays targeting phylogenetic neighbors will yield better estimates of gene expression since the arrays’ probes would have few mismatches with their cross-species targets. However, the approach outlined in this article might be better suited for studies probing material from a number of different species since a random array would contain probes equally dissimilar to any of the target species sequences being studied. No biases can arise from platform selection with a random array.
Finally, the main conclusion we wish to make is that short oligonucleotide cross-hybridization is not necessarily a bad thing. In this work, we have exploited its presence to use a microarray for an unintended purpose. In doing so, we have demonstrated that microarrays need not consist completely of probe sequences that are perfect complements to the target nucleic acid. We believe that moving forward, the design of species-specific microarrays may want to take advantage of this fact as well.
ACKNOWLEDGEMENTS
Funding for this research and payment of Open Access publication charges was provided by the NIH under grant P50 HG02357-01. Many calculations in this work were made possible by the Yale Center for High Performance Computation in Biology and Biomedicine and NIH grant: RR19895-02, which funded the instrumentation. We thank Nick Carriero for assistance with streamlining our nearest neighbor code and Rob Bjornson for helping parallelizing the application.
Conflict of interest statement. None declared.
REFERENCES
- 1.Selinger DW, Cheung KJ, Mei R, Johansson EM, Richmond CS, Blattner FR, Lockhart DJ, Church GM. RNA expression analysis using a 30 base pair resolution Escherichia coli genome array. Nat. Biotechnol. 2000;18:1262–1268. doi: 10.1038/82367. [DOI] [PubMed] [Google Scholar]
- 2.Bertone P, Stolc V, Royce TE, Rozowsky JS, Urban AE, Zhu X, Rinn JL, Tongprasit W, Samanta M, et al. Global identification of human transcribed sequences with genome tiling arrays. Science. 2004;306:2242–2246. doi: 10.1126/science.1103388. [DOI] [PubMed] [Google Scholar]
- 3.Kapranov P, Cawley SE, Drenkow J, Bekiranov S, Strausberg RL, Fodor SPA, Gingeras TR. Large-scale transcriptional activity in chromosomes 21 and 22. Science. 2002;296:916–919. doi: 10.1126/science.1068597. [DOI] [PubMed] [Google Scholar]
- 4.Jeon Y, Bekiranov S, Karnani N, Kapranov P, Ghosh S, MacAlpine D, Lee C, Hwang DS, Gingeras TR, et al. Temporal profile of replication of human chromosomes. Proc. Natl Acad. Sci. USA. 2005;102:6419–6424. doi: 10.1073/pnas.0405088102. [DOI] [PMC free article] [PubMed] [Google Scholar]
- 5.ENCODE Project Consortium. Identification and analysis of funtional elements in 1% of the human geneome by the ENCODE pilot project. Nature. 2007;447:799–816. doi: 10.1038/nature05874. [DOI] [PMC free article] [PubMed] [Google Scholar]
- 6.Pease AC, Solas D, Sullivan EJ, Cronin MT, Holmes CP, Fodor SP. Light-generated oligonucleotide arrays for rapid DNA sequence analysis. Proc. Natl Acad. Sci. USA. 1994;91:5022–5026. doi: 10.1073/pnas.91.11.5022. [DOI] [PMC free article] [PubMed] [Google Scholar]
- 7.Drmanac R, Labat I, Brukner I, Crkvenjakov R. Sequencing of megabase plus DNA by hybridization: theory of the method. Genomics. 1989;4:114–128. doi: 10.1016/0888-7543(89)90290-5. [DOI] [PubMed] [Google Scholar]
- 8.Drmanac R, Drmanac S, Strezoska Z, Paunesku T, Labat I, Zeremski M, Snoddy J, Funkhouser WK, Koop B, et al. DNA sequence determination by hybridization: a strategy for efficient large-scale sequencing. Science. 1993;260:1649–1652. doi: 10.1126/science.8503011. [DOI] [PubMed] [Google Scholar]
- 9.Drmanac S, Kita D, Labat I, Hauser B, Schmidt C, Burczak JD, Drmanac R. Accurate sequencing by hybridization for DNA diagnostics and individual genomics. Nat. Biotechnol. 1998;16:54–58. doi: 10.1038/nbt0198-54. [DOI] [PubMed] [Google Scholar]
- 10.Yershov G, Barsky V, Belgovskiy A, Kirillov E, Kreindlin E, Ivanov I, Parinov S, Guschin D, Drobishev A, et al. DNA analysis and diagnostics on oligonucleotide microchips. Proc. Natl Acad. Sci. USA. 1996;93:4913–4918. doi: 10.1073/pnas.93.10.4913. [DOI] [PMC free article] [PubMed] [Google Scholar]
- 11.van Dam RM, Quake SR. Gene expression analysis with universal n-mer arrays. Genome Res. 2002;12:145–152. doi: 10.1101/gr.198901. [DOI] [PMC free article] [PubMed] [Google Scholar]
- 12.Roth ME, Feng L, McConnell KJ, Schaffer PJ, Guerra CE, Affourtit JP, Piper KR, Guccione L, Hariharan J, et al. Expression profiling using a hexamer-based universal microarray. Nat. Biotechnol. 2004;22:418–426. doi: 10.1038/nbt948. [DOI] [PubMed] [Google Scholar]
- 13.Kane MD, Jatkoe TA, Stumpf CR, Lu J, Thomas JD, Madore SJ. Assessment of the sensitivity and specificity of oligonucleotide (50mer) microarrays. Nucleic Acids Res. 2000;28:4552–4557. doi: 10.1093/nar/28.22.4552. [DOI] [PMC free article] [PubMed] [Google Scholar]
- 14.Bar-Or C, Bar-Eyal M, Gal TZ, Kapulnik Y, Czosnek H, Koltai H. Derivation of species-specific hybridization-like knowledge out of cross-species hybridization results. BMC Genomics. 2006;7:110. doi: 10.1186/1471-2164-7-110. [DOI] [PMC free article] [PubMed] [Google Scholar]
- 15.Brodsky LI, Jacob-Hirsch J, Avivi A, Trakhtenbrot L, Zeligson S, Amariglio N, Paz A, Korol AB, Band M, et al. Evolutionary regulation of the blind subterranean mole rat, Spalax, revealed by genome-wide gene expression. Proc. Natl Acad. Sci. USA. 2005;102:17047–17052. doi: 10.1073/pnas.0505043102. [DOI] [PMC free article] [PubMed] [Google Scholar]
- 16.Gilad Y, Rifkin SA, Bertone P, Gerstein M, White KP. Multi-species microarrays reveal the effect of sequence divergence on gene expression profiles. Genome Res. 2005;15:674–680. doi: 10.1101/gr.3335705. [DOI] [PMC free article] [PubMed] [Google Scholar]
- 17.Grigoryev DN, Ma S, Simon BA, Irizarry RA, Ye SQ, Garcia JGN. In vitro identification and in silico utilization of interspecies sequence similarities using GeneChip technology. BMC Genomics. 2005;6:62. doi: 10.1186/1471-2164-6-62. [DOI] [PMC free article] [PubMed] [Google Scholar]
- 18.Gibson G. Microarray analysis: genome-scale hypothesis scanning. PLoS Biol. 2003;1:E15. doi: 10.1371/journal.pbio.0000015. [DOI] [PMC free article] [PubMed] [Google Scholar]
- 19.Cheng J, Kapranov P, Drenkow J, Dike S, Brubaker S, Patel S, Long J, Stern D, Tammana H, et al. Transcriptional maps of 10 human chromosomes at 5-nucleotide resolution. Science. 2005;308:1149–1154. doi: 10.1126/science.1108625. [DOI] [PubMed] [Google Scholar]
- 20.Wu Z, Irizarry RA. Stochastic models inspired by hybridization theory for short oligonucleotide arrays. J. Comput. Biol. 2005;12:882–893. doi: 10.1089/cmb.2005.12.882. [DOI] [PubMed] [Google Scholar]
- 21.Bolstad BM, Irizarry RA, Astrand M, Speed TP. A comparison of normalization methods for high density oligonucleotide array data based on variance and bias. Bioinformatics. 2003;19:185–193. doi: 10.1093/bioinformatics/19.2.185. [DOI] [PubMed] [Google Scholar]
- 22.Karolchik D, Hinrichs AS, Furey TS, Roskin KM, Sugnet CW, Haussler D, Kent WJ. The UCSC table browser data retrieval tool. Nucleic Acids Res. 2004;32:493–496. doi: 10.1093/nar/gkh103. [DOI] [PMC free article] [PubMed] [Google Scholar]
- 23.Wang H, Hubbell E, Hu J, Mei G, Cline M, Lu G, Clark T, Siani-Rose MA, Ares M, et al. Gene structure-based splice variant deconvolution using a microarray platform. Bioinformatics. 2003;19(Suppl. 1):i315–i322. doi: 10.1093/bioinformatics/btg1044. [DOI] [PubMed] [Google Scholar]
- 24.She X, Jiang Z, Clark RA, Liu G, Cheng Z, Tuzun E, Church DM, Sutton G, Halpern AL, et al. Shotgun sequence assembly and recent segmental duplications within the human genome. Nature. 2004;431:927–930. doi: 10.1038/nature03062. [DOI] [PubMed] [Google Scholar]
- 25.Kent WJ. BLAT–the BLAST-like alignment tool. Genome Res. 2002;12:656–664. doi: 10.1101/gr.229202. [DOI] [PMC free article] [PubMed] [Google Scholar]
- 26.Khaitovich P, Hellmann I, Enard W, Nowick K, Leinweber M, Franz H, Weiss G, Lachmann M, Paabo S. Parallel patterns of evolution in the genomes and transcriptomes of humans and chimpanzees. Science. 2005;309:1850–1854. doi: 10.1126/science.1108296. [DOI] [PubMed] [Google Scholar]
- 27.Khaitovich P, Enard W, Lachmann M, Paabo S. Evolution of primate gene expression. Nat. Rev. Genet. 2006;7:693–702. doi: 10.1038/nrg1940. [DOI] [PubMed] [Google Scholar]


