


Abstract
Elucidating the mechanisms of the human transcriptional regulatory network is a major challenge of the post-genomic era. One important aspect is the identification and functional analysis of regulatory elements in non-coding DNA. Genomic sequence comparisons between related species can guide the discovery of cis-regulatory sequences. Using this technique, we identify a conserved region CNSmd of ∼775 bp in size, ∼14 kb upstream of the renin gene. Renin plays a pivotal role for mammalian blood pressure regulation and electrolyte balance. To analyse the cis-regulatory role of this region in detail, we perform 132 combinatorial reporter gene assays in an in vitro Calu-6 cell line model. To dissect the role of individual subregions, we fit several mathematical models to the experimental data. We show that a multiplicative switch model fits best the experimental data and that one subregion has a dominant effect on promoter activity. Mapping of the sub-sequences on phylogenetic conservation data reveals that the dominant regulatory region is the one with the highest multi-species conservation score.
INTRODUCTION
Circulating renin is of central importance for long term blood pressure regulation as well as for electrolyte balance in mammals (1). Renin production is regulated at different levels including transcriptional regulation. Many aspects of the transcriptional regulation of renin are not unravelled, although a number of functional cis-regulatory regions of the renin promoter have been identified (2–5). Non-coding DNA regions that regulate gene expression are often evolutionary conserved (6). Thus genomic sequence comparisons between related species may guide the discovery of cis-regulatory sequences (6). A study performed by Loots et al. showed that conserved elements can act over distances up to 120 kb in coordinating gene expression (7). By means of a phylogenetic foot-printing techniques, regulatory regions which confer muscle-specific expression have been identified (8).
The degree of conservation of non-coding sequences reflects evolutionary constraints. For example, if one compares experimentally validated murine enhancer sequences to those in the zebrafish genome it turns out that cis-elements important for developmental function are foremost conserved (9), indicating substantial constraints during development and their effect on conservation.
Tools to identify conserved regions comprise numerical algorithms analysing multispecies DNA blocks, such as BLASTZ, AVID, GLASS, LAGAN and others (10,11).
Having identified conserved non-coding DNA in proximity to a gene of interest, the next step in the analysis is to reveal the detailed functional relevance of an identified cis-regulatory region. A classic way to investigate a possible role of a DNA region is to perform reporter gene assays with different single restriction pieces of the DNA region under investigation. Mathematical modelling can further help to understand how elements in the regulatory regions orchestrate transcription. For example, a cis-regulatory input function has been studied in the bacterium Escherichia coli and it has been shown that the results of that study compare well with a mathematical model of the binding of the regulatory proteins cAMP receptor protein (CRP) and LacI to the lac regulatory region (12). Also eukaryotic transcription can be investigated using mathematical modelling. In an elaborate study dissecting the Endo16 promoter of the sea urchin, it has been shown that multiple operations may be performed in the promoter complex (13).
However, little is known about the complex operations of distant conserved cis-elements. We investigate a conserved region named CNSmd (conserved non-coding sequence in mouse and dog) of ∼775 bp in size, 14 kb upstream of the REN gene, which shows conservation in mouse and dog (Figure 1A). The genomic structure of CNSmd is shown in Figure 1C. We extend the classic technique of reporter gene assay analysis by designing combinatorial assays, i.e. reporter plasmids containing multiple combinations of the DNA region. This design made it possible to investigate the regulatory role of this CNSmd region in combinatorial reporter gene assays. For this purpose, we investigated the cis-regulatory role of four ∼200 bp parts of the CNSmd in multiple combinations. We explore in 132 assays how these cis-elements of a human conserved non-coding sequences (CNS) act on promoter activity under different conditions and how this action may be modelled. To extract the underlying patterns of the reporter gene activity we scored multiple mathematical models. This analysis reveals that a switch model describes the biological function of this evolutionary conserved region most appropriate. The significance of the results was tested against a random background model. The biological implication of the switch is underscored by a comparison of the model parameters and a multi-species conservation map which shows that the most important region in the model shows the highest conservation scores.
Figure 1.

(A, B) Percent identity plots (PIP). Each plot shows the position in the human sequence (horizontal axis) and the percent identity (vertical axis) of each aligning sequence of mouse and dog. This plot was used to identify the CNSmd region containing conserved sequences ∼14 kb upstream of REN. (B) shows the region of interest in a 21 kb window and (A) is a zoomed region containing the CNSmd. The plots are modified versions of plots generated using the PIPtool at www.dcode.org. The blue bars correspond to coding, the red bars to non-coding regions. (C) Genomic structure of the renin gene of four species. The conserved regions show different distances to the transcription start site in the four species. (D) Schematic description of vectors used in reporter gene assays. The CNSmd region was divided into four approximately equally sized overlapping parts CNS1 to CNS4. These four parts were tested in 11 different combinatorial constructs with respect to their action on promoter activity in luciferase assay. All possible 11 combinations with natural neighbouring relationships in CNSmd were cloned out of the 15 total possible combinations.
For many years, research in renin transcriptional regulation was hindered by the fact that an appropriate cell model was missing (14). In this work, we utilize one of the very few renin producing cell lines available nowadays, the human Calu-6 cell line (14–16).
RESULTS
Conserved non-coding region upstream of renin
Approximately 14 kb upstream of the human renin gene, a conserved region of ∼775 bp was identified. This region is named CNSmd. In comparison to the renin's upstream region of the dog and mouse genome, this region shows blocks that are highly conserved and show more than 75% identity as seen in Figure 1A and B. The genomic distance relationships of the conserved region are shown in Figure 1C for several mammalian species.
To elucidate the regulatory impact of the different parts of the CNSmd region on renin expression, we constructed 11 reporter constructs that contain the renin promoter and varying combinations of four equally sized parts of the identified conserved non-coding region upstream as shown in Figure 1D. The different promoter constructs exhibit different promoter activity when measured in the luciferase reporter gene assay. In addition, we tested the promoter activity under 12 different cellular conditions as obtained by the addition of substances which have an impact on cellular signalling cascades involved in blood pressure regulation. These different conditions provoke altered reporter activity. The detailed results of the 132 combinatorial reporter gene assays are given in Figure 2.
Figure 2.

Summary of measured reporter gene activity (mean and SD). A–M represent the 12 cellular conditions, respectively. Each subplot contains 11 bars corresponding to the 11 constructs which were analysed under the specific cellular condition.
Model selection
In order to elucidate whether all four regions of CNSmd have an influence on promoter activity and to understand how the four regions of the CNSmd act together to modulate the overall promoter activity, we constructed six mathematical models and tested which one explains the data best. We start with a minimal model that assumes that the effects of the four regions modulate the expression independently. We modified this model in three directions. First, we allowed for interactions between neighbouring regions (See Interaction Model Section). Second, to include specific transcriptional modulators reacting on a certain substance in the medium, we constructed a condition-specific model where each region modulates the promoter activity depending on the substance added. Third, we constructed a switch model (Figure 3A) where the most proximal region to the promoter is dominant. That is, if this region is in the construct, the other regions do not modify the promoter activity. The reason to construct such a model was first that the most proximal region had the highest influence on promoter activity. Second, we found that non-linearities that we introduced (data not shown) improved the goodness-of-fit drastically, and suggested that the most proximal region was dominant. Furthermore, we constructed a model where each region modulates expression in a multiplicative fashion, i.e. causes fold-changes on promoter activity. Finally, a combination of the switch and the multiplicative model was created, where CNS1-3 modulate the promoter activity multiplicatively and CNS4 is dominant over CNS1-3 such that if CNS4 is present in the construct, CNS1-3 have no influence. The models have different complexity, i.e. have different numbers of parameters. As more complex models usually yield better fits as they have more degrees of freedom, we tested the different complex models using two methods of model selection, namely the Akaike Information Criterion and the Likelihood Ratio Test (LRT).
Figure 3.

(A) Graphical representation of the selected switch model. The sum of the scaled influence of each CNS region is scaled by a condition-specific impact on the promoter. If CNS4 is present its influence becomes dominant. Gene activity from the experiments in comparison with the prediction of the switch model. (B) The reporter gene activity is shown for the 11 constructs and the 12 different cellular conditions. (C) The models prediction after fitting the switch model to the experimental data. The prediction fits well the data obtained in the experiments. The Pearson correlation coefficient between data and model prediction is 0.968.
We started with a simple linear model to fit the experimental results. The interaction model as well as the condition-specific model did not significantly increase the goodness-of-fit as compared with the minimal model according to the selection criteria. When a switch model was tested, it gave superior selection scores; hence it predicts the experimental data best (Figure 3A–C). The multiplicative model had significant advantage over the minimal model, and the combination of the multiplicative model and the switch model gave best scores and fitted significantly better than all other models (Table 1).
Table 1.
Summary for the parameters which were used to select and judge the models: two parameters were calculated, the Akaike Information Criterion (AIC) and the P-value of the Likelihood Ratio Test (LRT)
| AIC | LRT | |
|---|---|---|
| 1 Minimal model | 125.3 | |
| 2 Interacting model | 126.8 | P = 0.21 versus model 1 |
| 3 Condition-specific model | 338.9 | P = 0.97 versus model 1 |
| 4 Switch model | 105.4 | P < 0.001 versus model 1 |
| 5 Multiplicative model | 117.9 | P < 0.001 versus model 1 |
| 6 Multiplicative switch model | 104.0 | P < 0.001 versus model 5 |
| 6b Multiplicative switch model with reduced number of parameters | 95.3 | P = 0.37 versus model 6 |
Regulatory impact of the subregions
Having found a model that explains the data best, we asked the question whether all four regions have a significant influence on promoter activity. To investigate this, we set the influence of each of the regions to a fold change of one and fitted the model. In line with the model selection procedure described above, we tested whether these reduced models fit the data significantly worse. We find that all four parameters are essential to explain the data. The AICs of the models without influence of CNS1, 2, 3 and 4 are 112, 116, 112 and 242.7, respectively, corresponding to P-values below 0.005. Interestingly, the dominating impact of CNS4 and the fold-changes caused by the regions correspond well with the multi species conservation score (Figure 4), i.e. the region with the highest influence shows the highest evolutionary conservation.
Figure 4.

(A) Impact of the CNS regions on reporter gene activity. CNS4 shows the largest impact and this corresponds with a high conservation score. (B) The UCSC conservation score for the corresponding regions on the human chromosome 1. The conservation score was obtained from UCSC and refers to a joined comparison with seven other vertebrates. The dots represent the score and the bold line the moving average of the score.
Influence of 12 different cellular conditions on the promoter activity
Next, we investigated which of the 11 treatments have significant influence on the activity of the promoter. To investigate this, we tested all possible combinations of setting the parameters describing the influence of the 11 treatments to the parameter of the untreated cells (treatment number 12).
The best-scoring model is the model that has only free parameters for treatments 1 (adenosine), 5 (phorbolester), 8 (ethanol), 9 (retinoic acid) and 11 (low FCS) with an AIC 95.3. The parameters can be found in Table 1 of the Supplementary Data.
To obtain an estimate of the confidence intervals of our calculated parameters, we estimated the distribution of the model parameters in a bootstrapping procedure. Assuming that the experimental error is close to a Gaussian distribution (see Supplementary Figure 2), we added Gaussian noise to the predicted data with an SD based on an error model comprising the SD of the actual measurements and the absolute value of the measurement. The results of the parameters and their 5 and 95% confidence intervals are given in Table 1 of the Supplementary Data.
Sanity check by random background model
In order to exclude the possibility that our results may be explained simply by a random configuration, we generated a random background model. We shuffled the CNS composition of the constructs (by generating sets of construct where each construct has the same number of parts but randomly assigned to CNS1–4). For each shuffled sets, we have fitted the switch model and have estimated the prediction error. It turned out that the prediction error of the real situation is less than the 0.001 quantile of the distribution of prediction errors of the shuffled instances. Thus, we can reject the null hypothesis that our results may be explained by a random construct composition and thus provides evidence for the biological significance of our results. (For details, see Supplementary Figure 1).
DISCUSSION
Far distant regulatory regions may affect promoter activity to a large degree. Conservation in non-coding regions is an accepted guide to identify regulatory elements. We describe a conserved region of ∼800 bp in size, 14 kb upstream of the renin gene which is located upstream of a known 11 kb upstream regulatory region of the renin gene (17,18), and have investigated its regulatory role in newly developed combinatorial reporter gene assays. This conserved region exists in several mammalian species, such as human, dog, cow and mouse. We extend classical reporter gene analysis by a combinatorial cloning strategy with subsequent mathematical analysis of reporter gene activity. For this purpose, we have generated 11 reporter constructs with combinations of four subregions CNS1–4 with ∼200 bp in size. We measured reporter gene activity in 132 assays under 12 different cellular conditions. We aimed to investigate how the four regions act on the promoter activity and how this interaction may be described. Following the principle of maximum parsimony, we first considered a minimal model. Taking this model as an ancestor, we added three types of complexity to this minimal model. First, we included possible interactions between the four regions, second we allowed condition specific impact of each of the four regions and third, we implemented a non-linear transfer function. According to two widely used methods of model selections, namely the Akaike Information Criterion and the Likelihood Ratio Test, we have chosen the switch model, where the most proximal region to the promoter in the minimal model, CNS4, is dominant in regulation, i.e. the other regions do only contribute to regulation if there is no outside influence on CNS4. While varying our stimuli, we did not find a stimulus where the repression by CNS4 is inactive. Therefore, the regulatory function of this region remains to be further elucidated. The estimation of the CNS1- to CNS4- specific scaling parameters reveals that the influence on the gene activity is largest for region CNS4, for both, the minimal and the switch model. To corroborate this further, we have related this to a multi-species conservation score which we have obtained from University of California Santa Cruz Genome Bioinformatics server (UCSC, http://genome.ucsc.edu). Most interestingly, CNS4 which has the highest regulatory impact on gene activity shows the highest overall conservation scores for the regions under investigation. This fits well with the notion that regulatory important regions are under a higher evolutionary pressure.
Our modelling strategy identifies five tested cellular conditions to be important for modulating our reporter gene system, namely adenosine, phorbolester, ethanol, retinoic acid and low FCS. Adenosine did slightly stimulate the reporter gene activity. Adenosine is released from macula densa cells under high salt conditions. The effect of high salt load is a reduction in renin production (19). Thus, our finding of a slight increase suggests, that other regions than CNSmd modulate dominantly the adenosine effect in an in vivo situation. This is supported by the fact that the condition-specific model did not reveal an adenosine-specific impact on a subregion of CNSmd. Retinoic acid has been shown to stimulate renin transcription through the so-called renin enhancer (20) which is located ∼3 kb downstream of the CMSmd region. Retinoic acid showed in our system a repressing effect on the promoter activity. This finding is interesting, because it suggests that there are different competing influences from cis-regulatory regions acting on promoter activity. The strongest inducing effect on promoter activity was seen in our system by the condition ‘low serum’ (FCS). This condition constitutes a stress situation for cells, which has led to a strong induction of reporter gene activity. Several other conditions which are known to influence renin transcription such as angiotensin II (21) and vitamin D (22) did not show a modulating effect. One reason might be that the angiotensin II and vitamin D effects seen in other models are not mediated via the CNSmd conserved region. The modelling approach shows that the cellular conditions tested in our study do not affect the promoter activity in a subregion-specific manner for CNSmd. The reason for that might be that we did not apply a cellular condition which conveys a subregion-specific effect for subregions of CNSmd or that our cell line model lacks the required signal transducing elements.
The results of our investigation show that a multiplicative switch model fits well the experimental results obtained in reporter gene assays. The results of the tests with random noisy data underline the biological impact of the fitted parameters and the model predictions.
We were able to exclude the possibility, that the results might be explained by a random construct composition. This was done by a rigorous statistical analysis of the distribution of prediction errors of a model with shuffled CNS composition. The results of this analysis underscore the biological relevance of our findings, in particular the dominating role of CNS4.
We have subjected the CNS4 DNA sequence to a transcription factor binding analysis using the Transfac database. The complete result list of this analysis can be found in the Supplementary Table 2. Among the factors is, for instance, NF-Y (4) which has been shown to play a role in renin transcription in the region of the renal enhancer ∼3 kb downstream of CNS4 by competing with other factors. Further examples are multiple putative PAX family binding sites. Members of the PAX-family are important during foetal development (23). This might suggest that this region conveys signals during development. Further, in this list we find AREB6 as well as p300, both playing a role in cell type transitions (24). It is clear that all the individual putative binding sites and their corresponding trans-factors suggested by the theoretical analysis have to be addressed by further experimental approaches in order to confirm their potential role. An alternative explanation for activity modulation of is the nucleosome occupancy that may regulate availability of binding sites on the conserved regions and hence regulate promoter activity (25) which has to be addressed experimentally.
Renin production is complex and relies on a number of transcriptional and posttranscriptional (26,27) mechanisms modulated by cAMP (15,28) which is known to important for a number of genes via CREB cis-regulatory sites (29). We wish to point out that our analysis did not address the role other known cis-regulatory regions such as the CREB binding sites (30), regulatory regions in intron 1 (3), the LXR region (2), the chorionic enhancer (31) and the renal enhancer (17). Further, renin transcription depends on a number of factors which were not addressed in our study such as cAMP (28) and TNFalpha (32,33). Finally, the effects were only tested in one cell line and not in other cell lines, such as the Y-1 cell line (34).
Partitioning the 775 bp region into subregions might appear somewhat arbitrary but allows us to study the regions in an unbiased manner. The possibility of destroying putative regulatory sites has been excluded by design; since the analysed isolated subregions overlap each other (Figure 4). Therefore, the second most prominent peak is fully contained within CNS3, clearly seen from the fine mapped positions seen in Figure 4.
To obtain a good prediction in our approach, it was necessary to introduce inter-dependence in terms of a multiplicative model. This hints to the effect of possible competition in protein–DNA interactions. Our data indicates that at the chosen scale of 200 bp interaction plays a role and has to be considered in promoter studies. This finding is important in the context of biological studies of isolated cis-regulatory regions and demonstrates that the combinatorial cloning approach is able to extract additional information. Our findings and the statistical analysis underscore the usefulness of our combinatorial approach.
In summary, we have shown that a multiplicative switch model explains well the data obtained in our study of four conserved regions and their impact on promoter activity. The parameters of the model are specific for the genomic region CNS1–4. The experimental condition influenced gene activity in a modulating way. We were able to identify experimental conditions with a high impact on promoter activity. The cis-region of highest impact on promoter activity is CNS4. This corresponds with highest conservation in a multi species comparison. This finding is compatible with the notion that there is an evolutionary pressure on regulatory sites which leads to evolutionary conservation. The biological impact of the predictions was further verified by testing the prediction errors against a randomized model, and it was clearly shown that the error of the model is at the lower tail of the distribution.
Our combinatorial cloning strategy in combination with high-throughput assay systems together with modern methods of system analysis offer the possibility to study the cis-regulatory role of DNA subregions in detail and are capable to discover important regulatory regions and to characterize their action on promoter activity.
MATERIALS AND METHODS
Identification of CNSmd
A CNS of 775 bp was identified on the human chromosome 1 at position (200881908–200881134, HG17 assembly, May 2004) which shows conservation when compared to mouse and dog. This region is located ∼14 kb upstream of the REN gene. This CNS was named CNSmd (Figure 1). This identification was done by visual inspection of the upstream region of the human renin gene using the web interface software ECR Browser at www.dcode.org with the standard default parameters.
Molecular cloning
We constructed Firefly-Luciferase reporter gene constructs using the pGL3-basic (Promega, E1751) as a backbone. First, we cloned the canonical promoter (−1 to −218) of the REN gene into the pGL3 basic at the multiple cloning site (MCS) and obtained the pGL3mp. During this cloning step, the MCS was extended by an adapter to allow convenient further cloning steps. In the second step, we generated 10 further constructs (in total 1–11) by inserting combinations of four approximately equally sized CNS1 to CNS4 which are part of the 775 bp CNSmd segment in the pGL3mp. Parts overlapped in order not to destroy regulatory sequences on the boundaries. The exact positions of the segments are given in Supplementary Table 3. The combinatorial summary of the constructs 1–11 is shown in Figure 1D. Cloning was achieved by PCR amplification of CNS1 to CNS4 and combinations thereof with specific primer overhangs for restriction digestion, restriction and ligation of the appropriate fragments. We used a genomic human BAC AL592114 (obtained from RZPD, Germany) as template for PCR reactions. The sequence of each plasmid was checked by sequencing.
Cell culture
Human Calu-6 cells (15,16) from the American Type Culture Collection (ATCC #HTB-56) were cultured in MEM with Earle's salt supplemented with 2 mmol/l l-glutamine, 7.5% sodium bicarbonate, 1x non-essential amino acids, 1 mM sodium pyruvate, 100 U/ml penicillin, 100 μg/ml streptomycin and 10% FCS (Biochrom KG, Germany). Cells were grown at 37°C in humidified air with 5% CO2.
Transfection
Experiments were performed in 96 well cell culture plates (Greiner bio-one, Germany, µclear white #655098). On 80% confluence Calu-6 cells were transfected with the Firefly-Luciferase constructs (100 ng) using 0.8 µl FuGENE 6 Transfection agent (Roche, Category Number 1815075) and 75 µl medium (DMEM-High Glucose, HEPES, P/S/G). The cells were co-transfected in the same reaction with (100 ng) Renilla-Luciferase Plasmid phRL-TK (Promega, E6241) as internal control for normalization.
Perturbation of cellular condition
We modified cell culture medium and generated 12 different cellular environments 24 h after transfection. (i) adenosine 10−7M, (ii) aldosteron 10−7M, (iii) angiotensin I 10−7M, (iv) angiotensin II 10−7M, (v) phorbolester 10−7M, (vi) atrial natriuretic peptide (ANP) 10−7M, (vii) dopamin 10−7M, (viii) ethanol 0.1%, (ix) retinoic acid 10−7M, (x) vitamin D 10−7, (xi) low FCS (0.5%) and (xii) normal medium denoting condition 1 to 12, respectively. All pharmacological compounds were obtained from Sigma-Aldrich.
Reporter gene assays
Cells were lysed 48 h after transfection using 30 µl passive lysis buffer (Promega, E1941) after medium removal and gentle washing with PBS. The assays were performed on the Luminoskan RS (Sweden) plate-luminometer using the injector system. The firefly luminescence was measured by injecting 100 µl of buffer 1 (470 µM d-luciferin, 27 µM Coencym A, 33.3 mM DTT, 530 µM ATP, 2.67 mM MgSO4, 20 mM Tricine, 0.1 mM EDTA) and the renilla luminescence was measured after injecting 100 µl of buffer 2 [1.1 M NaCl, 2.2 mM Na2EDTA, 0.22 M KxPO4 (pH 5.1), 0.44 mg/ml BSA, 1.3 mM NaN3, 1.43 µM Coelenterazin, adjusted finally to pH 5.0, all compounds were obtained from PJK, Germany]. The device Luminoskan RS was automatically controlled using customized software (in-house development by RM).
Data analysis
The relative light units of firefly luminescence were divided by the relative light units of renilla luminescence of each well to obtain normalization with respect to cell number and transfection efficacy. Each experiment was performed four times and the mean value was calculated.
Models
We developed four models to describe the expression Eij of construct i under cellular condition j: a minimal model assuming condition-independent action of the four regulatory regions, an interaction model, where the regulatory regions show interactions with each other, a model where the regulatory region act condition specific, and a switch model, where the regulatory regions influence the promoter activity in a non-linear way. The latter three models are extensions of the minimal model.
The models are described below. The structure of the constructs is reflected in matrix m where mik is 1 if region k is present in construct i (i = 1,2, …,11), and is 0 otherwise (Figure 1D). For example the raw i = 6 in Figure 1D reads 0,1,1,0,1 since the sixth construct contains CNS2, CNS3 and the promoter.
Minimal model
The promoter activity pj (j = 1,2, …,12) depends on the condition j. It is assumed that the regulatory regions k = 1.4 modulate the expression independently of the condition with weights ak:
 |
This model has 12 + 4 = 16 parameters.
Interaction model
In this model, two regions may interact with weights bk (k = 1,2,3) if they are neighbours.
 |
With the additional three interaction parameters, this model possesses 19 parameters.
Condition-specific usage of the regulatory regions
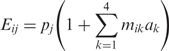
In this model, we assume that each regulatory region has an independent, additive influence on the expression. The activity of each region is dependent on the condition. Expression of construct i at condition j can then be calculated as:
where aki represents the condition-specific influence of region k on the promoter. This model has 12 × 4 = 48 parameters.
Switch model
The analysis of the minimal model revealed that CNS4 has the most prominent influence on promoter activity. To test, if a non-linear influence of CNS4 enhances the predictions we introduced a switch model defined in the following way: The promoter activity pj (j = 1,2, …,12) depends on the condition j and on the presence of CNS4. It is assumed that the regulatory regions k = 1.3 modulate the expression independently of the condition with weights ak and if CNS4 is present the expression depends only on ak (k = 4) and pj (j = 1,2, …,12):
If construct i does not contain CNS4:
if construct i contains CNS4:
This model has 12 + 4 = 16 parameters.
Multiplicative model
In this model each region modulates the promoter activity multiplicatively, i.e. causes fold-changes.
This model has 16 parameters.
Multiplicative switch model
This model combines the multiplicative model and the switch model. That is, if CNS4 is present, this dominates:
Otherwise expression is given as in the multiplicative model:
A graphical representation of the switch model is given in Figure 3A.
Fitting (least square, error model)
We used a maximum-likelihood method (35) to find optimal parameters for the model. Utilizing the matlab-function lsqnonlin, we searched for parameters minimizing the χ2-distance between the data and the model (this method is also referred to as weighted least square fit):
where Eij are the expression values given by the model, Dij are the measured expression values and  is the variance of data point Dij. A critical point in this fitting procedure is to estimate the variance correctly. For each data point, we had four measurements from which we estimated each data point's variance. As underestimated variances will give higher weight to the corresponding data points, we smoothed the values by applying a mixture model, estimating by the mean of the variances from the measurements and of a variance given by a linear error model:
The values a and b were obtained by linear regression. The assumption of this error model is that the measurement errors and residuals are normally distributed, which is appropriate here (compare Supplementary Figure 2).
Model selection: Likelihood Ratio Test and Akaike Information Criterion
We started the fitting procedure from the minimal model and extended the model in several directions: by allowing interactions, by including condition-specific regulation and by including regulation by a dominant element at CNS4. As the extended models are richer in behaviour and possess a higher number of parameters, their fits will always yield higher likelihood values. To assess, whether an extension allows for better description of the data or is just over-fitting the data, we used two methods: Likelihood Ratio Test (LRT) (36) and Akaike Information Criterion (AIC) (37). The LRT calculates the P-value under which the fit of the extended model can be obtained under the null hypothesis that the true model is the minimal model. In contrast, AIC comes from information theory and scores the models penalizing more parameters. According to the AIC framework, the model having the smallest AIC is to be chosen. AIC is calculated by:
where g is an arbitrarily chosen constant (but has to be the same for all models). For the entire analysis, it is important that the error is close to a Gaussian distribution which we checked by inspecting qq-plots and histograms for the experimental error and the residuals (see Supplementary Figure 2).
Estimating confidence interval of parameters
To estimate the confidence interval of the fitted parameters, a bootstrapping procedure was applied: we used the fitted model to generate a data set, and subsequently added noise from the linear error model. The model was then fitted to these generated data sets and the distribution of the fitted parameters was taken as an estimate of the distribution of the real parameter. The 5 and 95% quantiles were used to define a confidence interval for the parameters.
Multi-species conservation comparisons
Data for multi species conservation was obtained from http://genome.ucsc.edu/ in April 2005. The conservation score relates to human chromosome position and refers to a joined comparison with Chimp (panTro1, November 2003)–Dog (canFam1, July 2004)–Mouse (mm5, May 2004)–Rat (rn3, June 2003)–Chicken (galGal2, February 2004)–Zebrafish (danRer1, November 2003)–Fugu (fr1, August 2002).
SUPPLEMENTARY DATA
Supplementary Data are available at NAR Online.
ACKNOWLEDGEMENTS
We thank Thomas Maiwald for very helpful discussions on model selection. N.B. acknowledges support from DFG (SFB 618) and BMBF (Bernstein Center for Computational Neuroscience Berlin). R.M. acknowledges support from a habilitation grant from Charité, Humboldt University. Funding to pay the Open Access publication charges for this article was provided by DFG project number TH 459/5.
Conflict of interest statement: None declared.
REFERENCES
- 1.Persson PB, Skalweit A, Mrowka R, Thiele BJ. Control of renin synthesis. Am. J. Physiol. Regul. Integr. Comp. Physiol. 2003;285:R491–R497. doi: 10.1152/ajpregu.00101.2003. [DOI] [PubMed] [Google Scholar]
- 2.Morello F, de Boer RA, Steffensen KR, Gnecchi M, Chisholm JW, Boomsma F, Anderson LM, Lawn RM, Gustafsson JK, et al. Liver X receptors alpha and beta regulate renin expression in vivo. J. Clin. Invest. 2005;115:1913–1922. doi: 10.1172/JCI24594. [DOI] [PMC free article] [PubMed] [Google Scholar]
- 3.Voigtlander T, Ganten D, Bader M. Transcriptional regulation of the rat renin gene by regulatory elements in intron I. Hypertension. 1999;33:303–311. doi: 10.1161/01.hyp.33.1.303. [DOI] [PubMed] [Google Scholar]
- 4.Shi Q, Gross KW, Sigmund CD. NF-Y antagonizes renin enhancer function by blocking stimulatory transcription factors. Hypertension. 2001;38:332–336. doi: 10.1161/01.hyp.38.3.332. [DOI] [PubMed] [Google Scholar]
- 5.Pan L, Black TA, Shi Q, Jones CA, Petrovic N, Loudon J, Kane C, Sigmund CD, Gross KW. Critical roles of a cyclic AMP responsive element and an E-Box in regulation of mouse renin gene expression. J. Biol. Chem. 2001;276:45530–45538. doi: 10.1074/jbc.M103010200. [DOI] [PubMed] [Google Scholar]
- 6.Hardison RC. Conserved noncoding sequences are reliable guides to regulatory elements. Trends Genet. 2000;16:369–372. doi: 10.1016/s0168-9525(00)02081-3. [DOI] [PubMed] [Google Scholar]
- 7.Loots GG, Locksley RM, Blankespoor CM, Wang ZE, Miller W, Rubin EM, Frazer KA. Identification of a coordinate regulator of interleukins 4, 13, and 5 by cross-species sequence comparisons. Science. 2000;288:136–140. doi: 10.1126/science.288.5463.136. [DOI] [PubMed] [Google Scholar]
- 8.Wasserman WW, Fickett JW. Identification of regulatory regions which confer muscle-specific gene expression. J. Mol. Biol. 1998;278:167–181. doi: 10.1006/jmbi.1998.1700. [DOI] [PubMed] [Google Scholar]
- 9.Plessy C, Dickmeis T, Chalmel F, Strähle U. Enhancer sequence conservation between vertebrates is favoured in developmental regulator genes. Trends Genet. 2005;21:207–210. doi: 10.1016/j.tig.2005.02.006. [DOI] [PubMed] [Google Scholar]
- 10.Prakash A, Tompa M. Discovery of regulatory elements in vertebrates through comparative genomics. Nat. Biotechnol. 2005;23:1249–1256. doi: 10.1038/nbt1140. [DOI] [PubMed] [Google Scholar]
- 11.Cooper GM, Sidow A. Genomic regulatory regions: insights from comparative sequence analysis. Curr. Opin. Genet. Dev. 2003;13:604–610. doi: 10.1016/j.gde.2003.10.001. [DOI] [PubMed] [Google Scholar]
- 12.Setty Y, Mayo AE, Surette MG, Alon U. Detailed map of a cis-regulatory input function. Proc. Natl Acad. Sci. USA. 2003;100:7702–7707. doi: 10.1073/pnas.1230759100. [DOI] [PMC free article] [PubMed] [Google Scholar]
- 13.Yuh CH, Bolouri H, Davidson EH. Genomic cis-regulatory logic: experimental and computational analysis of a sea urchin gene. Science. 1998;279:1896–1902. doi: 10.1126/science.279.5358.1896. [DOI] [PubMed] [Google Scholar]
- 14.Sigmund CD. Regulation of renin expression and blood pressure by vitamin D(3) J. Clin. Invest. 2002;110:155–156. doi: 10.1172/JCI16160. [DOI] [PMC free article] [PubMed] [Google Scholar]
- 15.Lang JA, Ying LH, Morris BJ, Sigmund CD. Transcriptional and posttranscriptional mechanisms regulate human renin gene expression in Calu-6 cells. Am. J. Physiol. 1996;271:F94–F100. doi: 10.1152/ajprenal.1996.271.1.F94. [DOI] [PubMed] [Google Scholar]
- 16.Lang JA, Yang G, Kern JA, Sigmund CD. Endogenous human renin expression and promoter activity in CALU-6, a pulmonary carcinoma cell line. Hypertension. 1995;25:704–710. doi: 10.1161/01.hyp.25.4.704. [DOI] [PubMed] [Google Scholar]
- 17.Yan Y, Jones CA, Sigmund CD, Gross KW, Catanzaro DF. Conserved enhancer elements in human and mouse renin genes have different transcriptional effects in As4.1 cells. Circ. Res. 1997;81:558–566. doi: 10.1161/01.res.81.4.558. [DOI] [PubMed] [Google Scholar]
- 18.Shi Q, Black TA, Gross KW, Sigmund CD. Species-specific differences in positive and negative regulatory elements in the renin gene enhancer. Circ. Res. 1999;85:479–488. doi: 10.1161/01.res.85.6.479. [DOI] [PubMed] [Google Scholar]
- 19.Bader M, Ganten D. Regulation of renin: new evidence from cultured cells and genetically modified mice. J. Mol. Med. 2000;78:130–139. doi: 10.1007/s001090000089. [DOI] [PubMed] [Google Scholar]
- 20.Pan L, Gross KW. Transcriptional regulation of renin: an update. Hypertension. 2005;45:3–8. doi: 10.1161/01.HYP.0000149717.55920.45. [DOI] [PubMed] [Google Scholar]
- 21.Muller MW, Todorov V, Kramer BK, Kurtz A. Angiotensin II inhibits renin gene transcription via the protein kinase C pathway. Pflugers Arch. 2002;444:499–505. doi: 10.1007/s00424-002-0835-8. [DOI] [PubMed] [Google Scholar]
- 22.Li YC, Kong J, Wei M, Chen ZF, Liu SQ, Cao LP. 1,25-Dihydroxyvitamin D3 is a negative endocrine regulator of the renin-angiotensin system. J. Clin. Invest. 2002;110:229–238. doi: 10.1172/JCI15219. [DOI] [PMC free article] [PubMed] [Google Scholar]
- 23.Smith SB, Ee HC, Conners JR, German MS. Paired-homeodomain transcription factor PAX4 acts as a transcriptional repressor in early pancreatic development. Mol. Cell. Biol. 1999;19:8272–8280. doi: 10.1128/mcb.19.12.8272. [DOI] [PMC free article] [PubMed] [Google Scholar]
- 24.Pena C, Garcia JM, Garcia V, Silva J, Dominguez G, Rodriguez R, Maximiano C, Garcia DH, Munoz A, et al. The expression levels of the transcriptional regulators p300 and CtBP modulate the correlations between SNAIL, ZEB1, E-cadherin and vitamin D receptor in human colon carcinomas. Int. J. Cancer. 2006;119:2098–2104. doi: 10.1002/ijc.22083. [DOI] [PubMed] [Google Scholar]
- 25.Liu X, Lee CK, Granek JA, Clarke ND, Lieb JD. Whole-genome comparison of Leu3 binding in vitro and in vivo reveals the importance of nucleosome occupancy in target site selection. Genome Res. 2006;16:1517–1528. doi: 10.1101/gr.5655606. [DOI] [PMC free article] [PubMed] [Google Scholar]
- 26.Skalweit A, Doller A, Huth A, Kahne T, Persson PB, Thiele BJ. Posttranscriptional control of renin synthesis: identification of proteins interacting with renin mRNA 3′-untranslated region. Circ. Res. 2003;92:419–427. doi: 10.1161/01.RES.0000059300.67152.4E. [DOI] [PubMed] [Google Scholar]
- 27.Adams DJ, Beveridge DJ, Van Der WL, Mangs H, Leedman PJ, Morris BJ. HADHB, HuR and CP1 Bind to the Distal 3′-UTR of human renin mRNA and differentially modulate renin expression. J. Biol. Chem. 2003;278:44894–44903. doi: 10.1074/jbc.M307782200. [DOI] [PubMed] [Google Scholar]
- 28.Smith DL, Morris BJ, Do YS, Law RE, Shaw KJ, Hseuh WA. Identification of cyclic AMP response element in the human renin gene. Biochem. Biophys. Res. Commun. 1994;200:320–329. doi: 10.1006/bbrc.1994.1451. [DOI] [PubMed] [Google Scholar]
- 29.Shepard AR, Zhang W, Eberhardt NL. Two CGTCA motifs and a GHF1/Pit1 binding site mediate cAMP-dependent protein kinase A regulation of human growth hormone gene expression in rat anterior pituitary GC cells. J. Biol. Chem. 1994;269:1804–1814. [PubMed] [Google Scholar]
- 30.Horiuchi M, Nakamura N, Tang SS, Barrett G, Dzau VJ. Molecular mechanism of tissue-specific regulation of mouse renin gene expression by cAMP. Identification of an inhibitory protein that binds nuclear transcriptional factor. J. Biol. Chem. 1991;266:16247–16254. [PubMed] [Google Scholar]
- 31.Pinet F, Corvol MT, Bourguignon J, Corvol P. Isolation and characterization of renin-producing human chorionic cells in culture. J. Clin. Endocrinol. Metab. 1988;67:1211–1220. doi: 10.1210/jcem-67-6-1211. [DOI] [PubMed] [Google Scholar]
- 32.Chen LS, Cuddy MP, LaVallette LA. Regulation of human renin gene promoter activity: a new negative regulatory region determines the responsiveness to TNF alpha. Kidney Int. 1998;54:2045–2055. doi: 10.1046/j.1523-1755.1998.00209.x. [DOI] [PubMed] [Google Scholar]
- 33.Todorov V, Muller M, Schweda F, Kurtz A. Tumor necrosis factor-alpha inhibits renin gene expression. Am. J. Physiol. Regul. Integr. Comp. Physiol. 2002;283:R1046–R1051. doi: 10.1152/ajpregu.00142.2002. [DOI] [PubMed] [Google Scholar]
- 34.Chen LS, Cuddy MP, LaVallette LA. Regulation of human renin gene promoter activity: a new negative regulatory region determines the responsiveness to TNF alpha. Kidney Int. 1998;54:2045–2055. doi: 10.1046/j.1523-1755.1998.00209.x. [DOI] [PubMed] [Google Scholar]
- 35.Press W, Teukolsky S. Numerical Recipes In C:The Art of Scientific Computing. In: Teukolsky Saul A, Vetterling William T., editors. 2nd ed. Cambridge University Press; 1992. [Google Scholar]
- 36.Timmer J, Müller TG, Swameye I, Sandra O, Klingmüller U. Modelling the nonlinear dynamics of cellular signal transduction. Int. J. Bifurcat.Chaos. 2004;14:2069–2079. [Google Scholar]
- 37.Burnham KP, Anderson DR. Model Selection and Inference: A Practical Information-Theoretic Approach. Heidelberg, Germany: Springer; 1998. [Google Scholar]
Associated Data
This section collects any data citations, data availability statements, or supplementary materials included in this article.