


Abstract
The prediction of operons in Mycobacterium tuberculosis (MTB) is a first step toward understanding the regulatory network of this pathogen. Here we apply a statistical model using logistic regression to predict operons in MTB. As predictors, our model incorporates intergenic distance and the correlation of gene expression calculated for adjacent gene pairs from over 474 microarray experiments with MTB RNA. We validate our findings with known examples from the literature and experimentation. From this model, we rank each potential operon pair by the strength of evidence for cotranscription, choose a classification threshold with a true positive rate of over 90% at a false positive rate of 9.1%, and use it to construct an operon map for the MTB genome.
INTRODUCTION
One-third of humans worldwide are infected with the latent form of tuberculosis (TB), and almost two million people die each year from the deadly disease. To be such a successful pathogen, Mycobacterium tuberculosis (MTB) adapts to myriad stresses at each stage of infection. Challenges to MTB's survival include reactive oxygen and nitrogen species of activated macrophages, low pH, hypoxia, anti-microbial peptides and starvation for essential nutrients. In addition, bacteria expelled from the host are often challenged with exposure to UV light, dehydration, starvation and low temperature. Because MTB survives most or all of these challenges by transcriptional regulation (1), understanding transcription extends our ability to disrupt MTB's life cycle.
Studies of MTB to date suggest that transcription is as complex and varied as it is in other prokaryotes. For example, the genome shows approximately 190 putative transcriptional regulators. Even in the best studied class, MTB's 13 different sigma factors, complexity and unanswered questions are common (2,3) to date only five (SigA, SigC, SigE, SigF and SigH) have a defined putative promoter consensus sequence (1). In addition, the genome contains at least five anti-sigma factors, each of which conduct post-translational regulation of one or more sigma factors, and seven genes encoding anti-anti-sigma factors. Furthermore, the examples of transcripts studied to date demonstrate that even within a single well-characterized operon, transcriptional regulation can be complex in MTB: alternative internal promoters and competing promoters on the opposite strand have been identified (4); single genes may be regulated by multiple promoters (5); and, as in other prokaryotes, supercoiling plays a role in gene expression (6). Finally, little is known about transcription termination in MTB; a recent study found that transcriptional terminators could be found with only 15% sensitivity between opposite-strand genes, one of the worst rates for 96 species examined (7).
Other than genes themselves, operons are the most basic unit of organization in bacterial genomes, and they provide the basis for understanding transcriptional regulation and the entire regulatory network of an organism. A search of the MTB literature, however, reveals relatively few well-defined operons (Table 1). The prediction of a complete operon map of the MTB genome would be a major milestone in understanding this important pathogen.
Table 1.
Known operons in MTB, along with the source of published evidence of laboratory confirmation. This table also includes gene pairs (which may or may not represent complete operons) whose cotranscription was verified in our laboratory by RT-PCR (see Materials and Methods section). Annotation for genes are derived from Tuberculist (http://genolist.pasteur.fr/TubercuList/). Adjacent genes descriptions are separated by a semicolon
| Operon (or gene pair) name | Gene pairs | Annotation | Source |
|---|---|---|---|
| Rv0167-Rv0174 | 7 | CONSERVED HYPOTHETICAL INTEGRAL MEMBRANE PROTEIN YRBE1A; CONSERVED HYPOTHETICAL INTEGRAL MEMBRANE PROTEIN YRBE1B; MCE-FAMILY PROTEIN MCE1A; MCE-FAMILY PROTEIN MCE1B; MCE-FAMILY PROTEIN MCE1C; MCE-FAMILY PROTEIN MCE1D; POSSIBLE MCE-FAMILY LIPOPROTEIN LPRK | (14) |
| Rv490-Rv491 | 1 | TWO COMPONENT REGULATORY SYSTEM SenX3;RegX3 | (15) |
| Rv933-Rv0936 | 3 | PHOSPHATE-TRANSPORT ATP-BINDING PROTEIN ABC TRANSPORTER PSTB; PERIPLASMIC PHOSPHATE-BINDING LIPOPROTEIN PSTS1 (PBP-1) (PSTS1); PHOSPHATE-TRANSPORT INTEGRAL MEMBRANE ABC TRANSPORTER PSTC1; PHOSPHATE-TRANSPORT INTEGRAL MEMBRANE ABC TRANSPORTER PSTA | (16) |
| Rv0986-Rv0988 | 2 | PROBABLE ADHESION COMPONENT TRANSPORT ATP-BINDING PROTEIN ABC TRANSPORTER; PROBABLE ADHESION COMPONENT TRANSPORT ATP-BINDING PROTEIN ABC TRANSPORTER; POSSIBLE CONSERVED EXPORTED PROTEIN | (17) |
| Rv1161-Rv1164 | 3 | PROBABLE RESPIRATORY NITRATE REDUCTASE (ALPHA CHAIN) NARG; PROBABLE RESPIRATORY NITRATE REDUCTASE (BETA CHAIN) NARH; PROBABLE RESPIRATORY NITRATE REDUCTASE (DELTA CHAIN) NARJ; PROBABLE RESPIRATORY NITRATE REDUCTASE (GAMMA CHAIN) NARI | (18) |
| Rv1411c-Rv1410c | 1 | PROBABLE CONSERVED LIPOPROTEIN LPRG; AMINOGLYCOSIDES/TETRACYCLINE-TRANSPORT INTEGRAL MEMBRANE PROTEIN | (19) |
| Rv1477-Rv1478 | 1 | HYPOTHETICAL INVASION PROTEIN; HYPOTHETICAL INVASION PROTEIN | (20) |
| Rv1483-Rv1484 | 1 | 3-OXOACYL-[ACYL-CARRIER PROTEIN] REDUCTASE FABG1; NADH-DEPENDENT ENOYL-[ACYL-CARRIER-PROTEIN] REDUCTASE INHA | (21) |
| Rv1964-Rv1966 | 2 | CONSERVED HYPOTHETICAL INTEGRAL MEMBRANE PROTEIN YRBE3A; CONSERVED HYPOTHETICAL INTEGRAL MEMBRANE PROTEIN YRBE3B; MCE-FAMILY PROTEIN MCE3A | (22) |
| Rv1966-Rv1971 | 5 | MCE-FAMILY PROTEIN MCE3; MCE-FAMILY PROTEIN MCE3B; MCE-FAMILY PROTEIN MCE3C; MCE-FAMILY PROTEIN MCE3D; POSSIBLE MCE-FAMILY LIPOPROTEIN LPRM; MCE-FAMILY PROTEIN MCE3F | (23) |
| Rv2358-Rv2359 | 1 | PROBABLE TRANSCRIPTIONAL REGULATORY PROTEIN; PROBABLE FERRIC UPTAKE REGULATION PROTEIN FURB | (24) |
| Rv2431c-Rv2430c | 1 | PE FAMILY PROTEIN; PPE FAMILY PROTEIN | (25) |
| Rv2594c-Rv2592c | 2 | PROBABLE CROSSOVER JUNCTION ENDODEOXYRIBONUCLEASE RUVC; PROBABLE HOLLIDAY JUNCTION DNA HELICASE RUVA; PROBABLE HOLLIDAY JUNCTION DNA HELICASE RUVB | (26) |
| Rv2688c-Rv2686c | 2 | PROBABLE ANTIBIOTIC-TRANSPORT ATP-BINDING PROTEIN ABC TRANSPORTER; PROBABLE ANTIBIOTIC-TRANSPORT INTEGRAL MEMBRANE LEUCINE AND VALINE RICH PROTEIN ABC TRANSPORTER; PROBABLE ANTIBIOTIC-TRANSPORT INTEGRAL MEMBRANE LEUCINE AND ALANINE AND VALINE RICH PROTEIN ABC TRANSPORTER | (27) |
| Rv3083-Rv3089 | 6 | PROBABLE MONOOXYGENASE; PROBABLE ACETYL-HYDROLASE/ESTERASE LIP; PROBABLE SHORT-CHAIN TYPE DEHYDROGENASE/REDUCTASE; PROBABLE ZINC-TYPE ALCOHOL DEHYDROGENASE ADHD (ALDEHYDE REDUCTASE); CONSERVED HYPOTHETICAL PROTEIN; CONSERVED HYPOTHETICAL PROTEIN; PROBABLE CHAIN -FATTY-ACID-CoA LIGASE FADD13 | (28) |
| Rv3134c-Rv3132c | 2 | CONSERVED HYPOTHETICAL PROTEIN; TWO COMPONENT TRANSCRIPTIONAL REGULATORY PROTEIN DEVR; TWO COMPONENT SENSOR HISTIDINE KINASE DEVS | (29) |
| Rv3874-Rv3875 | 1 | KDA CULTURE FILTRATE ANTIGEN ESXB; 6 KDA EARLY SECRETORY ANTIGENIC TARGET ESXA | (30) |
| Rv3793-Rv3795 | 2 | INTEGRAL MEMBRANE INDOLYLACETYLINOSITOL ARABINOSYLTRANSFERASE EMBC, INTEGRAL MEMBRANE INDOLYLACETYLINOSITOL ARABINOSYLTRANSFERASE EMBA, INTEGRAL MEMBRANE INDOLYLACETYLINOSITOL ARABINOSYLTRANSFERASE EMBB | (31) |
| Rv0047c-Rv0046c | 1 | CONSERVED HYPOTHETICAL PROTEIN; MYO-INOSITOL-1-PHOSPHATE SYNTHASE INO1 | This study |
| Rv0287-Rv0288 | 1 | ESAT-6 LIKE PROTEIN ESXG; LOW MOLECULAR WEIGHT PROTEIN ANTIGEN 7 ESXH | This study |
| Rv1304-Rv1305 | 1 | PROBABLE ATP SYNTHASE A CHAIN ATPB; PROBABLE ATP SYNTHASE C CHAIN ATPE | This study |
| Rv1334-Rv1335 | 1 | CONSERVED HYPOTHETICAL PROTEIN; 9.5 KDA CULTURE FILTRATE ANTIGEN CFP10A | This study |
| Rv1465-Rv1466 | 1 | POSSIBLE NITROGEN FIXATION RELATED PROTEIN; CONSERVED HYPOTHETICAL PROTEIN | This study |
| Rv1826-Rv1827 | 1 | PROBABLE GLYCINE CLEAVAGE SYSTEM H PROTEIN GCVH; CONSERVED HYPOTHETICAL PROTEIN CFP17 | This study |
| Rv2745c-Rv2744c | 1 | POSSIBLE TRANSCRIPTIONAL REGULATORY PROTEIN; CONSERVED 35 KDA ALANINE RICH PROTEIN | This study |
| Rv2934-Rv2937 | 3 | PHENOLPTHIOCEROL SYNTHESIS TYPE-I POLYKETIDE SYNTHASE PPSD; PHENOLPTHIOCEROL SYNTHESIS TYPE-I, PROBABLE DAUNORUBICIN-DIM-TRANSPORT ATP-BINDING PROTEIN ABC TRANSPORTER DRRAPOLYKETIDE SYNTHASE PPSE; PROBABLE DAUNORUBICIN-DIM-TRANSPORT ATP-BINDING PROTEIN ABC TRANSPORTER DRRA; PROBABLE DAUNORUBICIN-DIM-TRANSPORT INTEGRAL MEMBRANE PROTEIN ABC TRANSPORTER DRRB | This study |
| Rv3152-Rv3153 | 1 | PROBABLE NADH DEHYDROGENASE I (CHAIN H) NUOH; PROBABLE NADH DEHYDROGENASE I (CHAIN I) NUOI | This study |
| Rv3516-Rv3517 | 1 | POSSIBLE ENOYL-CoA HYDRATASE ECHA19; CONSERVED HYPOTHETICAL PROTEIN | This study |
| Total | 55 |
Continual development of computational methods for operon prediction in bacteria has been underway in recent years, primarily in Escherichia coli. For example, Ermolaeva et al. (8) examined conserved gene groupings and proximity over a large set of complete prokaryotic genomes. Although fruitful, such predictions can only be made on the fraction of gene pairs that are conserved across clusters. Other researchers focused on knowledge of within-species gene organizations and characteristics. One widely used approach relies on the well-established notion that the likelihood that adjacent genes are transcribed in the same operon increases as the number of base pairs separating the two genes decreases. For example, Salgado et al. (9) used log-likelihoods based on distance to compare adjacent genes in an operon to those not in an operon, later enhancing their predictions with information about functional classes. Romero and Karp (10) used the methods of Salgado et al. as a starting point, improving their predictions by using information contained in pathway-genome databases at BioCyc. These authors attempt to enhance distance-based methods with information about metabolic pathways, protein complexes and transporters, an approach grounded in the observation that genes in the same operon often work together in pathways, processes or multimeric protein(s).
Sabatti et al. (11) added information from potentially large sets of microarray experiments to inter-gene spacing and directionality. The incorporation of microarray expression data in operon prediction, when available, is natural, since we would expect genes in an operon to be similarly expressed across a variety of conditions. In the absence of measurement error, internal secondary promoters, differential RNA stability or variation in RNA polymerase processivity (that is to say, in an imaginary, idealized biology), genes in an operon would always be perfectly coexpressed. A second group, Bockhorst et al. (12), also successfully used intergenic distance and expression data to predict operons in E. coli; they followed a Bayesian network approach. The synergistic power of intergenic distance and microarray coexpression to predict operons was further confirmed when De Hoon et al. (13) used these predictors to accurately build an operon map for Bacillus subtilis.
Two of the methods described above, after being developed and evaluated in E. coli, have been used to predict operons in MTB. Using cross-species conservation of gene proximity, Ermolaeva et al. (8) offer predicted operon pairs for MTB at The Institute for Genome Research (TIGR) (http://www.tigr.org/tigr-scripts/operons/pairs.cgi?taxon_id=89). As of this writing, this site explicitly reports data for only a third of the available genome (1389 of 3999 potential operon pairs). When we use the 55 known, laboratory-verified operon pairs that we have identified (see Table 1), we find that the TIGR cross-species comparative method correctly predicts that 26 of the 55 pairs would be cotranscribed. Of these 26, 16 are explicitly listed as being cotranscribed, the remaining can be found to be associated as subsets of larger predicted operons. No information regarding cotranscription is reported at TIGR for the remaining 29 of the 55 known operon pairs in MTB.
Romero and Karp (10) use data in their BioCyc database related to each gene's pathway, complexes and functional class (along with intergenic distance) to predict 2509 transcriptional units in MTB (http://biocyc.org/MTBRV/organism-summary?object=MTBRV). The accuracy of Romero and Karp's predictions in MTB itself was not verified. As of this writing, we found that, among the 55 operon pairs known to us, BioCyc correctly predicts 84% (36 of 43) of published operon pairs, but only 33% (4 of 12) of those not yet published (but which were confirmed in our laboratory; Table 1). No assessment of the false positive rate in the BioCyc MTB data set is available. Reduced performance outside of well-annotated areas of the genome was predicted by Romero and Karp (10), and likely results from the reduced pathway, complex and functional class data in these regions. Overall, the method's diminished performance outside E. coli encouraged Romero and Karp to advocate for building each model with species-specific known transcriptional data. They also point out that supplementing their model with expression data (like Sabatti et al.) might further enhance operon prediction (10).
The predicted MTB operon maps on TIGR and BioCyc each offer valuable predictions, yet both have limitations in scope, power and performance. In this article, we show that methods which use gene expression data from microarray experiments substantially improve operon predictions in MTB, just as they did in E. coli (11,12), and B. subtilis (13). Unlike the BioCyc and TIGR operon maps, our method uses data available for all areas of the genome (distance and coexpression) and works equally well in uncharacterized operons, where prediction is most important. We describe our work to organize substantial expression data (474 microarray experiments), confirm new operon pairs in the laboratory, build a predictive model for operon pairs based on intergenic distance and coexpression data, and evaluate model performance. Our best model achieves a true positive rate of over 90% at a false positive rate of 9.1%.
MATERIALS AND METHODS
Microarray expression data sets
All microarray experiments were performed using standard protocols as previously described (34). Previously published details of sample preparation for those microarray experiments can be found in referenced studies listed in Table 2. The expression values were downloaded from a local version of Michael Eisen's AMAD database (http://www.microarrays.org/) (37). These experiments came in nine general experimental categories (see Table 2), and were performed using either amplicon or oligonucleotide technology.
Table 2.
DNA microarray data sets used in this work
| Experimental treatment | Number of microarrays | Microarray technology | Methods reference |
|---|---|---|---|
| Ethambutol | 62 | Amplicon | (32) |
| Hydrogen peroxide | 28 | Amplicon | (32) |
| 55 | Oligo | (32) | |
| Hypoxia | 37 | Amplicon | (33) |
| 32 | Oligo | (34) | |
| Iron | 19 | Amplicon | (35) |
| Potassium cyanide | 15 | Amplicon | (32) |
| Nitric oxide | 135 | Amplicon | (32) |
| 9 | Oligo | (34) | |
| Protonophores | 18 | Amplicon | Unpublished |
| Sigma B deletion | 48 | Oligo | Unpublished |
| Sigma E | 14 | Amplicon | (36) |
Organization and cleaning of expression data
In order to calculate the desired gene expression correlations from our data set, we employed several data cleaning techniques. After extracting the background-adjusted intensities for each channel from the AMAD database for the 474 currently held microarray experiments, we used the R (http://www.R-project.org) package impute (version 1.0-5) to fill in values for missing data (38). For any missing values for a gene, the function impute.knn finds the k-nearest neighbor genes, referencing only experiments for which the original gene has data. Once these k-nearest neighbors are found, the average expression of these neighbors for the experiment which the original gene has a missing value is used to fill in a reasonable approximation for that value. We settled on a k-value of 30 (higher than the default k-value of 10), since k-values below 30 produced too many missing values and forced the imputed value to be based on the experiment average (rather than the more desirable average from the k-nearest neighbors).
Once all missing values were imputed, we recoded negative intensities as zeros, since a negative intensity essentially means that the gene is not being expressed. We then normalized the expression data to account for variation between microarrays. Since extreme values in only one channel (Cy3/Cy5) can skew normalization, we normalized by the sum of the middle 90% of the data instead of the sum of all the data.
After normalization, the log ratio of two channels was taken. Since some intensities were zero, some log ratios were zero or infinity, which we considered to be uninformative values. We removed experiments in which 10% or more of the channel ratios were uninformative, and this left 463 microarray experiments from which to calculate gene expression correlations.
The expression correlation between gene pairs was based on the natural logarithm of the ratio of the normalized two-channel intensities across a set of experiments. Unique correlations for each gene pair were calculated across all experiments and across each of twelve subsets of experiments determined by experimental condition and microarray technology (amplicon or oligonucleotide; see Table 2).
Laboratory methods
RT-PCR was used to test whether adjacent genes that represent potential operon pairs (POPs) in fact co-occur on a single cellular RNA molecule. MTB RNA samples were extracted, from logarithmic stage grown cells, and purified by Trizol (Invitrogen) extraction, DNAase treatment and further purified by using an RNA-Easy kit (Qiagen) as described (34). To further purify the RNA and reduce the risk of contaminating genomic DNA, RNA samples were then purified with a second round of DNAase (Qiagen #79254) treatment followed by two consecutive RNA cleanup treatments using ‘RNeasy MinElute’ silica-membrane columns (Qiagen #74204). This RNA was then incubated with random primers (Promega #C1181) and reverse transcriptase (Promega #M5101) to create a cDNA pool. To control for the possibility of accidental PCR amplification from genomic DNA not eliminated by the multiple rounds of purification, an RT-control was prepared in parallel, which differed only by the absence of reverse transcriptase. To maintain buffer continuity between RT-PCR reactions, reverse-transcription 10× buffer (Promega #A3561) was used in both reverse transcription and PCR reactions. For each POP to be tested, MIT's Primer3 software was used to design primers anchored in the open reading frames of adjacent genes. Typically such primers were separated by 200–400 bp, and had annealing temperatures of 55–58°C. (See Supplementary Data for primer details). For each primer pair, the RT+ and RT− samples described above were used as templates in PCR reactions via standard methods. Primer pairs which produced a correctly sized product from the RT + PCR reactions but not the RT− control PCR reactions were interpreted as evidence that an RNA bridging the gene pair was present in the MTB mRNA pool. Such results were then confirmed from an independently prepared sample of MTB RNA.
Operon training set
The development of a predictive model for operon pairs in MTB requires the definition of a training set of known operon (OP) and non-operon (NOP) gene pairs. Evidence of 43 operon pairs has been confirmed in laboratories and subsequently published (Table 1). To build this set further, we have confirmed 12 new operon pairs (Table 1) using RT-PCR.
The piloting work using microarrays for operon prediction in E. coli (11) and B. subtilis (13) used thousands of well-characterized, same-strand non-operon pairs to build predictive models. Unfortunately, most or all other organisms that could currently benefit from operon prediction (including MTB) have much more limited experimental verification; this is especially true for non-operon pairs. To overcome this potential roadblock to prediction, we use the 1340 pairs of consecutive genes on opposite strands of DNA as our NOP set. This substitution is supported by recent work (39,40), which finds comparable microarray expression between two types (same-strand versus opposite-strand) of non-operon gene pairs. However, as described in Price et al. (40), the distribution of intergenic distance in same-strand and opposite-strand NOPs should differ; distances for same-strand NOPs should be greater in general. One consequence is that our predictive model using expression and distance will be somewhat conservative and underpowered—it is more difficult to distinguish OPs from NOPs using opposite-strand NOPs since their distance distribution is less distinguishable from the distance distribution of OPs. Thus, if our predictive model performs well using our definition of NOP to create a training set, we have reason to believe the model will perform even better when predicting operon status of same-strand gene pairs. Any loss of power from using opposite-strand gene pairs as NOPs in our training set will be more than offset by the additional power from the large number of available NOPs under this definition, especially when compared to the small number of laboratory-validated same-strand NOPs in MTB. In addition, investigations of conserved ‘known’ NOPs in E. coli (8) and B. subtilis (40) found evidence that many of them are indeed cotranscribed.
Sequence information
All sequence information on the MTB genome was obtained from the online database TubercuList, (http://genolist.pasteur.fr/TubercuList/), based on the H37Rv strain. Intergenic distance between two genes was found from the database by subtracting the ending location on the genome of the first gene from the initial location on the genome of the second gene.
Statistical methods
We constructed a statistical model for predicting operon status of each potential operon pair (POP) based on intergenic distance and expression correlation. We based our predictive models on logistic regression with the logit link function. If we designate pi as the probability that gene pair i is an operon, then the logit is given by
and the model equation is
where dist is intergenic distance and corrl is the correlation of expression among experiments in subset l (l = 1,2,…, p), where subsets of experiments are determined by treatment (e.g. cyanide, hypoxia and nitric oxide) and microarray technology (oligo or amplicon). Using the known OPs and the NOPs as our training set, estimates of the coefficients of the model are found through the iteratively reweighted least squares technique. Using the estimates of the coefficients, we calculated the estimated mean probability for gene pair i being an operon pair to be
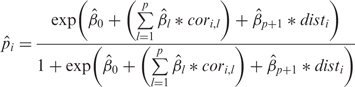 |
where  are the estimates of the model coefficients.
To place these predictive probabilities on a more intuitive scale, we use the  values to assign a ‘cotranscription rank percentile (CRP)’ for each gene pair by simply sorting all operon pairs from highest predicted probability of being an operon pair (CRP = 100) to lowest (CRP = 0) based on the model. Then, we select an appropriate CRP threshold to achieve a specified modeling goal (e.g. achieving a certain sensitivity, achieving a certain specificity, classifying a certain percentage of gene pairs as operon pairs). Based on the chosen CRP threshold, each POP in the entire genome can be classified as being either an operon pair or a non-operon pair.
Model performance is assessed and compared using several metrics. The Akaike Information Criterion (AIC) and Bayesian Information Criterion (BIC) both balance goodness-of-fit of a model with model complexity, where the BIC imposes a more severe penalty on extra parameters than the AIC (41). Kendall's tau-a assesses the difference between concordant and discordant sets out of all possible sets of gene pairs, where a concordant set of gene pairs is one in which the pair that is an operon has a higher fitted probability of being an operon pair than the pair that is not an operon (42). The c index provides the area under the receiver operating characteristic (ROC) curve, where the ROC curve provides a graphical representation of the trade off between the false negative and false positive rates for every possible cutoff in predictive probabilities (43). In particular, the c index is then the percentage of all possible pairs of cases in which the model assigns a higher predictive probability to a correct case than an incorrect case (43).
Finally, we compared models using cross-validated measures of overall model accuracy—the proportion of all gene pairs of known operon status which were correctly classified. We chose our classification threshold to provide a true positive rate in our final model of at least 90% while minimizing the false positive rate. Estimates of overall model accuracy were determined with 10-fold cross-validation using the cv.glm function in R. This function was also used to obtain cross-validated estimates of specificity and sensitivity for our final model.
RESULTS AND DISCUSSION
Known operon pairs exhibit shorter intergenic distances and higher expression correlations
Preliminary data exploration verified a pattern of small intergenic distance and high expression correlation being associated with operon pairs in our data. Figure 1A shows that the distribution of intergenic distances for operon pairs (OPs) is centered tightly near zero, whereas the distribution of intergenic distances for non-operon pairs (NOPs) is spread out with a median at 83 bp. This supports the hypothesis that intergenic distance can be used to separate OPs from NOPs in MTB as it has been used in other organisms.
Figure 1.

Density estimates of (A) intergenic distance and (B) gene expression correlation for known operon pairs (solid) and non-operon pairs (dashed) using nonparametric kernel density estimates with Gaussian kernels. (C) A scatterplot showing the relationship of coexpression (vertical axis) and intergenic distance (horizontal axis) for all known operons pairs (red dots) and potential operon pairs (blue dots).
Evidence that expression correlation distinguishes OPs from NOPs was also found. Figure 1B presents densities of gene expression correlations across all experiments. The mean and median expression correlations for OPs are 0.60 and 0.66, respectively, and 0.16 and 0.14 for NOPs.
To examine the relationship between expression correlation and intergenic distance, we generated a scatterplot (Figure 1C) with different colors distinguishing known operon pairs from potential operon pairs. We see that operon pairs are generally characterized by short intergenic distance and high correlation of expression. In fact, among POPs, most examples of strong coexpression have relatively short intergenic distance.
Thus, our preliminary graphical analysis shows that our data are generally consistent with the accepted wisdom: known operon pairs have shorter intergenic distance and are more coexpressed than non-operonic pairs, and that using both coexpression and distance concurrently has potential to produce even stronger predictions of OPs.
Building and assessing performance of a logistic regression predictive model
The logistic regression predictive model for a particular potential operon pair (POP) is based on available data for that POP. For this work, we have chosen to use the most recent annotation of MTB (44), but some microarray experiments predate this reannotation. Because of this, amplicon microarray experiment data is unavailable for 76 genes, and data from more recent oligo experiments was missing for 37 of those 76 genes. This missing data translated into a slightly larger number of missing gene expression correlations since each individual gene is part of two gene pairs. To use as much information as possible for each gene pair, we constructed three different predictive models based on available data—predictions for 2572 POPs use intergenic distance and expression correlations from both oligo and amplicon experiments, 42 use intergenic distance and expression correlations from oligo experiments and the remaining 45 POPs use intergenic distance only.
Since we had expression data from a variety of experiments, both in terms of treatments (cyanide, hypoxia, nitric oxide, etc.) and microarray technology (oligo or amplicon), we explored the possibility that separating the expression data by experiment type would provide more predictive power of the true operons. In addition to the varying experimental conditions, not all the experiments were done at the same time or with the same microarray platform and thus might vary in quality. Instead of a single correlation of coexpression across all experiments, we calculated separate coexpression correlations within each of the 12 experimental types (Table 2) and looked for evidence that model performance was improved.
Thus, for the 2572 gene pairs for which distance, oligo and amplicon data were available, final predictors in our logistic regression model were chosen from among intergenic distance and correlations of coexpression within each of the twelve experimental types. Insignificant predictors were removed through backward elimination methods. Table 3 (Model A) shows the estimated coefficients, SEs and significance tests for our final logistic regression model for the POPs with complete data. Five of the twelve experimental types proved significantly helpful in distinguishing OPs from NOPs.
Table 3.
Logistic regression coefficients and associated Wald tests of significance for three models
| Predictor | Type | Model A | Model B | Model C | |||||||||
|---|---|---|---|---|---|---|---|---|---|---|---|---|---|
| Est. | SE | Z | P-value | Est. | SE | Z | P-value | Est. | SE | Z | P-value | ||
| intercept | −5.88 | 0.487 | −12.1 | <0.001 | −5.60 | 0.477 | −11.7 | <0.001 | −2.54 | 0.149 | −17.0 | <0.001 | |
| Distance | −0.012 | 0.003 | −4.29 | <0.001 | −0.012 | 0.002 | −5.01 | <0.001 | −0.010 | 0.002 | −5.25 | <0.001 | |
| Ethambutol | Amplicon | 2.491 | 0.772 | 3.23 | 0.001 | ||||||||
| H2O2 | Oligo | 1.371 | 0.592 | 2.32 | 0.021 | 1.934 | 0.551 | 3.51 | <0.001 | ||||
| Hypoxia | Oligo | 2.217 | 0.588 | 3.77 | <0.001 | 2.729 | 0.589 | 4.63 | <0.001 | ||||
| Potassium cyanide | Amplicon | 1.507 | 0.520 | 2.90 | 0.004 | ||||||||
| Sigma B | Oligo | 2.284 | 0.623 | 3.67 | <0.001 | 3.027 | 0.600 | 5.04 | <0.001 | ||||
Model A: To be used for gene pairs with distance, oligo and amplicon data.
Model B: To be used for gene pairs lacking amplicon data.
Model C: To be used for gene pairs with no expression data.
In Table 4, we compare the model in Table 3A (Model A) with several other models, including a model with gene expression correlation for all experiments as the only correlation predictor (Model G); a model with two correlation predictors, one for oligo microarrays and the other for amplicon microarrays (Model F); and the full model with gene expression correlations for all 12 experiment types (Model H). Several statistics summarizing model performance are presented, including c index (the area under the ROC curve), Kendall's tau-a, AIC and BIC. Note that lower values of the AIC and BIC indicate superior model performance. For each measure except BIC, Model A from Table 3 was preferable to every other model except the full model. With BIC, Model A was the best performing model of all, which reflects our model building efforts to optimize model fit while minimizing unnecessary complexity. A few results in Table 4 are especially pertinent. For instance, we have quantitative evidence that (i) adding coexpression data to intergenic distance clearly improves model performance (Model C versus all other models); (ii) adding data from amplicon microarray experiments improves upon models with intergenic distance and data from oligo experiments (Model A versus Model B; Model D versus Model F; Model E versus Model H) and (iii) using separate coexpression correlations from each experiment type leads to improved predictive performance when compared with models using a single term for coexpression across all experiments (Model A versus Model F and Model G).
Table 4.
Measures of performance for operon prediction from logistic regression models with different sets of explanatory variables
| Model label and description | c Index | Kendall's tau-a | BIC | AIC | Overall accuracy |
|---|---|---|---|---|---|
| (A) Dist + Oligo(3) + Amplicon(2) | 0.954 | 0.072 | 284.9 | 248.5 | 0.908 |
| (B) Dist + Oligo(3) | 0.946 | 0.071 | 300.1 | 274.1 | 0.884 |
| (C) Distance | 0.777 | 0.044 | 432.5 | 422.1 | 0.716 |
| (D) Dist + Oligo(1) | 0.929 | 0.068 | 293.4 | 277.8 | 0.876 |
| (E) Dist + Oligo(4) | 0.947 | 0.071 | 304.3 | 273.2 | 0.889 |
| (F) Dist + Oligo(1) + Amplicon(1) | 0.935 | 0.069 | 292.1 | 271.3 | 0.887 |
| (G) Dist + Coexpression(1) | 0.921 | 0.067 | 303.4 | 287.8 | 0.876 |
| (H) Dist + Oligo(4) + Amplicon(8) | 0.960 | 0.073 | 316.1 | 243.3 | 0.905 |
In the model descriptions, Oligo(1) means that a single correlation of expression is used for all oligo experiments, Oligo(4) means that separate gene expression correlations are used for each experiment type involving oligo technology, and Oligo(3) means the correlation from one experiment type involving oligo technology was removed via backward elimination. Similarly, Amplicon(1) means that a single correlation of expression is used for all amplicon experiments, Amplicon(8) means that separate gene expression correlations are used for each experiment type involving amplicon technology and Amplicon(2) means the correlations from six experiment types involving amplicon technology were removed via backward elimination. Finally, Coexpression(1) means that a single correlation of expression was used for all experiment types.
In order to accurately predict operons in gene pairs for which amplicon data was not available (42 POPs with distance and oligo data), a new logistic regression model was developed (Model B). As in Model A, backward elimination methods were used to choose a final set of predictors from among intergenic distance and correlations of coexpression within the four experimental subgroups using oligo microarrays. The same training set of operons used in Model A was used to build Model B. Table 3B shows the estimated coefficients, SEs and significance tests for our final logistic regression model which should be used for prediction for the POPs with distance and oligo data only. It is not surprising that those oligo experiments which were found significant in the primary model (Table 3A) were also found significant in this model.
For the 45 POPs with no expression data at all, we developed a logistic regression model on the same training set of operons using only intergenic distance as a predictor. This model (Model C) appears in Table 3C. As expected, intergenic distance remains a significant predictor of operon status.
To illustrate these model comparisons, we created ROC curves, plotting false positive rates versus true positive rates. The strongest predictive models maximize the true positive rate while minimizing the false positive rate; in other words, they have maximum proximity to the upper left-hand corner of the graph. For instance, the ROC curves in Figure 2 show that the distance only model (Model C; dotted line) is inferior to the models with distance and expression data (solid and dashed). In addition, the model with expression data from both amplicon and oligo experiments (Model A; solid line) performed significantly better than the model with expression data from only oligo experiments (Model B; dashed line).
Figure 2.

ROC curves comparing three predictive models. The best model shown (Model A; solid line) uses intergenic distance and coexpression data from oligo and amplicon microarrays, while the next best model (Model B; dashed line) uses intergenic distance and coexpression data from only oligo microarrays and the poorest performing model (Model C; dotted line) uses only intergenic distance.
Using logistic regression modeling to predict an operon map for MTB
Figure 2 demonstrates that expression data can be used as a powerful tool for operon prediction in MTB; our current model (Table 3, Models A–C) classifies 39.3% of POPs as operon pairs, and achieves a true positive rate of 90.8% at a false positive rate of 9.1%. These rates are comparable with some of the best published to date, even in E. coli. For example, Sabatti et al., who piloted the use of expression data and distance to predict operons in E. coli, report a true positive rate of 88% at a false positive rate of 12% (43). Romero and Karp, whose method does not use expression data for E. coli but leverages the exhaustive knowledge of pathways and complexes in this best characterized of prokaryotes, report a true positive rate of 91% with a false positive rate of 13% (45). De Hoon and colleagues, who (like us) extend Sabatti's methods to another genome, achieve a true positive rate of 88.8% with a false positive rate of 12.1% in B. subtilis (13). Our model's performance compares even more favorably with the first generation of MTB operon predictions available at TIGR (which finds 47% of known operon gene pairs) and BioCyc (which finds 84% of published pairs but only 33% of unpublished ones). Unlike the BioCyc and TIGR operon maps, our method uses data available for all areas of the genome (distance and coexpression) and should work equally well in uncharacterized operons, where prediction is most important. In addition, since we used opposite-strand non-operon pairs in our training data set, the model performance we observed should improve as laboratory validated, same-strand non-operon pairs (whose intergenic distance distributions are more distinguishable from that of operon pairs) are used for training.
Finally, our ongoing work to validate model predictions and expand our training data with additional laboratory-identified pairs, though preliminary, also supports the value of our model (Figure 3).
Figure 3.

To further test the predictions of the model described in this work, two operons were subjected to additional laboratory testing. Starting from a foundation of gene pairs we have successfully amplified in the past in our laboratory (shown with asterisk) we selected adjacent newly predicted operon pairs and tested them by RT-PCR. In the summary table of results (A), gene pairs without an asterisk are therefore new results. For each gene pair, the intergenic distance, coexpression rank percentile and model prediction are shown. The final column indicates whether we have successfully verified that the gene pair coexists on a single RNA molecule by RT-PCR as described in the Materials and Methods section. Panel B shows some of the associated gel image data. Specifically, of the six newly predicted operon pairs tested, we were able to confirm all but one by generating a PCR fragment. The lone exception (Rv1462-Rv1463) may indicate (i) they are not cotranscribed as predicted, (ii) we have not currently (but may eventually) amplify a fragment which bridges this pair by RT-PCR or (iii) other factors are at work which could confound RT-PCR. As a result, we have labeled Rv1462-Rv1463 ‘unconfirmed’ in the table.
CONCLUSION
We have predicted the operon structure of MTB using intergenic distance, microarray expression data and information about the conditions of the microarray experiments. A predictive logistic regression model based on these inputs outperformed alternative models without expression data or even with all expression data condensed into a single correlation term.
Our predictive model produced a predictive probability that each potential operon pair in the MTB genome is truly an operon pair, and we transformed those predictive probabilities into cotranscription rank percentiles (CRPs). In order to simplify presentation and interpretation, we converted these continuous outputs into a discrete set of classifications by selecting a threshold for determining whether or not a potential operon pair should be classified as an operon. Although this binary classification knowingly oversimplifies the underlying biology (e.g. ignoring growing evidence of internal promoters, alternative transcriptional start sites and internal readthrough terminators), it is useful because it makes assembly of a genome-wide map of operon structure straightforward. In our case, we defined a CRP threshold to produce a true positive rate of at least 90% while minimizing the false positive rate. Our model performance—cross-validated sensitivity of 90.8% with specificity of 90.9%—compares favorably with models developed in the much better characterized ‘model organisms’ in E. coli (45) and B. subtilis (13). By applying this 90% true positive threshold to the data, it is straightforward to generate a complete list of predicted operons (see Supplementary Data).
We have also made our full data set available to researchers who may want to further explore model building and performance (see Supplementary Data). The data contains all model inputs and outputs which we considered—intergenic distance, coexpression correlations by experiment type, predictive probabilities and cotranscription rank percentiles—for all 3999 gene pairs in MTB. While we believe the models and predicted cotranscription map for the entire MTB genome presented in this article represent a rich and complete view of the currently existing data, we also believe that understanding of MTB can be further enhanced using this data as a base. For example, researchers might wish to examine the impact of different thresholds for classification as an operon pair. In addition, researchers can update this data as new operons or non-operons are confirmed, or they can add additional potential predictors as more is learned about the biology of MTB. The accelerating pace of molecular research in this important pathogen is certain to provide additional data with which to refine the predictions described in this work, forming a solid empirical foundation for our future understanding of MTB transcription.
SUPPLEMENTARY DATA
Supplementary Data are available at NAR Online.
ACKNOWLEDGEMENTS
We thank C. Sabatti and M.J.L. De Hoon for helpful suggestions regarding methodology. This work was made possible by funds from the Howard Hughes Medical Institute (J.B.), the Bannan Scholars (C.R.), the National Science Foundation (P.R., J.B., D.B., K.H., S.K. and H.W. via NSF, EMSW21 DMS-0354308) and a Seattle University Faculty Development Fellowship (RR). Funding to pay the Open Access publication charges for this article was provided by NIH 5R01AI061505-02.
Conflict of interest statement. None declared.
REFERENCES
- 1.Manganelli R, Proveddi R, Rodrigue S, Beaucher J, Gaudreau L, Smith I. Sigma factors and global gene regulation in Mycobacterium tuberculosis. J. Bacteriol. 2004;186:895–902. doi: 10.1128/JB.186.4.895-902.2004. [DOI] [PMC free article] [PubMed] [Google Scholar]
- 2.Gomez JE, Chen JM, Bishai WR. Sigma factors of Mycobacterium tuberculosis. Tuber. Lung Dis. 1997;78:175–183. doi: 10.1016/s0962-8479(97)90024-1. [DOI] [PubMed] [Google Scholar]
- 3.Cole ST, Brosch R, Parkhill J, Garnier T, Churcher C, Harris D, Gordon SV, Eiglmeier K, Gas S, et al. Deciphering the biology of Mycobacterium tuberculosis from the complete genome sequence. Nature. 1998;393:537–544. doi: 10.1038/31159. [DOI] [PubMed] [Google Scholar]
- 4.Unniraman S, Chatterji M, Nagaraja V. DNA gyrase genes in Mycobacterium tuberculosis: a single operon driven by multiple promoters. J. Bacteriol. 2002;184:5449–5456. doi: 10.1128/JB.184.19.5449-5456.2002. [DOI] [PMC free article] [PubMed] [Google Scholar]
- 5.Gopaul KK, Brooks PC, Prost JF, Davis EO. Characterization of the two Mycobacterium tuberculosis recA promoters. J. Bacteriol. 2003;185:6005–6015. doi: 10.1128/JB.185.20.6005-6015.2003. [DOI] [PMC free article] [PubMed] [Google Scholar]
- 6.Davis EO, Springer B, Gopaul KK, Papavinasasundaram KG, Sander P, Bottger EC. DNA damage induction of recA in Mycobacterium tuberculosis independently of RecA and LexA. Mol. Microbiol. 2002;46:791–800. doi: 10.1046/j.1365-2958.2002.03199.x. [DOI] [PubMed] [Google Scholar]
- 7.DeHoon M, Makita Y, Nakai K, Miyano S. Prediction of transcriptional terminators in Bacillus subtilis and related species. PLoS Comput. Biol. 2005;1:e25. doi: 10.1371/journal.pcbi.0010025. [DOI] [PMC free article] [PubMed] [Google Scholar]
- 8.Ermolaeva MD, White O, Salzberg SL. Prediction of operons in microbial genomes. Nucleic Acids Res. 2001;29:1216–1221. doi: 10.1093/nar/29.5.1216. [DOI] [PMC free article] [PubMed] [Google Scholar]
- 9.Salgado H, Moreno-Hagelsieb G, Smith TF, Collado-Vides J. Operons in Escherichia coli: genomic analyses and predictions. Proc. Natl Acad. Sci. USA. 2000;97:6652–6657. doi: 10.1073/pnas.110147297. [DOI] [PMC free article] [PubMed] [Google Scholar]
- 10.Romero P, Karp P. Using functional and organizational information to improve genome-wide computational prediction of transcription units on pathway-genome databases. Bioinformatics. 2004;20:709–717. doi: 10.1093/bioinformatics/btg471. [DOI] [PubMed] [Google Scholar]
- 11.Sabatti C, Rohlin L, Oh MK, Liao JC. Co-expression pattern from DNA microarray experiments as a tool for operon prediction. Nucleic Acids Res. 2002;30:2886–2893. doi: 10.1093/nar/gkf388. [DOI] [PMC free article] [PubMed] [Google Scholar]
- 12.Bockhorst J, Craven M, Page D, Shavlik J, Glasner J. A Bayesian network approach to operon prediction. Bioinformatics. 2003;19:1227–1235. doi: 10.1093/bioinformatics/btg147. [DOI] [PubMed] [Google Scholar]
- 13.De Hoon MJ, Imoto S, Kobayashi K, Ogasawara N, Miyano S. Predicting the operon structure of Bacillus subtilis using operon length, intergene distance, and gene expression information. Pac. Symp. Biocomput. 2004:276–287. doi: 10.1142/9789812704856_0027. [DOI] [PubMed] [Google Scholar]
- 14.Casali N, White AM, Riley LW. Regulation of the Mycobacterium tuberculosis mce1 operon. J. Bacteriol. 2006;188:441–449. doi: 10.1128/JB.188.2.441-449.2006. [DOI] [PMC free article] [PubMed] [Google Scholar]
- 15.Parish T, Smith D, Roberts G, Betts J, Stocker N. The senX3-regX3 two-component regulatory system of Mycobacterium tuberculosis is required for virulence. Microbiology. 2003;149:1423–1235. doi: 10.1099/mic.0.26245-0. [DOI] [PubMed] [Google Scholar]
- 16.Torres A, Juarez MD, Cervantes R, Espita C. Molecular analysis of Mycobacterium tuberculosis phosphate specific transport system in Mycobacterium smegmatis. Characterization of recombinant 38 kDa (PstS-1) Micro. Pathog. 2001;30:289–297. doi: 10.1006/mpat.2001.0434. [DOI] [PubMed] [Google Scholar]
- 17.Rosas-Magallanes V, Deschavanne P, Quintana-Murci L, Brosch R, Gicquel B, Neyrolles O. Horizontal Transfer of a Virulence Operon to the Ancestor of Mycobacterium tuberculosis. Mol. Biol. Evol. 2006;23:1129–1135. doi: 10.1093/molbev/msj120. [DOI] [PubMed] [Google Scholar]
- 18.Goh KS, Rastogi N, Berchel M, Huard RC, Sola C. Molecular evolutionary history of tubercle bacilli assessed by study of the polymorphic nucleotide within the nitrate reductase (narGHJI) operon promoter. J. Clin. Microbiol. 2005;43:4010–4014. doi: 10.1128/JCM.43.8.4010-4014.2005. [DOI] [PMC free article] [PubMed] [Google Scholar]
- 19.Bigi F, Alito A, Romano MI, Zumarraga M, Caimi K, Cataldi A. The gene encoding P27 lipoprotein and a putative antibiotic-resistance gene form an operon in Mycobacterium tuberculosis and Mycobacterium bovis. Microbiology-Uk. 2000;146:1011–1018. doi: 10.1099/00221287-146-4-1011. [DOI] [PubMed] [Google Scholar]
- 20.Gao LY, Pak M, Kish R, Kajihara K, Brown EJ. A mycobacterial operon essential for virulence in vivo and invasion and intracellular persistence in macrophages. Infect. Immun. 2006;74:1757–1767. doi: 10.1128/IAI.74.3.1757-1767.2006. [DOI] [PMC free article] [PubMed] [Google Scholar]
- 21.Banerjee A, Sugantino M, Sacchettini JC, Jacobs WR. The mabA gene from the inhA operon of Mycobacterium tuberculosis encodes a 3-ketoacyl reductase that fails to confer isoniazid resistance. Microbiology-Sgm. 1998;144:2697–2704. doi: 10.1099/00221287-144-10-2697. [DOI] [PubMed] [Google Scholar]
- 22.Santangelo MP, Goldstein J, Alito A, Gioffre A, Caimi K, Zabal O, Zumarraga M, Romano MI, Cataldi AA, Bigi F. Negative transcriptional regulation of the mce3 operon in Mycobacterium tuberculosis. Microbiology-Sgm. 2002;148:2997–3006. doi: 10.1099/00221287-148-10-2997. [DOI] [PubMed] [Google Scholar]
- 23.Ahmad S, El-Shazly S, Mustafa AS, Al-Attiyah R. The six mammalian cell entry proteins (Mce3A-F) encoded by the mce3 operon are expressed during in vitro growth of Mycobacterium tuberculosis. Scand. J. Immunol. 2005;62:16–24. doi: 10.1111/j.1365-3083.2005.01639.x. [DOI] [PubMed] [Google Scholar]
- 24.Milano A, Branzoni M, Canneva F, Profumo A, Riccardi G. The Mycobacterium tuberculosis Rv2358-furB operon is induced by zinc. Res. Microbiol. 2004;155:192–200. doi: 10.1016/j.resmic.2003.11.009. [DOI] [PubMed] [Google Scholar]
- 25.Tundup S, Akhter Y, Thiagarajan D, Hasnain SE. Clusters of PE and PPE genes of Mycobacterium tuberculosis are organized in operons: evidence that PE Rv2431c is co-transcribed with PPE Rv2430c and their gene products interact with each other. FEBS Lett. 2006;580:1285–1293. doi: 10.1016/j.febslet.2006.01.042. [DOI] [PubMed] [Google Scholar]
- 26.Brooks PC, Movahedzadeh F, Davis EO. Identification of some DNA damage-inducible genes of Mycobacterium tuberculosis: apparent lack of correlation with LexA binding. J. Bacteriol. 2001;183:4459–4467. doi: 10.1128/JB.183.15.4459-4467.2001. [DOI] [PMC free article] [PubMed] [Google Scholar]
- 27.Pasca MR, Guglierame P, Arcesi F, Bellinzoni M, De Rossi E, Riccardi G. Rv2686c-Rv2687c-Rv2688c, an ABC fluoroquinolone efflux pump in Mycobacterium tuberculosis. Antimicrob. Agents Chemother. 2004;48:3175–3178. doi: 10.1128/AAC.48.8.3175-3178.2004. [DOI] [PMC free article] [PubMed] [Google Scholar]
- 28.Singh A, Jain S, Gupta S, Das T, Tyagi AK. mymA operon of Mycobacterium tuberculosis: its regulation and importance in the cell envelope. FEMS Microbiol. Lett. 2003;27:53–63. doi: 10.1016/S0378-1097(03)00648-7. [DOI] [PubMed] [Google Scholar]
- 29.Bagchi G, Chauhan S, Sharma D, Tyagi JS. Transcription and autoregulation of the Rv3134c-devR-devS operon of Mycobacterium tuberculosis. Microbiology. 2005;151:4045–4053. doi: 10.1099/mic.0.28333-0. [DOI] [PubMed] [Google Scholar]
- 30.Berthet FX, Rasmussen PB, Rosenkrands I, Andersen P, Gicquel B. A Mycobacterium tuberculosis operon encoding ESAT-6 and a novel low-molecular-mass culture filtrate protein (CFP-10) Microbiology-Uk. 1998;144:3195–3203. doi: 10.1099/00221287-144-11-3195. [DOI] [PubMed] [Google Scholar]
- 31.Sharma K, Gupta M, Pathak M, Gupta N, Koul A, Sarangi S, Baweja R, Singh Y. Transcriptional control of the mycobacterial embCAB operon by PknH through a regulatory protein, EmbR, in vivo. J. Bacteriol. 2006;188:2936–2944. doi: 10.1128/JB.188.8.2936-2944.2006. [DOI] [PMC free article] [PubMed] [Google Scholar]
- 32.Voskuil MI, Schnappinger D, Rutherford R, Liu Y, Schoolnik GK. Regulation of the Mycobacterium tuberculosis PE/PPE genes. Tuberculosis. 2004;84:256–262. doi: 10.1016/j.tube.2003.12.014. [DOI] [PubMed] [Google Scholar]
- 33.Sherman DR, Voskuil M, Schnappinger D, Liao R, Harrell MI, Schoolnik GK. Regulation of the Mycobacterium tuberculosis hypoxic response gene encoding alpha -crystallin. Proc. Natl Acad. Sci. USA. 2001;98:7534–7539. doi: 10.1073/pnas.121172498. [DOI] [PMC free article] [PubMed] [Google Scholar]
- 34.Voskuil MI, Schnappinger D, Visconti KC, Harrell MI, Dolganov GM, Sherman DR, Schoolnik GK. Inhibition of respiration by nitric oxide induces a Mycobacterium tuberculosis dormancy program. J. Exp. Med. 2003;198:705–713. doi: 10.1084/jem.20030205. [DOI] [PMC free article] [PubMed] [Google Scholar]
- 35.Rodriguez GM, Voskuil MI, Gold B, Schoolnik GK, Smith I. ideR, an essential gene in mycobacterium tuberculosis: role of IdeR in iron-dependent gene expression, iron metabolism, and oxidative stress response. Infect. Immun. 2002;70:3371–3381. doi: 10.1128/IAI.70.7.3371-3381.2002. [DOI] [PMC free article] [PubMed] [Google Scholar]
- 36.Manganelli R, Voskuil M, Schoolnik GK, Smith I. The Mycobacterium tuberculosis ECF sigma factor sigmaE: role in global gene expression and survival in macrophages. Mol. Microbiol. 2001;41:423–437. doi: 10.1046/j.1365-2958.2001.02525.x. [DOI] [PubMed] [Google Scholar]
- 37.Gardiner-Garden M, Littlejohn T. A comparison of microarray databases. Brief Bioinformatics. 2001;2:143–158. doi: 10.1093/bib/2.2.143. [DOI] [PubMed] [Google Scholar]
- 38.Troyanskaya O, Cantor M, Sherlock G, Brown P, Hastie T, Tibshirani R, Botstein D, Altman R. Missing value estimation methods for DNA microarrays. Bioinformatics. 2001;17:520–525. doi: 10.1093/bioinformatics/17.6.520. [DOI] [PubMed] [Google Scholar]
- 39.Liang E, Mersinias V, Smith C, Hubbard S. Analysis of gene expression in operons of Streptomyces coelicolor. Genome Biol. 2006;7:R46. doi: 10.1186/gb-2006-7-6-r46. [DOI] [PMC free article] [PubMed] [Google Scholar]
- 40.Price MN, Huang KH, Aim EJ, Arkin AP. A novel method for accurate operon predictions in all sequenced prokaryotes. Nucleic Acids Res. 2005;33:880–892. doi: 10.1093/nar/gki232. [DOI] [PMC free article] [PubMed] [Google Scholar]
- 41.Kutner MH, Nachsheim CJ, Neter J, Li W. Applied Linear Statistical Models. New York, USA: McGraw-Hill Irwin; 2005. [Google Scholar]
- 42.Agresti A. Catagorical Data Analysis. New York, USA: John Wiley and Sons; 1990. [Google Scholar]
- 43.Hosmer DW, Lemeshow S. Applied Logistic Regression. 2nd. New York, USA: John Wiley and Sons; 2000. edn. [Google Scholar]
- 44.Camus JC, Pryor M, Medigue C, Cole ST. Re-annotation of the genome sequence of Mycobacterium tuberculosis H37Rv. Microbiology. 2002;148:2967–2973. doi: 10.1099/00221287-148-10-2967. [DOI] [PubMed] [Google Scholar]
- 45.Salgado H, Gama-Castro S, Peralta-Gil M, Diaz-Peredo E, Sanchez-Solano F, Santos-Zavaleta A, Martinez-Flores I, Jimenez-Jacinto V, Bonavides-Martinez C, et al. RegulonDB (version 5.0): Escherichia coli K-12 transcriptional regulatory network, operon organization, and growth conditions. Nucleic Acids Res. 2006;34(Database Issue):D394–D397. doi: 10.1093/nar/gkj156. [DOI] [PMC free article] [PubMed] [Google Scholar]
Associated Data
This section collects any data citations, data availability statements, or supplementary materials included in this article.