Abstract
A second mannitol transporter, AgMaT2, was identified in celery (Apium graveolens L. var. dulce), a species that synthesizes and transports mannitol. This transporter was successfully expressed in two different heterologous expression systems: baker's yeast (Saccharomyces cerevisiae) cells and tobacco (Nicotiana tabacum) plants (a non-mannitol-producing species). Data indicated that AgMaT2 works as an H+/mannitol cotransporter with a weak selectivity toward other polyol molecules. When expressed in tobacco, AgMaT2 decreased the sensitivity to the mannitol-secreting pathogenic fungi Alternaria longipes, suggesting a role for polyol transporters in defense mechanisms. In celery, in situ hybridization showed that AgMaT2 was expressed in the phloem of leaflets, petioles from young and mature leaves, floral stems, and roots. In the phloem of petioles and leaflets, AgMaT2, as localized with specific antibodies, was present in the plasma membrane of three ontologically related cell types: sieve elements, companion cells, and phloem parenchyma cells. These new data are discussed in relation to the physiological role of AgMaT2 in regulating mannitol fluxes in celery petioles.
Polyols are present in a number of plant species, where they are primary products of photosynthesis and are translocated between organs in the phloem. Polyols act as carbon storage compounds and are widely distributed among genera in the plant kingdom (Moing, 2000). Polyols are also found in algae, fungi, and lichens. The most commonly found polyols are mannitol (reduced form of Man), sorbitol (reduced form of Fru), and dulcitol (reduced form of Glc; Stoop et al., 1996). On top of their function as translocated sugars, polyols also have antioxidative and osmoprotectant properties that could be related to resistance to several abiotic stresses (drought, salt, cold) and they may even play a role in some biotic stresses (Stoop et al., 1996). This was partly confirmed by plants engineered to produce polyols that showed enhanced resistance to stress (Tarczynski et al., 1993). However, the polyol content of these transgenic plants was low compared to naturally polyol-producing plants (Karakas et al., 1997). Therefore, the evolutionary, if any, advantage for a plant to produce polyol has still to be proven. A better description of plants synthesizing polyols is a preliminary step toward understanding the role of polyols in plants. Although the synthesis and degradation pathways have been extensively described and characterized at the molecular level (Williamson et al., 1995; Everard et al., 1997), only recently were transport mechanisms unraveled through the first cloning of a mannitol transporter in plants (Noiraud et al., 2001a). All these initial clonings have been achieved on celery (Apium graveolens L. var. dulce), which was taken as model plant for these studies.
In species where polyols are products of photosynthesis and are translocated between source and sink organs through the phloem, it was initially proposed that phloem loading of polyols was symplastic (Flora and Madore, 1993). Experiments on celery vascular bundles and phloem strands were in favor of an apoplastic step in mannitol phloem loading (Daie, 1986, 1988). This was later confirmed with plasma membrane vesicles purified from phloem strands of celery (Salmon et al., 1995). A phloem strand cDNA library was made and used to clone the first mannitol transporter characterized in plants (Noiraud et al., 2001a). AgMaT1 shared common characteristics with sugar transporters of the major facilitator superfamily. A second sequence, called AgMaT2 (AF480069), was also identified but not further characterized (Noiraud et al., 2001a).
These initial sequences were used to identify polyol transporters in species translocating sorbitol, such as cherry (Prunus avium) trees (Gao et al., 2003), apple (Malus domestica) trees (Watari et al., 2004), and common plantain (Plantago major; Ramsperger-Gleixner et al., 2004). Moreover, sequences homologous to AgMaT1 were found in a number of species that do not translocate polyols in the phloem, such as Arabidopsis (Arabidopsis thaliana), sugar beet (Beta vulgaris), and rice (Oryza sativa; Noiraud et al., 2001b). In Arabidopsis, six genes are homologous to polyol transporters and one (AtPLT5) has been characterized recently (Klepek et al., 2005; Reinders et al., 2005). AtPLT5 can transport a large variety of substrates, such as glycerol, Glc, and Rib, in heterologous systems. However, no role has been attributed for polyol transporters in species like rice and Arabidopsis.
To gain information on AgMaT2, its function and localization were investigated by several methods. This transporter was successfully expressed in yeast (Saccharomyces cerevisiae), where it displayed uptake characteristics similar to other H+/polyol transporters, and in tobacco (Nicotiana tabacum), a plant that does not synthesize polyols. Preliminary results indicate that AgMaT2 expression led to decreased sensitivity to the mannitol-secreting fungi Alternaria longipes. In celery, expression of the gene and localization of the protein were determined. The results suggest that AgMaT2 has a role in phloem loading of mannitol, as it is present in the plasma membrane of sieve elements (SEs), companion cells (CCs), and also of phloem parenchyma cells. The data are discussed in relation with the function of transport phloem in a temporary sink organ such as celery petiole.
RESULTS
Cloning and Functional Expression of AgMaT2 in Baker's Yeast
AgMaT2 cDNA was initially identified during the screening of a cDNA library made from celery phloem (initially named M7 in Noiraud et al., 2001a). This cDNA displayed 62.3% identity with AgMaT1 (Noiraud et al., 2001a) but was not characterized further. The GenBank accession for AgMaT2 is AF480069. The deduced protein is 524 amino acids long and has 69% homology to AgMaT1.
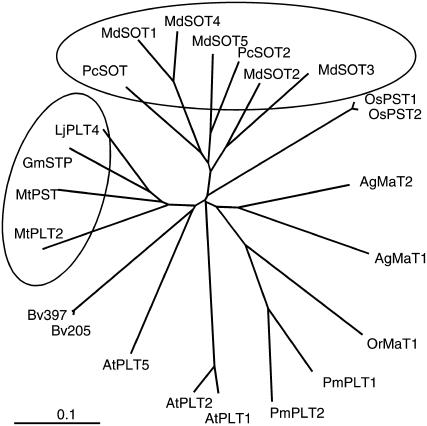
Phylogenic analysis of the deduced protein AgMaT2 showed highest homology with AgMaT1 and polyol transporters from Plantago and the parasitic plant Orobanche ramosa (OrMaT1; Fig. 1). Polyol transporters from legume species group together and so do transporters from Rosaceous species. Putative sequences from rice (OsPST1 and OsPST2), the only monocot species included in the comparison, were more distantly related.
Figure 1.
Phylogenic tree of polyol transporters in different plant species. The deduced sequences of polyol transporters were aligned with the program ClustalX (Thompson et al., 1997) and an unrooted tree was calculated using TreeViewX software (Page, 1996). The following accession numbers correspond to the sequences indicated: AgMAT1 (AAG43998.1, celery), AgMaT2 (AAL85876.2, celery), AtPLT1 (NP_179209.1, Arabidopsis), AtPLT2 (NP_179210.1, Arabidopsis), ATPLT5 (NP_188513.1, Arabidopsis), Bv205 (AAB68028.1, sugar beet), Bv397 (AAB68029.1, sugar beet), GmSTP (CAD91337.1, Glycine max), LjPLT4 (CAJ29291, Lotus japonicus), MdSOT1 (AAO88964.1, apple), MdSOT1 (AAT06053.1, apple), MdSOT2 (AAO88965.1, apple), MdSOT3 (BAD42343.1, apple), MdSOT4 (BAD42344.1, apple), MdSOT5 (BAD42345.1|, apple), MtPLT (ABE82609.1, Medicago truncatula), MtPLT2 (ABE79936.1, M. truncatula), OrMaT1 (AAN07021.1, O. ramosa), OsPST2 (AAL14615.1, rice), OsPST3 (XP_478892.1, rice), PcSOT1 (AAO39267, Prunus cerasus), PcSOT2 (|AAM44082, P. cerasus), PmPLT1 (CAD58709.1, common plantain), and PmPLT2 (CAD58710.1, common plantain).
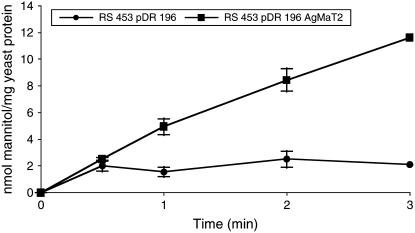
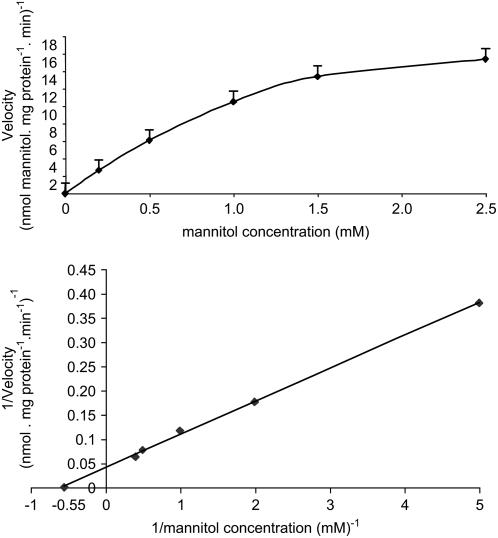
To study the function of AgMaT2, AgMaT2 cDNA was cloned into a yeast expression vector (pDR 196) and expressed in the Saccharomyces strain RS453 (Noiraud et al., 2001a). Figure 2 shows that the uptake rate of 0.55 mm radiolabeled mannitol is 6 times higher in yeast expressing AgMaT2. To further characterize the uptake of mannitol, the kinetic parameters were determined (Fig. 3). Uptake as a function of mannitol concentration displays a saturation over the concentration range studied (Fig. 3A). Lineweaver/Burk representation (Fig. 3B) allows the calculation of a KM of 1.8 mm and a Vmax of 28 nmol mg protein−1 min−1. A 2 mm mannitol concentration was therefore used to study the pH dependency of mannitol uptake. The optimal pH for mannitol uptake is around 4.5 (data not shown) as for AgMaT1. This, together with the large inhibition (almost 80%) of mannitol uptake by the protonophore carbonylcyanide m-chlorophenylhydrazone (Table I), was taken as evidence for a mannitol/H+ cotransport. Several substrates (polyols and hexoses) were tested for their effect on mannitol uptake at a substrate/mannitol concentration ratio of 10. Suc had no effect on mannitol uptake, whereas all other sugars inhibited mannitol uptake. The most inhibitory were xylitol, Glc, and Fru (around 65% inhibition). As already noted for AgMaT1, p-chloromercuriphenylsulfonic acid (PCMBS) had no significant effect on mannitol transport.
Figure 2.
Mannitol uptake in RS453 yeast cells expressing AgMaT2. Yeast cells were grown to the early logarithmic phase. During uptake, the mannitol concentration was 0.55 mm and the external pH was 4.5. Squares represent uptake by cells transformed with AgMaT2, and circles represent uptake by control cells transformed with the plasmid pDR 196. The results are the mean ± sd of two independent experiments (four replicates per experiment).
Figure 3.
Concentration dependence of mannitol transport in yeast expressing AgMaT2. Culture conditions were as described in Figure 2. A, Mannitol uptake rates of RS453 control cells (with the pDR 196 plasmid) were subtracted from mannitol uptake rates of AgMaT2-expressing cells to determine the AgMaT2-dependent mannitol uptake rates at different mannitol concentrations. Uptake duration was 2 min. B, Lineweaver/Burk plot of the same data set. The results are from one typical experiment (four replicates per point).
Table I.
Specificity of the AgMaT2 mannitol transporter
Culture conditions were as described in Figure 2. Competing sugars were supplied in 10-fold higher concentrations compared mannitol. The results are the mean ± sd of two independent experiments.
| Added Compound | Absorption |
|---|---|
| % | |
| None | 100 |
| Carbonylcyanide m-chlorophenylhydrazone, 50 μm | 24.6 ± 1.4 |
| PCMBS, 100 μm | 89.3 ± 7.6 |
| Mannitol | 56.7 ± 3.3 |
| Dulcitol | 67.1 ± 1.9 |
| Sorbitol | 57.8 ± 1.4 |
| Xylitol | 37.0 ± 1.8 |
| Myoinositol | 66.7 ± 2.7 |
| Man | 53.8 ± 5.2 |
| Suc | 97.0 ± 2.1 |
| Glc | 36.2 ± 0.5 |
| Fru | 24.6 ± 1.4 |
AgMaT2 Was Successfully Expressed in Tobacco and Gives Protection to Alternaria
To study the activity of AgMaT2 in a plant cell system, AgMaT2 was introduced into tobacco plants as tobacco does not produce and transport polyol (Karakas et al., 1997). Tobacco has already been engineered to express mannitol-synthesizing and -degrading activities (Tarczynski et al., 1993; Jennings et al., 2002). Tobacco leaf discs were transformed with an Agrobacterium tumefaciens strain containing the pBI101 plasmid with AgMaT2 under the control of the cauliflower mosaic virus 35S promoter. Plants showing resistance to kanamycin were regenerated, and presence of the transformants was checked on F1 and F2 plants. Three independent lines were selected and further analyzed and compared with control plants. Transformation of the plants was confirmed by PCR analysis with NPTII-specific primers (data not shown) and by northern-blot analysis of AgMaT2 expression. Data in Figure 4 show that in F2 plants a signal corresponding to the expression of AgMaT2 could be detected in two transformants out of three. These two lines (B5 and B6) were used for further studies. Moreover, slight differences in the level of expression were detected between individual plants originating from the same callus. No signal was found in control tobacco plants under normal conditions: This indicates that no gene homologous to AgMaT2 was expressed in tobacco, at least under control conditions.
Figure 4.
Northern-blot analysis of transformed tobacco. RNA was extracted from leaves of tobacco plants, separated on a gel, transferred to a nylon membrane, and challenged with 32P-labeled AgMaT2 cDNA. For each plant type, two individual plants were used. Lanes C: control plants; lanes B5: B5 plants; lanes B6: B6 plants; lanes B4: B4 plants. Top row, Autoradiographs after challenging the membrane with the labeled probe; bottom row, staining of rRNA.
No significant difference in growth parameters could be detected between control plants and those expressing AgMaT2 (B6 plants, 12 plants for each condition), except that the latter had slightly longer internodes (48 ± 8 mm versus 39 ± 6 mm) and thus the plants were higher at flowering (856 ± 120 mm versus 750 ± 98 mm). However, the number and size of leaves were not different between control and transgenic plants. No mannitol could be detected by HPLC measurements in transformed or control plants.
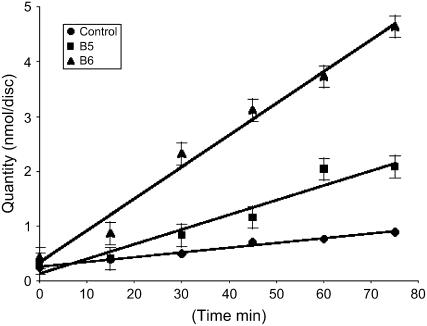
To confirm that the protein was active in transgenic plants, leaf discs were punched from leaves of in vitro-grown plants (control and transgenics) and incubated on liquid medium with radiolabeled mannitol (see “Materials and Methods”). The radioactivity taken up after incubation times ranging from 15 to 75 min was assayed (Fig. 5). It is clear that uptake of mannitol was much higher in plants expressing AgMaT2: The slopes of the curves are 1.31 nmol min−1 disk−1 for control plants, 4.76 for B5 plants, and 9.31 for B6 plants. This indicates that the capacity to take up mannitol is linked to the presence of the transgene.
Figure 5.
Uptake of 3H-mannitol in tobacco leaf discs. Leaf discs (6-mm diameter) were sampled from in vitro-grown tobacco plants and incubated in the presence of 2 mm 3H-mannitol. Diamond-shaped symbols are for control plants, square for B5 plants, and triangle for B6 plants. Results are the mean ± sd of three independent experiments (six replicates per point).
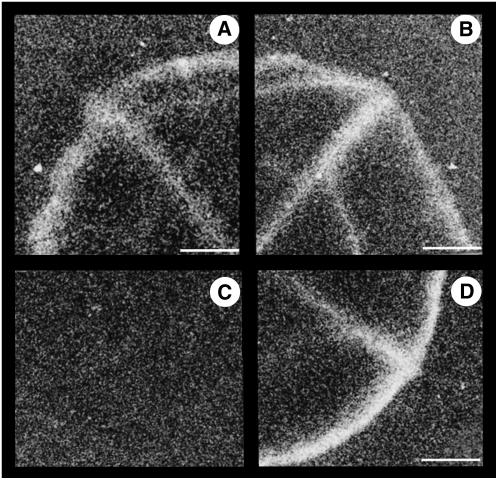
Autoradiographs of leaf discs after incubation with radiolabeled mannitol were compared with those obtained with radiolabeled Suc, the main form of carbon transport in tobacco. For Suc, taken as a control, the white signal associated with the radioactivity was similar in both control (Fig. 6A) and B6 (Fig. 6B) plants, indicating that AgMaT2 expression did not alter Suc uptake. In the case of mannitol, the signal was only seen in B6 plants (Fig. 6D), not in control plants (Fig. 6C). Interestingly, in B6 plants the localization of the signal in discs after uptake of mannitol was similar to the one after uptake of Suc. Under our experimental conditions (leaf discs from in vitro-grown plants where the lower epidermis has not been removed), the cut edges and the major veins of the discs were labeled. AgMaT2 was expressed under the control of the ubiquitous cauliflower mosaic virus 35S promoter, but mannitol was accumulated in the major vein as Suc. This confirmed the high expression level of the 35S promoter in the phloem cells, as already noted (Kühn et al., 1996), and demonstrated that exogenously supplied mannitol followed the same transport path as Suc. The presence of the lower epidermis prevented a good labeling of the minor vein network compared to, for example, Vicia faba leaf discs after incubation on Suc (Delrot and Bonnemain, 1981). Labeling is clearly linked to the expression of a transporter: It is seen in the both types of plant in the case of Suc (Fig. 6, A and B), but for mannitol only in plants expressing AgMaT2.
Figure 6.
Autoradiographs of leaf discs after uptake of labeled mannitol and Suc. Leaf discs (10-mm diameter) were sampled from in vitro-grown tobacco plants and incubated in the presence of 2 mm 14C-Suc (A and B) or 14C-mannitol (C and D) during 30 min. After freeze-drying of discs, a film (Biomax MR; Kodak) was exposed for 2 weeks. The radioactivity appears in white. Discs were from control plants (A and C) or from B6 plants (B and D). Scale bar = 1.7 mm.
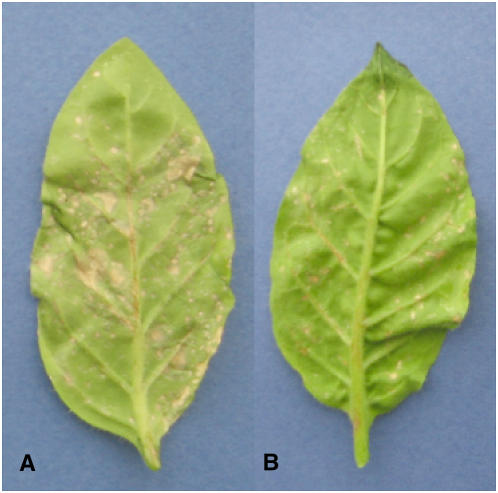
Mannitol secreted by some fungal pathogens has been proposed to protect them against reactive oxygen species-mediated host defense during infection (Jennings et al., 1998). Jennings et al. (2002) demonstrated that the constitutive expression of a celery mannitol dehydrogenase activity in tobacco led to a decreased sensitivity toward the mannitol-secreting pathogenic fungus Alternaria alternata. As mannitol dehydrogenase was demonstrated to be cytosolic (Yamamoto et al., 1997), we hypothesized that a mannitol transport activity had to be present at the same time. To test this possibility, AgMaT2-transformed and untransformed plants were challenged with A. longipes (formerly A. alternata). At 4 d after inoculation, the development of typical symptoms, i.e. necrotic lesions surrounded by chlorotic halos, was observed on both wild-type and transformed inoculated plants (Fig. 7). No symptom was observed on leaves of control plants treated with sterile distilled water (data not shown). While the two tested genotypes could be considered as susceptible, the percentage of necrotic tissues was significantly lower in leaves expressing AgMaT2 (B6 plants) than in leaves from untransformed plants. The mean necrotic areas were 14.6% ± 0.9% and 3.0% ± 0.2% of the total leaf surface for control and transformed plants, respectively (mean of five measurements on representative leaves from two independent tests).
Figure 7.
Necrotic symptoms of tobacco leaves challenged with A. longipes. Representative leaves were photographed 4 d after inoculation with the Alternaria conidial suspension (see “Materials and Methods”). A, Leaf from a control plant; B, leaf from a B6 plant.
Localization of AgMaT2 Gene Expression in the Phloem of Celery
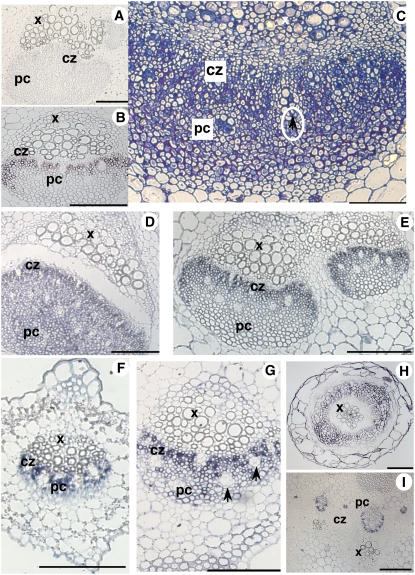
Although the functional expression of AgMaT2 in yeast and tobacco are in favor of plasma membrane localization, no such information was available about the localization in celery. As a first step to characterize the expression pattern of AgMaT2, in situ hybridization experiments were run on sections made from different celery organs embedded in paraffin. Preliminary experiments were run to ensure that no cross-reaction of the probe AgMaT2 with other mannitol transporters from celery (AgMaT1: Noiraud et al., 2001a; and AgMaT3: L. Landouar-Arsivaud and R. Lemoine, unpublished data) RNA occurred in our conditions (see “Materials and Methods”). For each section, hybridizations with the sense (negative control) and antisense (positive) probes were run. As expected, no signal was noted with the sense probe (Fig. 8A). In situ hybridization with AgMaT2 antisense probe was run on different organs with emphasis on the transport phloem path (leaflet and petiole).
Figure 8.
Localization of AgMaT2 mRNA in celery phloem. A to I, The sections were challenged with either the sense AgMaT2 riboprobe (A) or the antisense riboprobe (B, D–I). C, A semithin section of petiole was stained with toluidine blue. B, D, and E, The AgMaT2 transcript localization was performed in petioles from young (D) and mature (E) leaves, where AgPP2-1 (a typical phloem gene) transcripts were also localized (B). F to I, Localization of AgMaT2 mRNA in the phloem of leaflets from young (F) and mature leaves (G), roots (H), and floral stalk (I). cz, Conducting zone; pc, phloem parenchyma cells (bundle cap); x, xylem. Arrowheads indicate oil ducts. Scale bar = 100 μm.
The vascular bundles in the petiole and leaflet midribs have the same structure. Phloem can be divided in two regions: adjacent to the cambium, the conducting zone rich in CCs and SEs, then the bundle cap made of phloem parenchyma cells. Bundle cap is much wider in the petiole (Fig. 8C). The conducting zone was evidenced by hybridization with an AgPP2-1 probe (Fig. 8B): AgPP2-1 is only expressed in CCs (Dinant et al., 2003).
Interestingly, oil ducts are present in the inner part of the bundle cap and also in the conducting zone of the phloem (arrows in Fig. 8, C and G). This may facilitate exchange of molecules between phloem cells and cells at the border of the oil duct. The conducting zone and bundle cap are very tightly linked and then can easily be separated from surrounding tissues (xylem and storage parenchyma in the petiole) by mechanical dissection, allowing a range of studies on phloem function (Daie, 1986; Salmon et al., 1995; Noiraud et al., 2001a; Vilaine et al., 2003).
AgMaT2 expression was detected in the conducting zone of petiole vascular bundles at two different development stages: young yellowish leaves (Fig. 8D) and fully mature green leaves (Fig. 8E). It has to be noted that oil ducts were not labeled. In petioles from young leaves, the phloem parenchyma cells in the bundle cap showed AgMaT2 expression (pc in Fig. 8D), which was not the case in petiole from mature leaves (Fig. 8E). Staining was not found in the xylem or storage parenchyma cells (Fig. 8, D and E).
AgMaT2 was also expressed in the conducting zone in the midrib of leaflets from young and mature leaves (Fig. 8, F and G, respectively). It has to be noted that the size of leaflets did not change significantly during this development period, although the vascular bundle increased in size (compare Fig. 8, F and G). As noted previously, no label was found in oils ducts and other tissues. The parenchyma cell zone is very thin in young leaflets (Fig. 8F) and larger in mature leaflets (Fig. 8G); however, no staining was detected in that zone in both cases.
Experiments were also conducted on roots from young plants. Staining was located in the phloem zone of the stele and at a lower level in the cortical parenchyma (Fig. 8H). As celery is a biennial plant, flowering was induced by subjecting 2-month-old plants to 4 weeks vernalization in a cold room (5°C, same light conditions as described in “Materials and Methods”). Plants were then transferred back to the greenhouse, where they flowered after 3 to 4 months. In the floral stalk, only the conducting zone of the phloem was labeled with AgMaT2 (Fig. 8I).
Localization of AgMaT2 Protein Expression in the Plasma Membrane of Phloem Conducting Cells
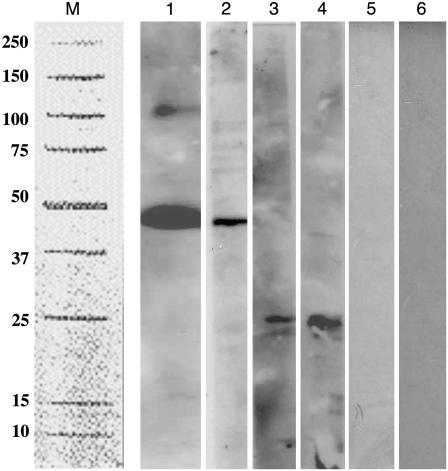
The data from gene expression studies localized AgMaT2 expression in the conducting zone of phloem. However, this did not give indication on the expression of AgMaT2 protein. Polyclonal antibodies were raised against a peptide in the C terminus of AgMaT2 (see “Materials and Methods”). Care was taken in the choice of the peptide to avoid cross-reaction with AgMaT1. This was further confirmed by challenging plasma membrane vesicles from yeast expressing AgMaT1 or AgMaT2 with anti-AgMaT2 antibodies (Fig. 9, lanes 2 and 6). A signal was detected only in AgMaT2-expressing yeast (lane 2). Furthermore, the apparent molecular mass of AgMaT2 (48 kD) was the same in yeast (Fig. 9, lane 1) and in plasma membrane vesicles from celery leaves (Fig. 9, lane 2). In the plasma membrane fraction from celery leaves, a signal was occasionally detected at a higher molecular mass, which may indicate interactions with other proteins or multimerization (see “Discussion”). In comparison, no signal was detected for AgMaT2 in microsomal membranes or in the soluble proteins fraction from celery leaves, but a reaction was noted for a lower molecular mass (27 kD; Fig. 9, lanes 3 and 4). Altogether, these data indicated that the antibodies raised against AgMaT2 were suitable for use in localization studies.
Figure 9.
Western blot of membrane fractions (50 μg) probed with the anti-AgMaT2 serum (1/100 dilution). Lane M indicates the position of molecular mass markers. Lane 1, Celery leaflet plasma membrane. Lane 2, Plasma membrane of yeast expressing AgMaT2. Lane 3, Soluble protein from celery leaves. Lane 4, Microsomal fraction from celery leaves. Lane 5, Plasma membrane of control yeast (transformed only with plasmid pDR 196). Lane 6, Plasma membrane of yeast expressing AgMaT1.
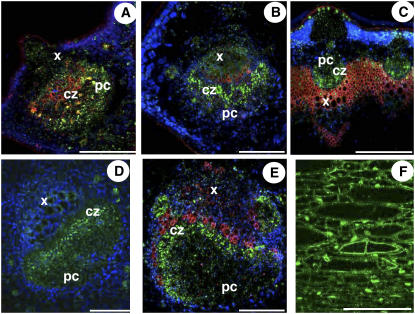
Initial experiments were made on sections from the same tissues (unfixed, Wang et al., 1995), as for in situ hybridization experiments. The results are presented on Figure 10 using a fluorescent second antibody. The signal in young leaves was very faint (Fig. 10A) and limited to the conducting zone of the phloem. The same localization was noted in mature leaflets (Fig. 10B), but the signal was much stronger. Signals were also clearly visible in the conducting zone of cross sections of petioles from young and mature leaves (Fig. 10, D and E). In all cases, no signal was detected in either xylem or parenchyma cells (bundle cap), or in oil ducts. Phloem cells were also labeled in floral stalk (Fig. 10C). Except in young petioles, those results correspond to the localization of AgMaT2 expression (Fig. 8). Longitudinal sections were also prepared from petiole phloem after embedding. The results in Figure 10F show a clear localization of the signal at the periphery of cells, in accordance with a plasma membrane localization. However, it was not possible to identify the cell type where the label was found, so the localization of AgMaT2 was studied in electron microscopy (EM) experiments. Ultrathin sections were prepared and challenged with AgMaT2 antibodies. Taking into account the different data already obtained, the investigations were limited to the conducting zone of phloem, both in petioles and leaflets. Omitting the secondary antibody led to an absence of staining, confirming the efficiency of the blocking protocol (Fig. 11G).
Figure 10.
Distribution of AgMaT2 protein in the phloem. A, Young leaflet; B, mature leaflet; C, floral stalk; D, young petiole; and E, mature petiole (fresh tissue transverse sections). F, Longitudinal section of embedded tissues. Sections were challenged with anti-AgMaT2 antibodies and Alexa-conjugated second antibodies (signal appears in green). cz, Conducting zone; pc, phloem parenchyma cell (bundle cap); x, xylem. Scale bar = 100 μm. Chloroplasts appear in blue and the autofluorescence of xylem vessels in red.
Figure 11.
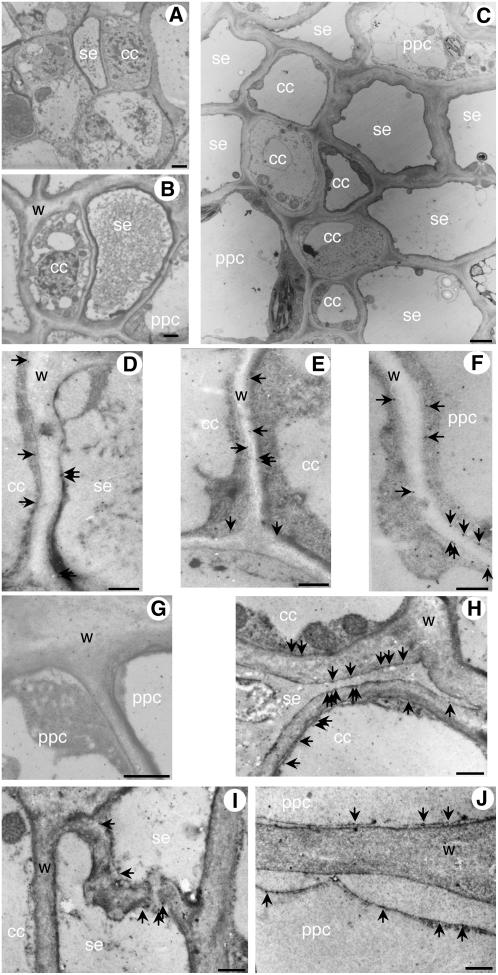
Localization of AgMaT2 protein in the different phloem cell types in thin sections (60–80 nm). Ultrastructural features of the conducting zone in leaflet (A) and petiole (B and C) are presented. Sections are from leaflet major vein (A, D–F) and petiole vascular bundle of celery mature leaf (C, G–J). The immunolabeling by gold particles of AgMaT2 proteins in the plasma membrane is indicated by arrows. A control was made where the primary antibody directed against AgMaT2 was omitted (G). cc, CC; ppc, phloem parenchyma cell; se, SE; w, wall. Scale bar = 0.5 μm.
The SE and CCs were easily distinguished both in leaflet veins (Fig. 11A) and petiole conducting bundles (Fig. 11B). As already reported, the SE diameter is smaller than the CC in leaflets (loading phloem; Fig. 11A), whereas both cell types are of similar diameter in petioles (conducting phloem; Fig. 11B). In the conducting zone of petiole phloem, several SEs are often found connected together, forming large conducting units (Fig. 11C).
The gold particles were clearly aligned to the plasma membrane of different cell types (arrows in Fig. 11, D–J). The plasma membrane localization was confirmed in Figure 11J, where the plasma membrane of the lower cell was detached from the cell wall due to cell plasmolysis: Gold particles clearly followed the plasma membrane.
The immunolabeling was studied at the interface between the different cell types in the phloem of leaflets (Fig. 11, D–F) and in petioles (Fig. 11, H–J) from mature leaves. Plasma membranes were stained in SEs and CCs at their interface in leaflets (Fig. 11D) and petioles (Fig. 11H). Moreover, plasma membrane of CCs was also labeled at the interface between two CCs (Fig. 11E). In Figure 11I, a sieve plate between two SEs is clearly visible with some labeling in the plasma membrane at the sieve plate level. Unexpectedly, staining was also noted in the plasma membrane of phloem parenchyma cells both in leaflets (Fig. 11F) and in petioles (Fig. 11J). This may be related to the ontogeny of the phloem parenchyma cells (see “Discussion”). No other cell types, such as storage parenchyma or xylem, were stained.
DISCUSSION
AgMaT2 Acts as a Mannitol Transporter in Yeast and Transgenic Tobacco
AgMaT2 cDNA was initially identified together with AgMaT1 (Noiraud et al., 2001a), but no mannitol transport activity could be demonstrated in the yeast strain MaDH4α. The sequence of AgMaT2 indicated that it was highly related to other polyol transporters. When expressed in a different yeast strain, the transport activity could be demonstrated (Fig. 2). AgMaT2 displays characteristics similar to AgMaT1: pH dependency and protonophore sensitivity are in favor of an H+/mannitol transport system. AgMaT2 has a lower affinity toward mannitol than AgMaT1 (1.8 mm versus 0.65 mm). Except for Plantago transporters (PmPLT1 and PmPLT2 with affinity of 12 mm and more than 20 mm, respectively), polyol transporters in other species have affinities in the same range as AgMaT1 and AgMaT2: 0.64 and 0.82 mm for sorbitol transporters of sour cherry (Gao et al., 2003) and 0.71 mm for MdSOT3 and 3.2 mm for MdSOT5 in apple (Watari et al., 2004), with slightly higher values for AgMaT2 (1.8 mm) and MdSOT5 (3.2 mm). Moreover, all polyol transporters, including AgMaT2, are not sensitive to PCMBS, in contrast to Suc transporters (Lemoine, 2000). This indicates the absence of a thiol group accessible to PCMBS in or close to the binding site of polyols. In the nontransporting species Arabidopsis, the KM value of AtPLT5 for sorbitol is 0.5 mm. Those affinities, except in Plantago, are in the range of those found for Suc transporters (Lemoine, 2000), whereas hexose transporters have affinities in the micromolar range (Williams et al., 2000).
As many other polyol transporters, AgMaT2 has a low substrate specificity. Both inhibition studies (Table I) and transport measurements with radiolabeled substrates (data not shown) indicate that sorbitol and xylitol are also substrates for AgMaT2. Despite inhibition of mannitol uptake by Glc, no Glc transport activity could be measured for AgMaT2 (data not shown), a situation similar to AgMaT1 (Noiraud et al., 2001a) but different from AtPLT5, which was demonstrated to transport Glc (Klepek et al., 2005; Reinders et al., 2005). We can therefore conclude AgMaT2 function in celery is to transport mannitol found at high concentration in the phloem and stored in the petiole.
Few sugar transporters have been successfully expressed in heterologous plant system, except for a potato (Solanum tuberosum) Suc transporter (Leggewie et al., 2003) and a grape (Vitis vinifera) hexose transporter (Leterrier et al., 2003), both in tobacco, and a potato sugar transporter in pea (Pisum sativum; Rosche et al., 2002). However, in all cases these transporters were expressed in order to alter the source to sink ratio by altering Suc transport. AgMaT2 was expressed in tobacco for the following reasons: No mannitol is present in tobacco and tobacco had already been genetically modified to express either mannitol synthesis (Tarczynski et al., 1993; Karakas et al., 1997) or degrading (Jennings et al., 2002) activities. It was therefore interesting to study the effect of AgMaT2 expression in the same species. AgMaT2 is functional in tobacco, as it drives uptake of radiolabeled mannitol in leaf discs. No background transport activity was noted in untransformed plants, as expected from a plant that does not produce mannitol. Moreover, no mannitol was found either in control or transformed plants, confirming that the expression of a transport activity did not influence the overall carbon metabolism. The slight increase in internode length in AgMaT2-expressing plants was not significant and was the only phenotypic change noted.
An inducible mannitol dehydrogenase activity could be measured in tobacco plants challenged with the mannitol-producing pathogen A. alternata (Jennings et al., 1998). The induction of a mannitol dehydrogenase activity was explained as a mechanism for the plant to degrade mannitol produced by the pathogen to suppress reactive oxygen species-mediated defenses. Tobacco plants transformed to express constitutively a mannitol dehydrogenase from celery had increased resistance to A. alternata (later renamed A. longipes). Interestingly, transgenic plants expressing AgMaT2 showed less sensitivity to A. longipes than control plants (Fig. 7). Expression of an inducible mannitol transporter in tobacco in tandem with mannitol dehydrogenase would make sense, as mannitol dehydrogenase has been localized to the cytoplasm (Yamamoto et al., 1997). As Suc and mannitol uptake had a similar localization in autoradiographs from leaf discs (Fig. 6), we can suppose that AgMaT2 was expressed in the plasma membrane of transgenic cells, therefore facilitating the entry of mannitol in the cytoplasm for degradation. This putative involvement of polyol transporters in defense mechanisms could explain the presence of sequences homologous to AgMaT1 and AgMaT2 in species that do not translocate polyols. In tobacco, one EST (EB441428) highly homologous to AgMaT1/2 is present in the databases. Moreover, when the mannitol dehydrogenase DNA sequence was identified, it showed high homologies to the pathogenesis-related protein ELI-3 from Arabidopsis (Williamson et al., 1995). More data are needed before concluding that the coupled expression of mannitol transport and catabolic activities is a general defense pathway against mannitol-producing pathogens. However, this may not be the function of AgMaT2 in celery as it expressed only in phloem cells.
AgMaT2 Is Expressed in the Conducting Zone of Phloem in Several Organs of Celery
As little is known about the localization of expression of polyol transporter genes in plants, in situ hybridization experiments were performed in different organs to localize the expression of AgMaT2. In all organs tested, from leaflet to root and to floral stem, AgMAT2 was detected in the phloem, more precisely in the conducting zone of the phloem (in the case of large vascular bundles). In young leaves, AgMaT2 expression was already detected in the phloem of leaflet and petiole, suggesting that mannitol transport occurs early in development. Young leaves were harvested at approximately 10 cm in length, a size similar to the “young leaves” described to translocate mannitol in the phloem (Davis and Loescher, 1990). Expression of AgMaT2 at this stage is therefore in accordance with physiological data. The petiole of mature celery leaves is a sink organ where sugars (mainly hexoses derived from Suc and mannitol) are stored (Davis and Loescher, 1990). During senescence, the petiole undergoes a sink-to-source transition and sugars are reloaded in the phloem stream to be delivered to new emerging sinks (Daie, 1986). However, in the experiments described here, petioles acted as sink organs both in young and mature leaves. In apple leaves, two (MdSOT4 and MdSOT5) of the three cloned sorbitol transporters were expressed in sink and source leaves, whereas the third one (MdSOT3) was expressed only in source leaves (Watari et al., 2004). For AgMaT1, the other mannitol transporter characterized in celery, northern-blot experiments indicated a higher expression in leaflets than in the phloem of petioles (Noiraud et al., 2001a). This may indicate a role of AgMaT1 in phloem loading in source organ. However, more data are needed to precisely compare the expression pattern of the different mannitol transporters in celery.
The expression of AgMaT2 in petioles was compared with that of AgPP2-1, a typical CC-expressed gene (Dinant et al., 2003). The expression of AgPP2-1 was restricted to the conducting zone close to the cambium in mature petioles (Fig. 8D). AgMaT2 had a similar pattern in young petioles (Fig. 8F), but spread into the bundle cap (Fig. 8D). These contrasting labelings might be related to the ontogeny of phloem. During its development, the older CCs and sieve tubes are moved away from the cambial zone, tend to degenerate, and become crushed, thus leaving only parenchyma cells that finally constitute the bundle cap (Esaü, 1936). This phenomenon is less present in the protophloem (young petioles) than in the metaphloem (mature petioles), therefore leaving more conducting cells in the bundle cap of young petioles.
AgMaT2 Is Localized to the Plasma Membrane of SEs, CCs, and Phloem Parenchyma Cells
Specific antibodies were raised against the C terminus region of AgMaT2 to perform a precise localization of AgMaT2 in the phloem cells. In plasma membrane vesicles from leaves, a reaction was sometimes noted at high molecular mass: This could indicate multimerization of AgMaT2 or interaction with other transporters, as was noted recently in the case of Suc transporters in potato (Reinders et al., 2002).
AgMaT2 was first localized at the cell level by immunofluorescent labeling. The data in Figure 10 show that AgMaT2 was found only in the conducting zone of phloem both in leaflets and petioles. In the leaflet, signal was more intense in the samples from mature leaves than young leaves, in accordance with a higher mannitol synthesis in mature leaves in celery (Davis and Loescher, 1990). One interesting point is that AgMaT2 was not found in phloem parenchyma (bundle cap) in petioles from young leaves, in contrast with the data from in situ hybridization experiments. This could mean that AgMaT2 is not transcribed or is at very low level in the bundle cap (Fig. 10D).
The data presented in Figure 11 clearly demonstrate that AgMaT2 is localized to the plasma membrane, both in petiole and leaflet of mature leaves. Vascular bundles of petiole and major veins of leaflet have a similar collateral structure: The main difference is that the bundle cap is smaller in mature leaflet than in mature petiole (compare Fig. 8, C and F). The three cell types of the conducting zone (SE, CC, and phloem parenchyma cell) originate from the same mother cell (Esaü, 1936). Those cells are localized at the interface between cambium and bundle cap. AgMaT2 was present in the plasma membrane of SE, CC, and also parenchyma cells. No labeling was found in the membrane of other cell types or in the bundle cap. In Solanaceaous species, Suc transporters were localized to the plasma membrane of SEs (Kühn et al., 1997), whereas in Arabidopsis (AtSUC2; Truernit and Sauer, 1995) and Plantago (PmSUC2; Stolz et al., 1999) they were localized to CCs. In Plantago, sorbitol transporters (PmPLT1 and PmPLT2) were also localized to the CCs, together with PmSUC2 (Ramsperger-Gleixner et al., 2004). However, CCs of small vein seemed to express only PmSUC2. This expression pattern of sugar transporter in either CC or SE, according to the species, was recently challenged by the localization of the Suc transporter SUC3 to the SE of Plantago (Barth et al., 2003) and Arabidopsis (Meyer et al., 2004), and the localization of AmSUT1, a Suc transporter in Alonsoa meridionalis, to both CCs and SEs of leaf major and minor veins and also in the stem (Knop et al., 2004). Despite differences in cell expression, both StSUT1 (expressed in the SE) and AtSUC2 (expressed in the CCs) were shown to be essential for Suc phloem loading and long-distance transport (Riesmeier et al., 1994; Gottwald et al., 2000).
In celery, petioles are storage organs that accumulate sugars (mannitol and hexoses) in large storage parenchyma cells (Keller and Matile, 1989). In petioles, phloem fulfils different functions: transport of photoassimilates from the leaves to sink organs (transport phloem according to van Bel, 1996), unloading of photoassimilates (sink stage), and loading of sugars from storage cells (source stage; Daie, 1988). Arrangement of several SEs connected together in the petiole (Fig. 11C) argues in favor of the transport function of phloem in this organ. Recently, Hafke et al. (2005) proposed that, in transport phloem, SEs and phloem parenchyma cells compete for sugars. In apoplastic species, they noted that the membrane potential of SE is higher than that of phloem parenchyma cells, therefore favoring uptake in the SE. The presence of specific transporters in parenchyma cells was supposed in their model. Cell wall ingrowths in phloem parenchyma cells, under several conditions, have also been related to an increase of exchange surface facilitating the release of assimilates toward the SE/CC complex in the loading phloem (Haritatos et al., 2000; Amiard et al., 2005, 2007). However, the authors did not search for specific sugar transporters in those cells.
Mannitol transporters in phloem parenchyma cells of the conducting zone may be present to favor uptake of mannitol (unloaded or leaked from the sap stream), further distribution to phloem parenchyma cells of the bundle cap, and then to the storage parenchyma cells when the petiole is in the sink (storage) stage. Few plasmodesmata are present between phloem parenchyma cells and either SEs or CCs, in contrast with the numerous branched plasmodesmata found at the SE/SE and SE/CC interfaces (data not shown). The bundle cap could be considered as an intermediate zone between the conducting cells and storage parenchyma cells, at least in the petiole. Expression of AgMaT2, in conducting cells (SE/CC) and in phloem parenchyma cells, may indicate different functions fulfilled by the same transporter, according to the cell type where it is expressed, as suggested recently for ZmSUT1 (Carpaneto et al., 2005). All these data taken together indicate the complexity of sugar fluxes in the petiole of celery. More information is needed to understand how the expression of specific transporters correlates with the movements of sugars between those different compartments.
CONCLUSION
In this article, the physiological function of AgMaT2 was investigated in celery where it is normally expressed and in tobacco, a plant that does not synthesize or transport mannitol. AgMaT2 was characterized in yeast as a H+/mannitol cotransport system. In celery, the expression pattern, both at the gene and at the protein level, showed that AgMaT2 is present in the conducting cells of the phloem, whatever the organ. More precisely, AgMaT2 was localized to the plasma membrane of SEs, CCs, and phloem parenchyma cells in the transport phloem. This localization in three different cell types has not been found for other transporters yet (Suc, hexose, or polyol transporters). This expression pattern may relate to complex sugar fluxes in an organ such as the petiole, where mannitol is being transferred in the phloem sap to sink organs (roots and developing leaves), while petiole is itself a sink organ accumulating mannitol. These data also confirm the function of phloem parenchyma cells as involved in local sugar fluxes. The results showing that AgMaT2 expression in tobacco led to decreased sensitivity to A. longipes, a result already noted when expressing a mannitol dehydrogenase activity in tobacco (Jennings et al., 2002), may indicate a new defense pathway to resist mannitol-secreting pathogens. Therefore, polyol transporters may fulfill different function whether they are expressed in species that synthesize and transport polyol, like celery, or in species like tobacco and Arabidopsis that do not.
MATERIALS AND METHODS
Plant Material
Celery plants (Apium graveolens L. var. dulce, ‘Vert d'Elne’) were grown in a greenhouse as described by Noiraud et al. (2000). The different organs and tissues were sampled in the greenhouse and quickly frozen in liquid nitrogen. RNA extraction was done according to Noiraud et al. (2000).
Cloning and Sequencing
The initial cloning of AgMaT2 was reported by Noiraud et al. (2001a). The initial clone was sequenced several times and the confirmed sequence deposited in GenBank under the accession number AF480069.
AgMaT2 Expression in Yeast
The AgMaT2 cDNA was cloned into the EcoRI and XhoI sites of pDR 196 and used to transform yeast (Saccharomyces cerevisiae) strain RS453 as described by Noiraud et al. (2001a). Yeast cultivation on glycerol and uptake of radioactive mannitol followed the same protocol as described by Noiraud et al. (2001a).
AgMaT2 Expression in Tobacco
The entire coding region of AgMaT2 was cloned into pBI101 and transformed into Agrobacterium tumefaciens according to Atanassova et al. (1995). Tobacco (Nicotiana tabacum var. Samsun) leaf discs (12 mm) from in vitro culture were transformed with Agrobacterium harboring AgMaT2/pBI101 according to Leterrier et al. (2003). Transformed calli were selected on kanamycin and plants regenerated. Subsequent experiments were run on T2 and T3 plants. RNA was extracted (Kay et al., 1987) from mature leaves of either control or transformed plants and used for northern-blot experiments to check for expression of AgMaT2. The activity of AgMaT2 was checked by measuring 3H-mannitol uptake in leaf discs from in vitro-grown plants. The protocol was as described by Leterrier et al. (2003), except that Suc replaced mannitol as an osmoticum in the different buffers. For some experiments, 14C-mannitol and 14C-Suc (7.4 kBq/mL) were fed to leaf discs for 30 min at pH 5.5 in order to locate the site of sugar uptake on autoradiographs (Delrot and Bonnemain, 1981).
Plant Inoculation
The mannitol-secreting phytopathogenic fungus Alternaria longipes (strain CBS917.96 from Centraalbureau voor Schimmelcultures, Utrecht, The Netherlands) was grown at 24°C under near UV light on a potato dextrose agar medium for 7 d. Sterile distilled water was then added to the plates and the conidial suspensions collected. Three-week-old in vitro-grown tobacco plants were inoculated by uniformly spreading with a paintbrush a calibrated conidial suspension (2 105 conidia/mL) over the abaxial sides of five to six leaves of either wild-type or transformed plants. Inoculated plants were incubated at 22°C. Noninoculated controls were performed using the same procedure by spreading sterile distilled water instead of spore suspension. Images were taken at 4 d after inoculation to score for lesion formation using a digital camera. The total and necrotic areas were measured for each leaf using the ImageJ v1.36b software (http://rsb.info.nih.gov/ij/). Values obtained for each leaf from a same genotype were averaged. Two independent experiments were performed.
In Situ Hybridization
In situ hybridization experiments were carried out on leaflet, petiole, root, and flower of celery. Small fragments from each organ were embedded in paraffin and processed as described by Vignault et al. (2005). Digoxigenin-labeled sense and antisense riboprobes were synthesized by in vitro transcription from pKSII (Stratagene) vector carrying the cDNA of AgMaT2 after restriction by XbaI/XhoI. Digoxigenin-11-UTP was incorporated by either T3 or T7 polymerase according to the manufacturer's instructions (Boehringer Mannheim). The selectivity of the AgMaT1 probe was checked through a dot-blot experiment. One hundred nanograms of cDNAs from the three identified mannitol transporters in celery (AgMaT1, AgMaT2, and AgMaT3) were diluted in 1 mL of distilled water and 1 μL of each solution was spotted on a nylon membrane. The membrane was then hybridized for 3.5 h at 55°C with 100 ng of digoxigenin-labeled AgMaT1 probe.
Immunolocalization
Antibodies were raised in rabbits against a peptide (CGLKNREAEEAKNA) chosen in the C-terminal-specific part of the protein to avoid cross-reaction with other mannitol transporters (AgMaT1). The antiserum was immunopurified against the peptide to increase the specificity of the response (Eurogentec). The specificity of the purified antibodies was confirmed on western blots (see “Results”).
Immunolabeling was conducted on semithin (0.5–1 μm) and thin (60–80 nm) sections from chemically fixed/LRW embedded fresh tissues (leaflet and petiole) of celery, and sections were processed as described by Fleurat-Lessard et al. (1997). The sections were incubated overnight in AgMaT2 antibodies (1/100 dilution) at room temperature. Controls were prepared by either omitting the antibodies or using the preimmune serum. Semithin sections were then processed as described by Vignault et al. (2005). The sections were incubated for 1 h in the Alexa Fluor 488-labeled secondary antibody (GAR-Alexa Fluor 488 A-11008 Interchim, 1/500 dilution). Observations were made under blue light (excitation: 495 nm; emission: 535 nm) using a Zeiss Axioplan microscope.
Immunogold reaction was performed on thin sections, using 15-nm gold particle-labeled goat anti-rabbit IgG (Biocell, 1/50 dilution). Samples were observed with a JEOL (1010) microscope operated at 80 kV.
For some experiments (Fig. 10), fresh hand sections were washed for 30 min in PBS-milk 2.5% (w/v), and incubated for 3 h in the AgMaT2 antiserum, washed for 30 min in PBS-milk 2.5% (w/v), and incubated for 1 h in Alexa Fluor 488-labeled secondary antibody (Wang et al., 1995). Observations were made under blue light (excitation: 495 nm; emission: 535 nm) using a Zeiss Axioplan microscope or Bio-Rad MRC 1024 confocal microscope.
Isolation of Plasma Membrane Vesicles
Plasma membrane vesicles were purified from yeast according to the protocol described by Stolz et al. (1994), whereas plasma membrane vesicles were extracted from leaves of celery using the method described by Salmon et al. (1995). Proteins from plasma membrane vesicles were separated by SDS-PAGE and probed with AgMaT2 antibodies as described by Gallet et al. (1992).
Sequence data from this article can be found in the GenBank/EMBL data libraries under accession number AAL85876.2.
Acknowledgments
We thank Dr. Pierrette Fleurat-Lessard for inestimable help and advice with EM technique, Mrs. Magali Lallemand for help during in situ hybridization experiments, Dr. Christina Kühn (Humboldt University, Berlin) and Dr. Sylvie Dinant (Laboratoire de Biologie Cellulaire, INRA Versailles, France) for helpful discussions, and Prof. Jean Louis Bonnemain for comments on EM pictures and critical reading of the manuscript. We are also grateful to Dr. Anne Cantereau (IBPC, Université de Poitiers, France) and Dr. Emile Béré (SIMIS, Université de Poitiers, France) for help with microscopic techniques. The support of the Région Poitou Charentes to M.J.-C. and of Vilmorin Clause and Cie to L.L.-A. during their Ph.D. theses is acknowledged.
The author responsible for distribution of materials integral to the findings presented in this article in accordance with the policy described in the Instructions for Authors (www.plantphysiol.org) is: Rémi Lemoine (remi.lemoine@univ-poitiers.fr).
Open Access articles can be viewed online without a subscription.
References
- Amiard V, Demming-Adams B, Mueh KE, Turgeon R, Combs AF, Adams WW III (2007) Role of light and jasmonic acid signaling in regulating foliar phloem cell wall ingrowth development. New Phytol 173 722–731 [DOI] [PubMed] [Google Scholar]
- Amiard V, Mueh KE, Demming-Adams B, Ebbert V, Turgeon R, Adams WW III (2005) Anatomical and photosynthetic acclimation to the light environment in species with differing mechanisms of phloem loading. Proc Natl Acad Sci USA 102 12968–12973 [DOI] [PMC free article] [PubMed] [Google Scholar]
- Atanassova R, Favet N, Martz F, Chabbert B, Tollier MT, Monties B, Legrand M, Fritig B (1995) Altered lignin composition in transgenic tobacco expressing O-methyltransferase sequences in sense and antisense orientation. Plant J 8 465–477 [Google Scholar]
- Barth I, Meyer S, Sauer N (2003) PmSUC3: characterization of a SUT2/SUC3-type sucrose transporter from Plantago major. Plant Cell 15 1375–1385 [DOI] [PMC free article] [PubMed] [Google Scholar]
- Carpaneto A, Geiger D, Bamberg E, Sauer N, Fromm J, Hedrich R (2005) Phloem-localized, proton-coupled sucrose carrier ZmSUT1 mediates sucrose efflux under the control of the sucrose gradient and the proton motive force. J Biol Chem 280 21437–21443 [DOI] [PubMed] [Google Scholar]
- Daie J (1986) Kinetics of sugar transport in isolated vascular bundles and phloem tissue of celery. J Am Soc Hortic Sci 111 216–220 [Google Scholar]
- Daie J (1988) Sucrose uptake in isolated phloem of celery is a single saturable transport system. Planta 171 474–482 [DOI] [PubMed] [Google Scholar]
- Davis JM, Loescher WM (1990) [14C]-Assimilate translocation in the light and dark in celery (Apium graveolens) leaves of different ages. Physiol Plant 79 656–662 [DOI] [PubMed] [Google Scholar]
- Delrot S, Bonnemain JL (1981) Involvement of protons as a substrate for the sucrose carrier during phloem loading in Vicia faba leaves. Plant Physiol 67 560–564 [DOI] [PMC free article] [PubMed] [Google Scholar]
- Dinant S, Clark AM, Zhu Y, Vilaine F, Palauqui JC, Kusiak C, Thompson GA (2003) Diversity of the superfamily of phloem lectins (phloem protein 2) in angiosperms. Plant Physiol 131 114–128 [DOI] [PMC free article] [PubMed] [Google Scholar]
- Esaü K (1936) Ontogeny and structure of collenchyma and of vascular tissues in celery petioles. Hilgardia 10 431–465 [Google Scholar]
- Everard JD, Cantini C, Grumet R, Plummer J, Loescher WH (1997) Molecular cloning of mannose-6-phosphate reductase and its developmental expression in celery. Plant Physiol 113 1427–1435 [DOI] [PMC free article] [PubMed] [Google Scholar]
- Fleurat-Lessard P, Bouche-Pillon S, Leloup C, Bonnemain JL (1997) Distribution and activity of the plasma membrane H+-ATPase in Mimosa pudica L. in relation to ionic fluxes and leaf movements. Plant Physiol 113 747–754 [DOI] [PMC free article] [PubMed] [Google Scholar]
- Flora LL, Madore MA (1993) Stachyose and mannitol transport in olive (Olea europea L.). Planta 189 484–490 [Google Scholar]
- Gallet O, Lemoine R, Gaillard C, Larsson C, Delrot S (1992) Selective inhibition of active uptake of sucrose into plasma membrane vesicles by polyclonal sera directed against a 42 kilodalton plasma membrane polypeptide. Plant Physiol 98 17–23 [DOI] [PMC free article] [PubMed] [Google Scholar]
- Gao Z, Maurousset L, Lemoine R, Yoo SD, van Nocker S, Loescher W (2003) Cloning, expression, and characterization of sorbitol transporters from developing sour cherry fruit and leaf sink tissues. Plant Physiol 131 1566–1575 [DOI] [PMC free article] [PubMed] [Google Scholar]
- Gottwald JR, Krysan PJ, Young JC, Evert RF, Sussman MR (2000) Genetic evidence for the in planta role of phloem-specific plasma membrane sucrose transporters. Proc Natl Acad Sci USA 97 13979–13984 [DOI] [PMC free article] [PubMed] [Google Scholar]
- Hafke JB, van Amerongen JK, Kelling F, Furch AC, Gaupels F, van Bel AJ (2005) Thermodynamic battle for photosynthate acquisition between sieve tubes and adjoining parenchyma in transport phloem. Plant Physiol 138 1527–1537 [DOI] [PMC free article] [PubMed] [Google Scholar]
- Haritatos E, Medville R, Turgeon R (2000) Minor vein structure and sugar transport in Arabidopsis thaliana. Planta 211 105–111 [DOI] [PubMed] [Google Scholar]
- Jennings DB, Daub ME, Pharr DM, Williamson JD (2002) Constitutive expression of a celery mannitol dehydrogenase in tobacco enhances resistance to the mannitol-secreting fungal pathogen Alternaria alternata. Plant J 32 41–49 [DOI] [PubMed] [Google Scholar]
- Jennings DB, Ehrenshaft M, Pharr DM, Williamson JD (1998) Roles for mannitol and mannitol dehydrogenase in active oxygen-mediated plant defense. Proc Natl Acad Sci USA 95 15129–15133 [DOI] [PMC free article] [PubMed] [Google Scholar]
- Karakas B, Ozias-Akins P, Stushnoff C, Suefferheld M, Rieger M (1997) Salinity and drought tolerance of mannitol-accumulating transgenic tobacco. Plant Cell Environ 20 609–616 [Google Scholar]
- Kay R, Chan A, Daly M, MacPherson J (1987) Duplication of CaMV 35S promoter sequences creates a strong enhancer for plant genes. Science 236 1299–1302 [DOI] [PubMed] [Google Scholar]
- Keller F, Matile P (1989) Storage of sugars and mannitol in petioles of celery leaves. New Phytol 113 291–299 [DOI] [PubMed] [Google Scholar]
- Klepek YS, Geiger D, Stadler R, Klebl F, Landouar-Arsivaud L, Lemoine R, Hedrich R, Sauer N (2005) Arabidopsis POLYOL TRANSPORTER5, a new member of the monosaccharide transporter-like superfamily, mediates H+-symport of numerous substrates, including myo-inositol, glycerol, and ribose. Plant Cell 17 204–218 [DOI] [PMC free article] [PubMed] [Google Scholar]
- Knop C, Stadler R, Sauer N, Lohaus G (2004) AmSUT1, a sucrose transporter in collection and transport phloem of the putative symplastic phloem loader Alonsoa meridionalis. Plant Physiol 134 204–214 [DOI] [PMC free article] [PubMed] [Google Scholar]
- Kühn C, Franceschi VR, Schulz A, Lemoine R, Frommer WB (1997) Macromolecular trafficking indicated by localization and turnover of sucrose transporters in enucleate sieve elements. Science 275 1298–1300 [DOI] [PubMed] [Google Scholar]
- Kühn C, Quick WP, Schulz A, Riesmeier JW, Sonnewald U, Frommer WB (1996) Companion cell-specific inhibition of the potato sucrose transporter SUT 1. Plant Cell Environ 19 1115–1123 [Google Scholar]
- Leggewie G, Kolbe A, Lemoine R, Roessner U, Lytovchenko A, Zuther E, Kehr J, Frommer WB, Riesmeier JW, Willmitzer L, et al (2003) Overexpression of the sucrose transporter SoSUT1 in potato results in alterations in leaf carbon partitioning and in tuber metabolism but has little impact on tuber morphology. Planta 217 158–167 [DOI] [PubMed] [Google Scholar]
- Lemoine R (2000) Sucrose transporter in plants: some insights into their structure. Biochim Biophys Acta 1465 246–262 [DOI] [PubMed] [Google Scholar]
- Leterrier M, Atanassova R, Laquitaine L, Gaillard C, Coutos-Thevenot P, Delrot S (2003) Expression of a putative grapevine hexose transporter in tobacco alters morphogenesis and assimilate partitioning. J Exp Bot 54 1193–1204 [DOI] [PubMed] [Google Scholar]
- Meyer S, Lauterbach C, Niedermeier M, Barth I, Sjolund RD, Sauer N (2004) Wounding enhances expression of AtSUC3, a sucrose transporter from Arabidopsis sieve elements and sink tissues. Plant Physiol 134 684–693 [DOI] [PMC free article] [PubMed] [Google Scholar]
- Moing A (2000) Sugar alcohols as carbohydrate reserves in higher plants. In AK Gupta, N Kaur, eds, Carbohydrate Reserves in Plants Synthesis and Regulation. Elsevier Sciences B.V., Amsterdam, pp 337–358
- Noiraud N, Delrot S, Lemoine R (2000) The sucrose transporter of celery. Identification and expression during salt stress. Plant Physiol 122 1447–1455 [DOI] [PMC free article] [PubMed] [Google Scholar]
- Noiraud N, Maurousset L, Lemoine R (2001. a) Identification of a mannitol transporter, AgMaT1, in celery phloem. Plant Cell 13 695–705 [DOI] [PMC free article] [PubMed] [Google Scholar]
- Noiraud N, Maurousset L, Lemoine R (2001. b) Transport of polyols in higher plants. Plant Physiol Biochem 39 717–728 [Google Scholar]
- Page RDM (1996) TREEVIEW: an application to display phylogenetic trees on personal computers. Comput Appl Biosci 12 357–358 [DOI] [PubMed] [Google Scholar]
- Ramsperger-Gleixner M, Geiger D, Hedrich R, Sauer N (2004) Differential expression of sucrose transporter and polyol transporter genes during maturation of common plantain companion cells. Plant Physiol 134 147–160 [DOI] [PMC free article] [PubMed] [Google Scholar]
- Reinders A, Panshyshyn JA, Ward JM (2005) Analysis transport activity of Arabidopsis sugar alcohol permease homolog AtPLT5. J Biol Chem 280 1594–1602 [DOI] [PubMed] [Google Scholar]
- Reinders A, Schulze W, Kühn C, Barker L, Schulz A, Ward JM, Frommer WB (2002) Protein-protein interactions between sucrose transporters of different affinities colocalized in the same enucleate sieve element. Plant Cell 14 1567–1577 [DOI] [PMC free article] [PubMed] [Google Scholar]
- Riesmeier JW, Willmitzer L, Frommer WB (1994) Evidence for an essential role of the sucrose transporter in phloem loading and assimilate partitioning. EMBO J 13 1–7 [DOI] [PMC free article] [PubMed] [Google Scholar]
- Rosche E, Blackmore D, Tegeder M, Richardson T, Schroeder H, Higgins TJ, Frommer WB, Offler CE, Patrick JW (2002) Seed-specific overexpression of a potato sucrose transporter increases sucrose uptake and growth rates of developing pea cotyledons. Plant J 30 165–175 [DOI] [PubMed] [Google Scholar]
- Salmon S, Lemoine R, Jamaï A, Bouché-Pillon S, Fromont JC (1995) Study of sucrose and mannitol transport in plasma membrane vesicles from phloem and non-phloem tissue of celery (Apium graveolens L.) petioles. Planta 197 76–83 [Google Scholar]
- Stolz J, Ludwig A, Stadler R, Biesgen C, Hagemann K, Sauer N (1999) Structural analysis of a plant sucrose carrier using monoclonal antibodies and bacteriophage lambda surface display. FEBS Lett 453 375–379 [DOI] [PubMed] [Google Scholar]
- Stolz J, Stadler R, Opekarova M, Sauer N (1994) Functional reconstitution of the solubilized Arabidopsis thaliana STP1 monosaccharide-H+ symporter in lipid vesicles and purification of the histidine tagged protein from transgenic Saccharomyces cerevisiae. Plant J 6 225–233 [DOI] [PubMed] [Google Scholar]
- Stoop JMH, Williamson JD, Pharr DM (1996) Mannitol metabolism in plants: a method for coping with stress. Trends Plant Sci 1 139–144 [Google Scholar]
- Tarczynski MC, Jensen RG, Bohnert HJ (1993) Stress protection of transgenic tobacco by production of the osmolyte mannitol. Science 259 508–510 [DOI] [PubMed] [Google Scholar]
- Thompson JD, Gibson TJ, Plewniak F, Jeanmougin F, Higgins DG (1997) The CLUSTAL_X windows interface: flexible strategies for multiple sequence alignment aided by quality analysis tools. Nucleic Acids Res 25 4876–4882 [DOI] [PMC free article] [PubMed] [Google Scholar]
- Truernit E, Sauer N (1995) The promoter of the Arabidopsis thaliana SUC2 sucrose-H+ symporter gene directs expression of beta-glucuronidase to the phloem: evidence for phloem loading and unloading by SUC2. Planta 196 564–570 [DOI] [PubMed] [Google Scholar]
- van Bel AJE (1996) Interaction between sieve element and companion cell and the consequences for photoassimilate distribution. Two structural hardware frames with associated physiological software packages in dicotyledons? J Exp Bot 47 1129–1140 [DOI] [PubMed] [Google Scholar]
- Vignault C, Vachaud M, Cakir B, Glissant D, Dédaldéchamp F, Büttner M, Atanassova R, Fleurat-Lessard P, Lemoine R, Delrot S (2005) VvHT1 encodes a monosaccharide transporter expressed in the conducting complex of the grape berry phloem. J Exp Bot 56 1409–1418 [DOI] [PubMed] [Google Scholar]
- Vilaine F, Palauqui JC, Amselem J, Kusiak C, Lemoine R, Dinant S (2003) Towards deciphering phloem: a transcriptome analysis of the phloem of Apium graveolens. Plant J 36 67–81 [DOI] [PubMed] [Google Scholar]
- Wang Q, Monroe J, Sjolund RD (1995) Identification and characterization of a phloem-specific beta-amylase. Plant Physiol 109 743–750 [DOI] [PMC free article] [PubMed] [Google Scholar]
- Watari J, Kobae Y, Yamaki S, Yamada K, Toyofuku K, Tabuchi T, Shiratake K (2004) Identification of sorbitol transporters expressed in the phloem of apple source leaves. Plant Cell Physiol 45 1032–1041 [DOI] [PubMed] [Google Scholar]
- Williams LE, Lemoine R, Sauer N (2000) Sugar transporters in higher plants—a diversity of roles and complex regulation. Trends Plant Sci 5 283–290 [DOI] [PubMed] [Google Scholar]
- Williamson JD, Stoop JM, Massel MO, Conkling MA, Pharr DM (1995) Sequence analysis of a mannitol dehydrogenase cDNA from plants reveals a function for the pathogenesis-related protein ELI3. Proc Natl Acad Sci USA 92 7148–7152 [DOI] [PMC free article] [PubMed] [Google Scholar]
- Yamamoto YT, Zamski E, Williamson JD, Conkling MA, Pharr DM (1997) Subcellular localisation of celery mannitol dehydrogenase. A cytosolic metabolic enzyme in nuclei. Plant Physiol 115 1397–1403 [DOI] [PMC free article] [PubMed] [Google Scholar]


