

Abstract
This study examined the effect of glucose ingestion on cardiac autonomic function in non-obese women and obese women with and without type 2 diabetes. Heart rate variability (HRV) was measured via continuous ECG and beat-by-beat blood pressure was recorded with finger photoplethysmography (Portapress) in a fasted state and in response to a 75 g glucose load in 42 middle-aged women (40–60 yr). Upright tilt was also utilized as an orthostatic stress to provide a clinically relevant challenge to the cardiovascular system. Significant main effects for log transformed (Ln) total power (TP, msec2) were observed with upright tilt (P<0.01) and glucose challenge (P<0.05). LnTP decreased in all groups in both the fasted and fed state with upright tilt (P<0.01), but glucose ingestion resulted in higher LnTP in the supine position only (P=0.008). Tilt resulted in a significant main effect for low frequency (LFnu, normalized units) and high frequency (Hfnu) power (P<0.000), while the glucose challenge had no effect on LFnu or HFnu power. LFnu approached significance for group differences (P=0.07), such that the non-obese had lower LF power than either of the obese groups. Sympathovagal balance (LnLF/HF ratio) was affected by position (P<0.000) and group (P<0.05), with a lower LnLF/HF in the non-obese than in the obese women. Baroreceptor sensitivity decreased (P<0.01) during upright tilt but was not changed by the glucose challenge. In conclusion, basal sympathovagal balance is higher in obese individuals with and without type 2 diabetes. Women with type 2 diabetes showed no differences in autonomic function with an orthostatic challenge or glucose load than non-diabetic, obese women. The glucose load did alter total spectral power in all of these middle-aged women, but had no impact on baroreceptor sensitivity.
Introduction
Heart rate and blood pressure are carefully regulated by the autonomic nervous system (ANS). Dysfunction of the autonomic system (e.g. increased sympathetic and decreased parasympathetic activity) are related to increased mortality (1, 2), and this dysfunction has been reported in obese individuals (3–6). Additionally, perturbations to the ANS occur with both changes in body position and with food ingestion (7). In particular, carbohydrate ingestion, but not fat or protein ingestion, increases sympathetic nerve activity (8, 9), while fasting has an opposite effect (9).
The alterations observed in ANS activity following carbohydrate ingestion are associated with hyperinsulinemia (10). In healthy, non-obese individuals, physiological hyperinsulinemia causes acute desensitization of sinus node activity, producing a shift in autonomic balance towards increased sympathetic modulation (4). Rowe et al. (11) has demonstrated that acute euglycemic hyperinsulinemia causes a dose-dependent increase in circulating norepinephrine levels in healthy volunteers; while others (12) have demonstrated no change in sympathetic nervous system activity.
Obesity is usually associated with increased sympathetic activity (2, 13, 14), which is probably related to insulin resistance, but may also be due to the elevated circulating insulin levels in these individuals. As many obese individuals are in a state of chronic hyperinsulinemia (4), the alterations in sympathetic activity are believed to be chronic. Healthy non-obese subjects show reductions in total spectral power of heart rate variability (HRV) and an increased low frequency/high frequency (LF/HF) ratio during an insulin infusion, while these changes do not occur in insulin resistant individuals (15). We speculate that although obese individuals with insulin resistance have sympathetic hyperactivity at rest, they respond with reduced sympathoexcitation to an acute increase of insulin levels. Chronic hyperinsulinemia may prevent enhancement of cardiac sympathetic tone during an acute rise in insulin levels possibly due to an attenuated baroreflex response (15).
Although acute euglycemic hyperinsulinemia alters the HRV response in healthy individuals (3, 4), little research on autonomic function has been conducted in the obese population during an acute glucose load and a physiologic challenge (15, 16) and no information is available on obese individuals with type 2 diabetes. Quantifying the ANS response to a physiologic challenge can provide important information on autonomic dysfunction not evident at rest (17); such information is important to elucidate the autonomic response to common everyday challenges in these populations.
The primary purpose of this study was to establish the effect of a glucose load on autonomic function in non-obese, obese women and obese women with type 2 diabetes. We also utilized upright tilt as an orthostatic stress, which provides a clinically relevant challenge to the cardiovascular system (18). We hypothesized that the obese women with and without type 2 diabetes would have reduced HRV and greater sympathetic activation at rest, but an attenuated response to tilt and to the glucose challenge compared to the non-obese women. Furthermore, we hypothesized that the obese women with type 2 diabetes would have greater autonomic dysfunction than the obese women without type 2 diabetes.
Methods
Subjects
Forty-two healthy women volunteered for the present study. Subjects were classified into three groups based on their body mass index (BMI) and metabolic status: non-obese (BMI ≤ 24 kg/m2 , (n=9), fasting glucose < 100 mg/dL), obese (BMI ≥ 30 kg/m2, (n=22), fasting glucose < 100 mg/dL), obese, type 2 diabetic (BMI ≥ 30 kg/m2, (n=11), fasting glucose ≥ 126 mg/dL, and 2 hour OGTT glucose ≥ 200 mg/dL). All subjects were physically inactive and had not been involved in any regular exercise during the past 6 months. Diabetic subjects did not have peripheral neuropathy. Subjects were nonsmokers and had no signs or history of overt heart disease, verified by a physician supervised maximal exercise stress test. Both pre- and post-menopausal were included, but subjects were excluded if they reported missed menstrual periods. Post–menopausal women on hormone replacement therapy (n=5) were included. Premenopausal women were studied in the first 10 days of their menstrual cycle. Subjects could not be taking beta-blockers or any medication that could alter their HR or BP responses. The list of medications is presented in Table 1. The Institutional Review Boards at Syracuse University and SUNY Upstate Medical University approved the protocol. Written informed consent was obtained from all subjects.
Table 1.
List of medications the subjects were taking during the study.
| Obese, Type 2 diabetic
(n=9) |
Obese, Non-diabetic
(n=22) |
Non-obese
(n=11) |
|
|---|---|---|---|
|
Glucose lowering drugs
Metformin Sulfonylurea Other |
7 0 3 |
0 0 0 |
0 0 0 |
|
Lipid lowering drugs
Statin Fibrate Other |
1 1 1 |
4 0 0 |
0 0 0 |
|
Antihypertensives
HCTZ ACE-I Valsartan |
1 4 0 |
1 0 2 |
0 1 1 |
| Hormone replacement | 0 | 3 | 2 |
| therapy | |||
| Antidepressants | 6 | 4 | 2 |
| Other drugs | 9 | 7 | 2 |
| No medications | 0 | 8 | 5 |
Experimental design
Subjects came to our lab on two occasions. Initially the subjects had an exercise stress test that was used to determine cardiovascular fitness and to screen for heart disease. On the second visit, the subject came to the lab at 0700 h following a 12-hour overnight fast. Autonomic function was measured at rest and during upright tilt, and before and during an oral glucose tolerance test (OGTT). A venous catheter was inserted into an anticubital vein and kept patent with normal saline. This was followed by 30 minutes of rest in a supine position. HRV was measured for the final 10 minutes in the supine position and 5 minutes in the upright tilt position. Upon completion of the upright tilt in the fasted state, the OGTT was initiated and blood samples were drawn for 4 h. Thirty min following the glucose ingestion, the time period during which blood glucose peaked, the non-diabetic and obese subjects repeated the upright tilt. Based on previous studies (19, 20), we repeated the autonomic function testing 1 h post glucose ingestion in the women with type 2 diabetes, as we have found the peak glucose levels occur at this time in this population. The subjects then rested quietly for the remainder of the study day. Anthropometric measures were obtained during this quiet period.
Anthropometric testing
Height and weight were taken and body mass index was calculated. Percent body fat was measured using the Bod Pod (Life Measurements Inc., Concord, CA), according to the guidelines established by the manufacturer.
Oral glucose tolerance test
Upon completion of the fasting measures of autonomic function, subjects were given 75 g of glucose to be consumed in less than 5 minutes (NERL Diagnostics, East Providence, RI). Blood samples were drawn prior to and every half hour for 4 h during the OGTT. During the second autonomic function testing, which occurred either at 30 min or 1 h post glucose ingestion, blood samples were taken every 10 min to establish the peak glucose levels
Upright Tilt Test
Subjects were supine on the tilt table for 20 min prior to any measurements. Heart rate and hemodynamic data were measured during 5 min of quiet rest with spontaneous breathing, 5 min of paced breathing (12 breaths/min), 5 min of 80° head-up tilt with paced breathing. Subjects were instructed not to move their hands or feet throughout the testing. This same procedure was repeated in the glucose challenged state.
Autonomic Measurements
We continuously recorded electrocardiographic R-R intervals via a modified CM5 lead interfaced with a digital acquisition system (Biopac Santa Barbara, CA). Data were sampled at 1000 Hz and saved to a personal computer for off-line analysis. Also, beat-by-beat finger plethysmographic arterial pressure (Portapres, TNO Biomedical Instrumentation, Amsterdam, The Netherlands) was collected at a sampling rate of 100 Hz. The subject’s arm with the cuffed finger was placed in a sling with the hand at heart level. Electrocardiographic R-R intervals and beat-by-beat arterial pressure were measured in the supine position at rest and during tilt before and during an oral glucose tolerance test. The breathing pace was set at 12 breaths/min (0.2 Hz) and was set by a metronome.
Data Analysis
Heart Rate Variability
Heart rate variability analysis was conducted using Heart Signal software (Oulu, Finland) and data were analyzed in 5 min epochs. The ECG signal was filtered via visual and automatic editing and only periods with no ectopic beats were analyzed. After filtering, only data with fewer than 2% of beats removed were included in the HRV analysis. The filtering and analysis of the R–R intervals were conducted according to procedures described by Huikuri (21).
The total area under the curve was taken as the overall variability – total power (TP) – and was obtained by integrating the spectral band from 0.004 to 0.400 Hz. Using an autoregressive model (fixed model order of 10) (22), the power spectra were divided into bands of 0.040–0.150 Hz as low frequency (LF) and 0.150–0.400 Hz as the high frequency (HF) band (23). The very low frequency (VLF) power was obtained for the region below 0.040 Hz and was subtracted from the total power when the data were normalized. Sympathetic modulation of the heart has been associated with the LF spontaneous oscillations of the spectral period (24), whereas the HF component has been shown to be primarily influenced by the efferent vagal activity (6). As an indirect measure of sympathovagal balance the LF/HF ratio has been used. HF and LF power spectral densities were calculated in both absolute and normalized units (normalized to total spectral power), as suggested by the task force (23).
Analysis of beat-by-beat arterial pressure
R-R intervals and systolic blood pressure derived from the finger arterial pressure waveform were used to determine the coupling between fluctuations in heart rate and systolic blood pressure (arterial baroreflex sensitivity – BRS). BRS was determined via time domain (sequence technique) and frequency domain analyses using the WinCPRS software (Absolute Aliens Oy, Turku, Finland).
Time Domain Analysis – We estimated BRS using the sequence technique, (WinCPRS software), which searchs for runs of 3 or more consecutive beats characterized by a progressive increase or a decrease in SBP of at least 1 mmHg. Baroreflex sequences were selected from the changes in SBP if R-R intervals concurrently changed in the same direction with SBP for 3 or more consecutive beats for at least 4 msec. Sequences of increasing SBP and R-R intervals were defined as “up sequences” (UP/UP), whereas decreasing SBP and R-R intervals were defined as “down sequences” (DN/DN). Baroreflex sensitivity was calculated as the slope of the regression line between SBP and R-R intervals. Only sequences with correlations equal or greater than 0.80 were accepted.
Frequency Domain Analysis – We calculated the squared coherence for the R-R interval and arterial pressure signals derived from the finger arterial pressure waveform dividing the cross-spectral densities of systolic pressure and R-R interval by the product of the individual spectral densities. The mean value of the square root of the ratio of the spectral powers of RRI and SBP was calculated when squared coherence was greater than 0.5. We considered only those frequency components in the LF range (αLF). Finally, we calculated the cross-spectral transfer function at LF ranges (LFgain) by dividing the cross spectra of the two signals by the power spectrum of systolic pressure. Both αLF and LFgain were used as indices of baroreflex gain.
Blood analyses
Plasma glucose concentrations were determined using the glucose oxidase method with the YSI 2300 Stat (Yellow Springs Instruments, Inc., Yellow Springs, OH). Blood samples for insulin were placed in EDTA tubes, centrifuged (2300 rpm), aliquotted, and stored at −80°C for later analysis. All samples for one subject were analyzed in the same assay and commercially available radioimmunoassay kits were used (Diagnostic Products Corp., Los Angeles, CA). The intra- and inter assay CV for the insulin assays were 7.6% and 8.9%, respectively. Hemoglobin A1C was determined with kits from Diabetes Technologies Inc. (Thomasville, GA). Insulin sensitivity was calculated using the Mari equation (25).
Statistical Analysis
A one-way analysis of variance (ANOVA) for differences in descriptive characteristics between the non-obese group, the obese group, and obese group with type 2 diabetes was conducted. All data is expressed as mean ± SE. Significance was set at an alpha = 0.05.
By creating a histogram of the data, normal distribution of the data was checked and skewness was calculated. Natural log transformation (Ln) was used if the data were not normally distributed. The data were analyzed using a 3-way analysis of variance (ANOVA) with repeated measures (3 (groups) x 2 (supine, tilt) x 2 (fasted, glucose challenge)). If significant interactions were found, we followed up with post hoc analyses using the Tukey test and applied Bonferroni corrections to the post hoc analyses. A correlation analysis was conducted to determine if there was an association between glucose and insulin levels and HRV. We assumed significance with alpha =0.05, and used 2-tailed statistical analyses so that results in either direction could be interpreted.
Results
The subject characteristics are presented in Table 2. As expected, the BMI was higher in both of the obese groups but there was no difference in BMI between the obese with and without type 2 diabetes. No group differences were found for age and HbA1c, but we found significantly higher percent body fat and lower aerobic fitness (P<0.01) in the obese women than in the non-obese women. Fasting glucose levels and glucose area under the curve were higher in the women with type 2 diabetes than either group of non-diabetic women (P<0.01). Fasting insulin concentrations were higher in the women with type 2 diabetes than the non-obese women (P<0.01). As expected, insulin sensitivity was higher (P<0.01) in the non-obese than in either of the obese groups.
Table 2.
The physical characteristics of the subjects by group.
| Obese, Type 2 diabetic (n=9) | Obese, Non-diabetic (n=22) | Non-obese (n=11) | |
|---|---|---|---|
| Age (yr) | 49.7 ± 1.8 | 48.7 ± 1.1 | 48.2 ± 1.6 |
| Height (cm) | 160.3 ± 1.8 | 164.8 ± 1.2 | 164.2 ± 1.7 |
| Weight (kg) | 89.4 ± 3.9 | 98.3 ± 2.5 | 61.0 ± 3.6* |
| BMI (kg/m2) | 34.8 ± 1.4 | 36.8 ± 0.8 | 22.6 ± 1.2* |
| % fat | 43.5 ± 1.6 | 46.5 ± 1.0 | 32.4 ± 1.4* |
| VO2 (ml/kg LBM/min) | 39.2 ± 1.4 | 40.8 ± 3.7 | 45.1 ± 5.5* |
| HbA1c (%) | 6.9 ± 0.3 | 6.1 ± 0.3 | 5.4 ± 0.1 |
| Waist circumference (cm) | 111.9 ± 3.6 | 107 ±2.3 | 79.1 ± 3.2* |
| Fasting glucose (mmol/L) | 7.5 ± 1.8** | 5.1 ± 0.2 | 4.7 ± 0.4 |
| Glucose area under the curve (min*mmol/L) | 2653 ± 137.7** | 1387 ± 38.8 | 1297 ±63.1 |
| Fasting insulin (pmol/L) | 18.7 ± 4.3 | 11.1 ± 3.0 | 3.25 ± 1.8† |
| Peak insulin concentrations (pmol/L) | 66.1 ± 14.9 | 83.8 ± 10.7 | 51.5 ± 14.1 |
| Insulin sensitivity | 4.5 ± 2.5 | 6.1 ± 1.9 | 19.6 ± 2.5* |
P<0.01 non-obese vs. obese and type 2 diabetic;
P<0.01 type 2 diabetic vs. non-obese and obese;
P<0.01 non-obese vs. type 2 diabetic; mean±SE
Heart Rate Variability
Resting heart rate was similar between the non-obese and obese women with and without type 2 diabetes. Mean resting HR was 68.7±2.1 b/min in all groups, and the subjects responded with an increase in HR (82.6±2.9 b/min) with upright tilt (P<0.05). There was no significant change in the mean supine or tilt HR in response to the glucose challenge.
Figure 1 shows the HRV data expressed in msec2 and normalized units, and log transformed if necessary. When all groups were pooled together, total power (msec2, Figure 1A) significantly decreased from the supine to upright position during fasting (P<0.01) and glucose challenge (P<0.05). Both of the main effects remained when total power was log transformed (P<0.01 and P<0.05, respectively, Figure 1B). There was an interaction between glucose challenge and position (P<0.000). With upright tilt, there was a decrease in LnTP in all groups in both the fasted and fed state. Glucose ingestion, however resulted in a significantly higher LnTP in the supine position (P=0.008) when compared to the fasted condition, but this was not significant in the tilted state. There was no significant difference between the three groups for LnTP.
Figure 1.
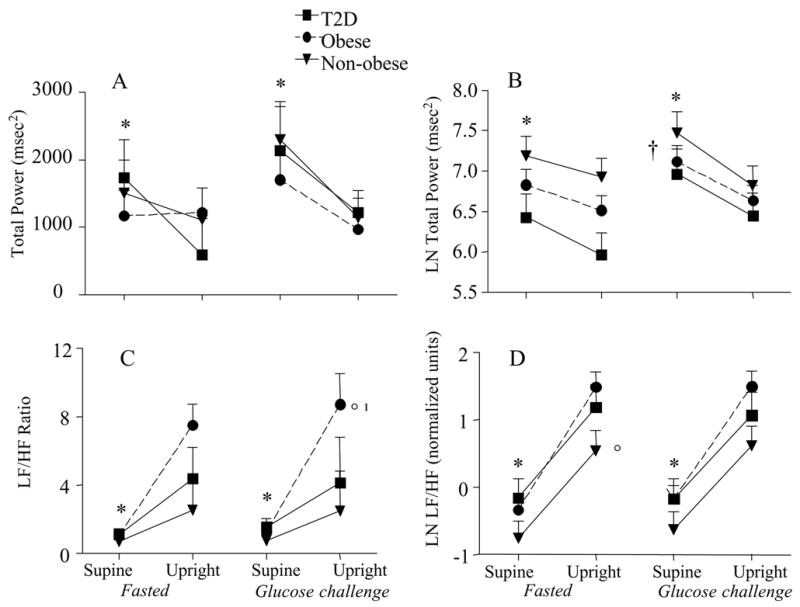
Total power and the LF/HF ratio for each group in the supine position and in response to tilt. The data is also presented in the fasted and glucose challenged condition. The left panel represents the raw data and the right panel is the natural log. mean±SE, *P<0.01supine vs. upright; ¹P<0.05 tilt by group interaction; °P<0.05 between groups; †P<0.000 interaction between glucose challenge and position
LF power (msec2) was altered with the glucose challenge (P<0.05) but only approached significance for upright tilt (P=0.065, Figure 2a). High frequency (HF) power (msec2) declined with upright tilt (P<0.000) during both fasting and the glucose challenge (Figure 2C). The glucose challenge (P<0.05) resulted in a higher HF in the supine position than was seen in the fasted state. Both HFnu and LFnu data revealed a significant change from the supine to the upright position (P<0.000, Figure 2B and D). LFnu approached significance for group differences (P=0.07), such that the non-obese had lower LF power than either of the obese groups (Figure 2B). The glucose challenge had no effect on the LFnu or HFnu response to tilt. Sympathovagal balance (LF/HF ratio) exhibited a significant main effect for tilt (P<0.000), a tilt by group interaction (P<0.05) and a significant group effect (P<0.05; Figure 1c). Normalizing and log transforming the LF/HF ratio resulted in a significant effect with upright tilt (P<0.000), and group effect (P<0.05), such that there was a lower LnLF/HF (nu) in the non-obese than in the obese women (Figure 2d). There were no differences between the obese women with and without type 2 diabetes in LnLF/HF (nu).
Figure 2.
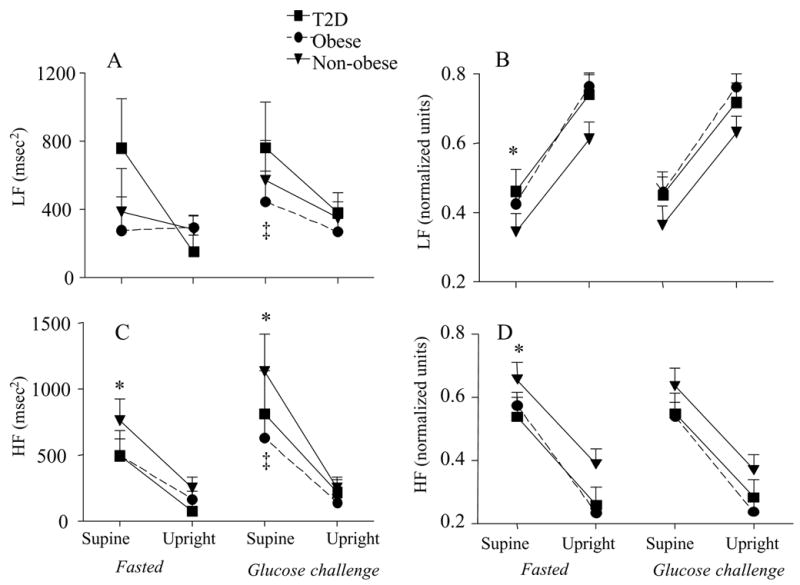
High frequency (HF) and low frequency (LF) power for each group in the supine position and in response to tilt. The data is also presented in the fasted and glucose challenged condition. The left panel represents the raw data and the right panel is the normalized units. mean±SE, *P<0.01supine vs. upright; ‡P<0.01fasted vs. glucose challenge
Blood pressure variability and Baroreflex sensitivity
There was a significant change in LFnu of blood pressure variability (BPV) with upright tilt (P<0.001; Figure 3C). There was no group effect or glucose challenge effect on BPV. Baroreflex sensitivity (BRS) significantly decreased during upright tilt but was not changed with the glucose challenge (Fig 3A and B). The gain of the baroreflex mechanism (α) was not found to be different between groups, nor with the glucose challenge or with the upright tilt (data not shown).
Figure 3.
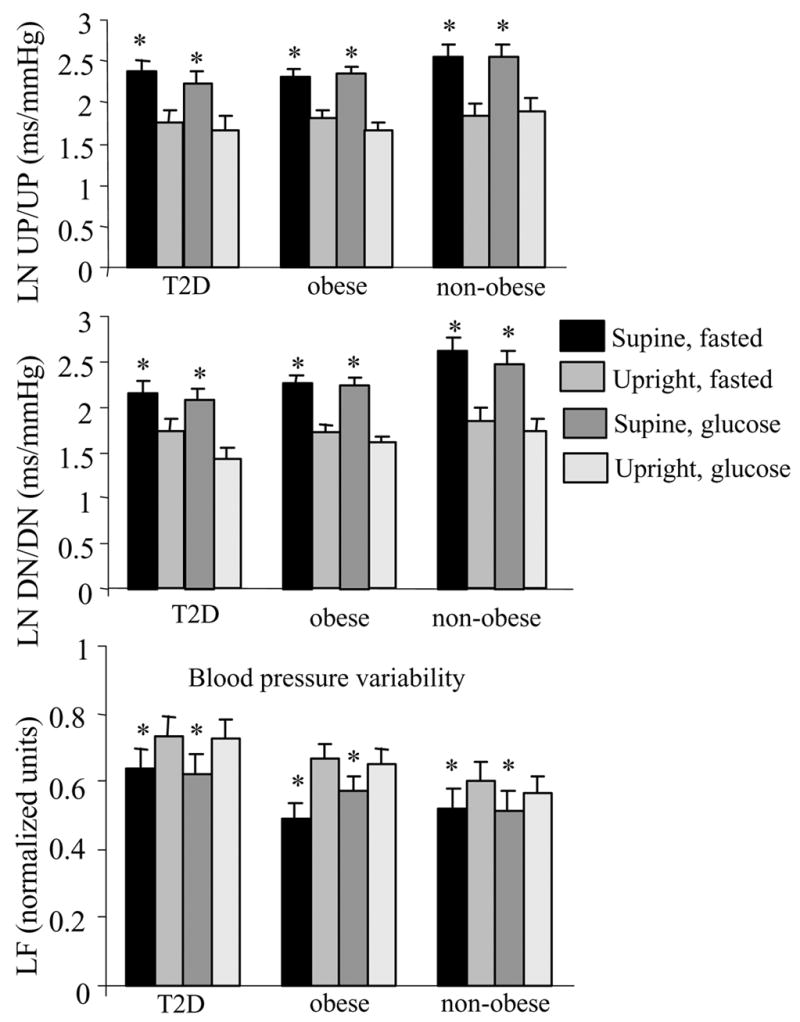
Spontaneous baroreflex sequences expressed as natural logarithms (LN) for each group. Sequences of concurrent increases in SBP and R-R intervals were defined as “up sequences” (UP/UP), whereas sequences of concurrent decreases in SBP and R-R intervals were defined as “down sequences” (DN/DN). UP/UP and DN/DN were calculated as the slopes of the regression lines between SBP and R-R intervals. The lower panel represents the LF data for blood pressure variability for each group and each condition. mean±SE, *P<0.01supine vs. upright
Correlation analysis
A significant negative correlation was found between the log of the blood glucose concentration at time 0 and LnTP in the supine position (r = −0.37, P<0.05). No correlations were found between peak glucose or insulin concentrations, or insulin or glucose AUC with the glucose feeding and any measure of HRV.
Discussion
Both obesity and hyperinsulinemia (4, 6, 25, 26) have been shown to cause alterations in HRV, however, the potential additive effects are unknown and differences between obese women with and without type 2 diabetes are not clear. Consistent with earlier findings (4), we observed that sympathovagal balance (Ln LF/HF) is higher in obese women than in non-obese women, but there was no difference between the obese women with and without type 2 diabetes. Upright tilt caused increased sympathetic and decreased parasympathetic modulation in all groups. The glucose load resulted in a higher total power in the supine position but not in the upright position regardless of the metabolic status of these women. There was a negative association between glucose levels and fasting TP.
Glucose challenge
Obesity is characterized by insulin resistance and compensatory hyperinsulinemia which increases the risk of cardiovascular morbidity (27). It has been postulated that the enhanced sympathetic nervous activity in obese subjects is related to chronic hyperinsulinemia (4, 28). Muscelli et al. (4) has suggested that physiological hyperinsulinemia causes acute desensitization of sinus node activity and that the autonomic balance is shifted toward sympathetic modulation. Our data support this finding as the non-obese women had ~ 22% lower LnLF/HF ratio in the supine position in both the fasted or glucose challenged state. There was a trend in non-obese women for a higher TP and a higher parasympathetic modulation, which supports previous reports (4, 29). These findings are consistent with an HRV profile associated with higher cardiovascular risk in the obese women, both with and without type 2 diabetes.
Glucose feeding had no substantial effect on HRV in any of the groups. Our findings differ slightly from those of Paolisso and colleagues (15) who noted a decrease in TP with insulin infusion and an increase in LF in healthy individuals but not in insulin resistant individuals. They noted that insulin failed to stimulate cardiac ANS in insulin resistant patients, independent of the cause of insulin resistance (15). Although others (3, 4) have indicated that hyperinsulinemia may cause the sympathetic overactivity in obese women, our data, as well as others (12), do not support this. In response to the glucose ingestion, the highest insulin levels were found in the obese women, followed by the women with type 2 diabetes and the non-obese women, yet the glucose challenge did not change indicators of sympathovagal balance in any of the groups regardless of position (Figure 1). Only TP changed with the glucose ingestion (~25% increase), which was a somewhat unexpected finding, and not consistent with an increased sympathetic state. The increased glucose concentrations were not associated with HRV after glucose ingestion, suggesting that when administered a physiologic glucose load, other counterregulatory influences prevent autonomic dysfunction.
Our findings also contrast a recent report (16) which demonstrated that both the sympathetic and parasympathetic nervous system were stimulated by a glucose challenge in obese subjects. Class III obesity (BMI>40 kg/m2) was associated with a blunted increase in the sympathetic response to the glucose load, even though they had a larger increase in plasma insulin levels. Likewise others (30) have reported that basal LF/HF was significantly correlated with body fat content and distribution. It is possible that because our obese subjects had similar body fat content (~44% body fat), we did not observe differences in LF/HF nu between the non-diabetic and diabetic obese women.
There are several possible reasons for the differential findings between these studies. Some of the previous research reporting disturbances in HRV with hyperinsulinemia (3, 4, 30) used healthy volunteers who did not have underlying insulin resistance. These subjects would normally not be exposed to the insulin levels administered during the hyperinsulinemic clamp and would be expected to have greater insulin sensitivity than obese women or type 2 diabetics. The oral glucose tolerance test used in the present work is more physiologically relevant. This 75 g of glucose is comparable to drinking ~22oz. of soda. In humans, hyperinsulinemia per se may be the main mechanism that triggers sympathetic activation and not the insulin-induced stimulation of CHO metabolism (16, 31).
Comparing individuals with various degrees of obesity, Quilliot et al. (16) observed an increased LF power in BPV in all subjects, indicating that a physiological meal stimulates sympathetic modulation in the peripheral arteries. In contrast we found no change in the BPV with glucose ingestion. Insulin is also known to have a vasodilator effect that could stimulate the baroreflex to contribute to sympathetic activation (16), but in our study, glucose ingestion did not affect BRS. Using healthy subjects, Laitinen, et al. (18) found that counter regulation during hyperinsulininemic hypoglycaemia does not influence cardiac parasympathetic regulation or baroreflex control of heart rate. During euglycemic hyperinsulinemia, they found no change in HRV, BPV, HR or BP and a similar BRS (18), which is in agreement with our findings that hyperglycemia had no impact on these variables.
Insulin resistance and elevated FFA concentrations are thought to lead to the autonomic imbalance seen in individuals with type 2 diabetes. We had initially hypothesized there would be a greater disturbance in the autonomic function in the women with type 2 diabetes than in the obese women, however, contrary to our hypothesis the women with type 2 diabetes exhibited similar responses to our obese non-diabetic women. This finding is consistent with a recent report by Manzella et al. (32) who demonstrated that metformin treatment might improve cardiac sympathovagal balance in this population by lowering FFA levels and improving insulin resistance. Our data are consistent with their findings as 7 of 9 women with type 2 diabetes were taking metformin, had excellent metabolic control and had HRV responses that were not different than observed in the non-obese and obese women. Furthermore, the response to upright tilt in our study was not aligned with an earlier study that reported decreased HF power was a function of the severity of the neuropathy (29). In response to tilt, Tanikawa et al. noted LF/HF increased significantly in the controls and in the patients with the least amount of neuropathy but was unchanged in those with more severe neuropathy. We observed little difference between type 2 diabetics and obese non-diabetics in response to tilt possibly because overall the women in our study had well-controlled blood glucose concentrations. As part of our screening criteria, we also excluded women who had known peripheral neuropathy. However, it is important to interpret our findings with caution, since Eckberg et al. (33) suggested that sympathetic and parasympathetic modulations do not change in a reciprocal manner, thus, the concept of sympathovagal balance may not be valid. Conversely, several others have shown that sympathovagal balance is a valid concept and adequately represented by the LF/HF ratio (15, 34–36).
In conclusion this study supports earlier work that basal sympathovagal balance is altered in obese individuals with and without type 2 diabetes compared to non-obese women. In contrast to a previous report (15) in which insulin infusion reduced the total spectra power and increased the LF/HF ratio in healthy subjects but not in insulin-resistant subjects, our findings demonstrate that there were no differences in cardiac autonomic regulation during a physiologic glucose load between healthy non-obese women, and obese women with and without well-controlled type 2 diabetes. The glucose load, however, did increase total spectral power in all of these middle-aged women.
Acknowledgments
This was supported in part by NIH grant R21 DK063179.
Footnotes
Publisher's Disclaimer: This is a PDF file of an unedited manuscript that has been accepted for publication. As a service to our customers we are providing this early version of the manuscript. The manuscript will undergo copyediting, typesetting, and review of the resulting proof before it is published in its final citable form. Please note that during the production process errors may be discovered which could affect the content, and all legal disclaimers that apply to the journal pertain.
References
- 1.Ewing D, Campbell I, Clarke B. The natural history of diabetic autonomic neruopathy. Q J Med. 1980;49:95–108. [PubMed] [Google Scholar]
- 2.Gottsater A, Ahmed M, Fernlund P, Sundkvist G. Autonomic neuropathy in Type 2 diabetic patients is associated with hyperinsulinaemia and hypertriglyceridaemia. Diabet Med. 1999;16:49–54. doi: 10.1046/j.1464-5491.1999.00001.x. [DOI] [PubMed] [Google Scholar]
- 3.Emdin M, Gastaldelli A, Muscelli E, et al. Hyperinsulinemia and autonomic nervous system dysfunction in obesity: effects of weight loss. Circulation. 2001;103:513–519. doi: 10.1161/01.cir.103.4.513. [DOI] [PubMed] [Google Scholar]
- 4.Muscelli E, Emdin M, Natali A, et al. Autonomic and hemodynamic responses to insulin in lean and obese humans. J Clin Endocrinol Metab. 1998;83:2084–2090. doi: 10.1210/jcem.83.6.4878. [DOI] [PubMed] [Google Scholar]
- 5.Piccirillo G, Vetta F, Fimognari FL, et al. Power spectral analysis of heart rate variability in obese subjects: evidence of decreased cardiac sympathetic responsiveness. Int J Obes Relat Metab Disord. 1996;20:825–829. [PubMed] [Google Scholar]
- 6.Quilliot D, Fluckiger L, Zannad F, Drouin P, Ziegler O. Impaired autonomic control of heart rate and blood pressure in obesity: role of age and of insulin-resistance. Clin Auton Res. 2001;11:79–86. doi: 10.1007/BF02322050. [DOI] [PubMed] [Google Scholar]
- 7.Akselrod S, Gordon D, Ubel F, Shannon D, Berger A, Cohen R. Power spectrum analysis of heart rate fluctuation: a quantitative probe of beat-to-beat cardiovascular control. Science. 1981;213:220–222. doi: 10.1126/science.6166045. [DOI] [PubMed] [Google Scholar]
- 8.Young JB, Landsberg L. Stimulation of the sympathetic nervous system during sucrose feeding. Nature. 1977;269:615–617. doi: 10.1038/269615a0. [DOI] [PubMed] [Google Scholar]
- 9.Welle S, Lilavivat U, Campbell RG. Thermic effect of feeding in man: increased plasma norepinephrine levels following glucose but not protein or fat consumption. Metabolism. 1981;30:953–958. doi: 10.1016/0026-0495(81)90092-5. [DOI] [PubMed] [Google Scholar]
- 10.Scherrer U, Sartori C. Insulin as a vascular and sympathoexcitatory hormone: implications for blood pressure regulation, insulin sensitivity, and cardiovascular morbidity. Circulation. 1997;96:4104–4113. doi: 10.1161/01.cir.96.11.4104. [DOI] [PubMed] [Google Scholar]
- 11.Rowe J, Young J, Minaker K, Stevens A, Pallotta J, Landsberg L. Effect of insuin and glucose infusions on sympathetic nervous system activity in normal man. Diabetes. 1981;30:219–225. doi: 10.2337/diab.30.3.219. [DOI] [PubMed] [Google Scholar]
- 12.Mitrakou A, Mokan M, Bolli G, et al. Evidence against the hypothesis that hyperinsulinemia increases sympathetic nervous system activity in man. Metabolism. 1992;41:198–200. doi: 10.1016/0026-0495(92)90153-2. [DOI] [PubMed] [Google Scholar]
- 13.Grassi G, Seravalle G, Cattaneo BM, et al. Sympathetic activation in obese normotensive subjects. Hypertension. 1995;25:560–563. doi: 10.1161/01.hyp.25.4.560. [DOI] [PubMed] [Google Scholar]
- 14.Vanninen E, Uusitupa M, Lansimies E, Siitonen O, Laitinen J. Effect of metabolic control on autonomic function in obese patients with newly diagnosed type 2 diabetes. Diabet Med. 1993;10:66–73. doi: 10.1111/j.1464-5491.1993.tb01999.x. [DOI] [PubMed] [Google Scholar]
- 15.Paolisso G, Manzella D, Rizzo MR, Barbieri M, Gambardella A, Varricchio M. Effects of glucose ingestion on cardiac autonomic nervous system in healthy centenarians: differences with aged subjects. Eur J Clin Invest. 2000;30:277–284. doi: 10.1046/j.1365-2362.2000.00626.x. [DOI] [PubMed] [Google Scholar]
- 16.Quilliot D, Zannad F, Ziegler O. Impaired response of cardiac autonomic nervous system to glucose load in severe obesity. Metabolism. 2005;54:966–974. doi: 10.1016/j.metabol.2005.03.002. [DOI] [PubMed] [Google Scholar]
- 17.Figueroa A, Collier SR, Baynard T, Giannopoulou I, Goulopoulou S, Fernhall B. Impaired vagal modulation of heart rate in individuals with Down syndrome. Clin Auton Res. 2005;15:45–50. doi: 10.1007/s10286-005-0235-1. [DOI] [PubMed] [Google Scholar]
- 18.Laitinen T, Huopio H, Vauhkonen I, et al. Effects of euglycaemic and hypoglycaemic hyperinsulinaemia on sympathetic and parasympathetic regulation of haemodynamics in healthy subjects. Clin Sci (Lond) 2003;105:315–322. doi: 10.1042/CS20030079. [DOI] [PubMed] [Google Scholar]
- 19.Baynard T, Franklin RM, Goulopoulou S, Carhart R, Jr, Kanaley JA. Effect of a single vs multiple bouts of exercise on glucose control in women with type 2 diabetes. Metabolism. 2005;54:989–994. doi: 10.1016/j.metabol.2005.02.015. [DOI] [PubMed] [Google Scholar]
- 20.Giannopoulou I, Fernhall B, Carhart R, et al. Effects of diet and/or exercise on the adipocytokine and inflammatory cytokine levels of postmenopausal women with type 2 diabetes. Metabolism. 2005;54:866–875. doi: 10.1016/j.metabol.2005.01.033. [DOI] [PubMed] [Google Scholar]
- 21.Huikuri HV, Linnaluoto MK, Seppanen T, et al. Circadian rhythm of heart rate variability in survivors of cardiac arrest. Am J Cardiol. 1992;70:610–615. doi: 10.1016/0002-9149(92)90200-i. [DOI] [PubMed] [Google Scholar]
- 22.Baynard T, Pitetti KH, Guerra M, Fernhall B. Heart rate variability at rest and during exercise in persons with Down syndrome. Arch Phys Med Rehabil. 2004;85:1285–1290. doi: 10.1016/j.apmr.2003.11.023. [DOI] [PubMed] [Google Scholar]
- 23.Heart rate variability. Standards of measurement, physiological interpretation, and clinical use. Task Force of the European Society of Cardiology and the North American Society of Pacing and Electrophysiology. Eur Heart J. 1996;17:354–381. [PubMed] [Google Scholar]
- 24.Grassi G, Seravalle G, Colombo M, et al. Body weight reduction, sympathetic nerve traffic, and arterial baroreflex in obese normotensive humans. Circulation. 1998;97:2037–2042. doi: 10.1161/01.cir.97.20.2037. [DOI] [PubMed] [Google Scholar]
- 25.Mari A, Pacini G, Murphy E, Ludvik B, Nolan JJ. A model-based method for assessing insulin sensitivity from the oral glucose tolerance test. Diabetes Care. 2001;24:539–548. doi: 10.2337/diacare.24.3.539. [DOI] [PubMed] [Google Scholar]
- 26.Laederach-Hofmann K, Mussgay L, Ruddel H. Autonomic cardiovascular regulation in obesity. J Endocrinol. 2000;164:59–66. doi: 10.1677/joe.0.1640059. [DOI] [PubMed] [Google Scholar]
- 27.Calle EE, Thun MJ, Petrelli JM, Rodriguez C, Heath CW., Jr Body-mass index and mortality in a prospective cohort of U.S. adults. N Engl J Med. 1999;341:1097–1105. doi: 10.1056/NEJM199910073411501. [DOI] [PubMed] [Google Scholar]
- 28.Landsberg L. Diet, obesity and hypertension: an hypothesis involving insulin, the sympathetic nervous system, and adaptive thermogenesis. Q J Med. 1986;61:1081–1090. [PubMed] [Google Scholar]
- 29.Tanikawa T, Abe H, Tanaka Y, Nakashima Y. Cardiac autonomic balance and QT dispersion during head-up tilt testing in diabetics with and without sensory neuropathy. Clin Exp Hypertens. 2004;26:137–144. doi: 10.1081/ceh-120028551. [DOI] [PubMed] [Google Scholar]
- 30.Paolisso G, Manzella D, Ferrara N, et al. Glucose ingestion affects cardiac ANS in healthy subjects with different amounts of body fat. Am J Physiol. 1997;273:E471–478. doi: 10.1152/ajpendo.1997.273.3.E471. [DOI] [PubMed] [Google Scholar]
- 31.Cerutti C, Barres C, Paultre C. Baroreflex modulation of blood pressure and heart rate variabilities in rats: assessment by spectral analysis. Am J Physiol. 1994;266:H1993–2000. doi: 10.1152/ajpheart.1994.266.5.H1993. [DOI] [PubMed] [Google Scholar]
- 32.Manzella D, Grella R, Esposito K, Giugliano D, Barbagallo M, Paolisso G. Blood pressure and cardiac autonomic nervous system in obese type 2 diabetic patients: effect of metformin administration. Am J Hypertens. 2004;17:223–227. doi: 10.1016/j.amjhyper.2003.11.006. [DOI] [PubMed] [Google Scholar]
- 33.Eckberg DL. Sympathovagal balance: a critical appraisal. Circulation. 1997;96:3224–3232. doi: 10.1161/01.cir.96.9.3224. [DOI] [PubMed] [Google Scholar]
- 34.Bernardi L, Porta C, Gabutti A, Spicuzza L, Sleight P. Modulatory effects of respiration. Auton Neurosci. 2001;90:47–56. doi: 10.1016/S1566-0702(01)00267-3. [DOI] [PubMed] [Google Scholar]
- 35.Bootsma M, Swenne CA, Van Bolhuis HH, Chang PC, Cats VM, Bruschke AV. Heart rate and heart rate variability as indexes of sympathovagal balance. Am J Physiol. 1994;266:H1565–1571. doi: 10.1152/ajpheart.1994.266.4.H1565. [DOI] [PubMed] [Google Scholar]
- 36.Pagani M, Lombardi F, Guzzetti S, et al. Power spectral analysis of heart rate and arterial pressure variabilities as a marker of sympatho-vagal interaction in man and conscious dog. Circ Res. 1986;59:178–193. doi: 10.1161/01.res.59.2.178. [DOI] [PubMed] [Google Scholar]