The expression and crystallization of recombinant E. coli YeaZ protein, which belongs to a family of proteins of unknown function that are conserved in Gram-positive and Gram-negative bacteria, is reported. Phasing of the diffraction data was performed by the MAD method using the anomalous signal of a gadolinium complex, Gd-DOTMA.
Keywords: structural genomics, Escherichia coli, YeaZ, Gd-DOTMA
Abstract
The Escherichia coli yeaZ gene encodes a 231-residue protein (M r = 25 180) that belongs to a family of proteins that are conserved in various bacterial genomes. This protein of unknown function is predicted to be a hypothetical protease. The YeaZ protein was overexpressed in E. coli and crystallized at 298 K by the hanging-drop vapour-diffusion method. A MAD data set was collected using a gadolinium-derivative crystal that had been soaked with 0.1 M Gd-DOTMA. The data set contained data collected to a resolution of 2.7 Å at two wavelengths at the L III absorption edge of gadolinium, while remote data were collected to a resolution of 2.28 Å. The crystal belonged to the orthorhombic space group P212121, with unit-cell parameters a = 76.3, b = 97.6, c = 141.9 Å. Phasing using the MAD method confirmed there to be four monomers in the asymmetric unit related by two twofold axes as identified by the self-rotation function search.
1. Introduction
Structural genomics is emerging as a general and powerful tool for functional protein annotation and is used by many structural genomics consortia on a genomic scale in order to associate a structure with each protein in a given genome. The Structural and Genomics Information Laboratory is involved in a Structural and Functional Genomics programme (BIGS; http://www.igs.cnrs-mrs.fr/Str_gen/), in which target selection was performed using bioinformatics and comparative genomics analyses of available bacterial genomes in order to identify new targets for the design of new classes of antibacterial compounds. Our study focuses on the identification of genes corresponding to ubiquitous proteins for which the precise biochemical or cellular functions remain unknown. This comparative genomics study resulted in the selection of 110 Escherichia coli candidate genes that have been submitted to our structural genomics pipeline (Abergel et al., 2003 ▶). We report here the expression, crystallization and phasing of the YeaZ protein, a protein that is conserved in Gram-positive and Gram-negative bacteria and is predicted to be a hypothetical protease based on bioinformatics studies. No experimental evidence supports this hypothesis and structural analysis of the recombinant protein should confirm or invalidate the in silico prediction and provide some insights into the physiological role of the protein as well as its ‘drugability’.
2. Results and discussion
2.1. Expression and purification of the yeaZ gene product
The gene encoding the E. coli YeaZ protein was amplified and cloned as described previously using the Gateway system (Invitrogen); soluble expression screening was performed using incomplete factorial design (Abergel et al., 2003 ▶).
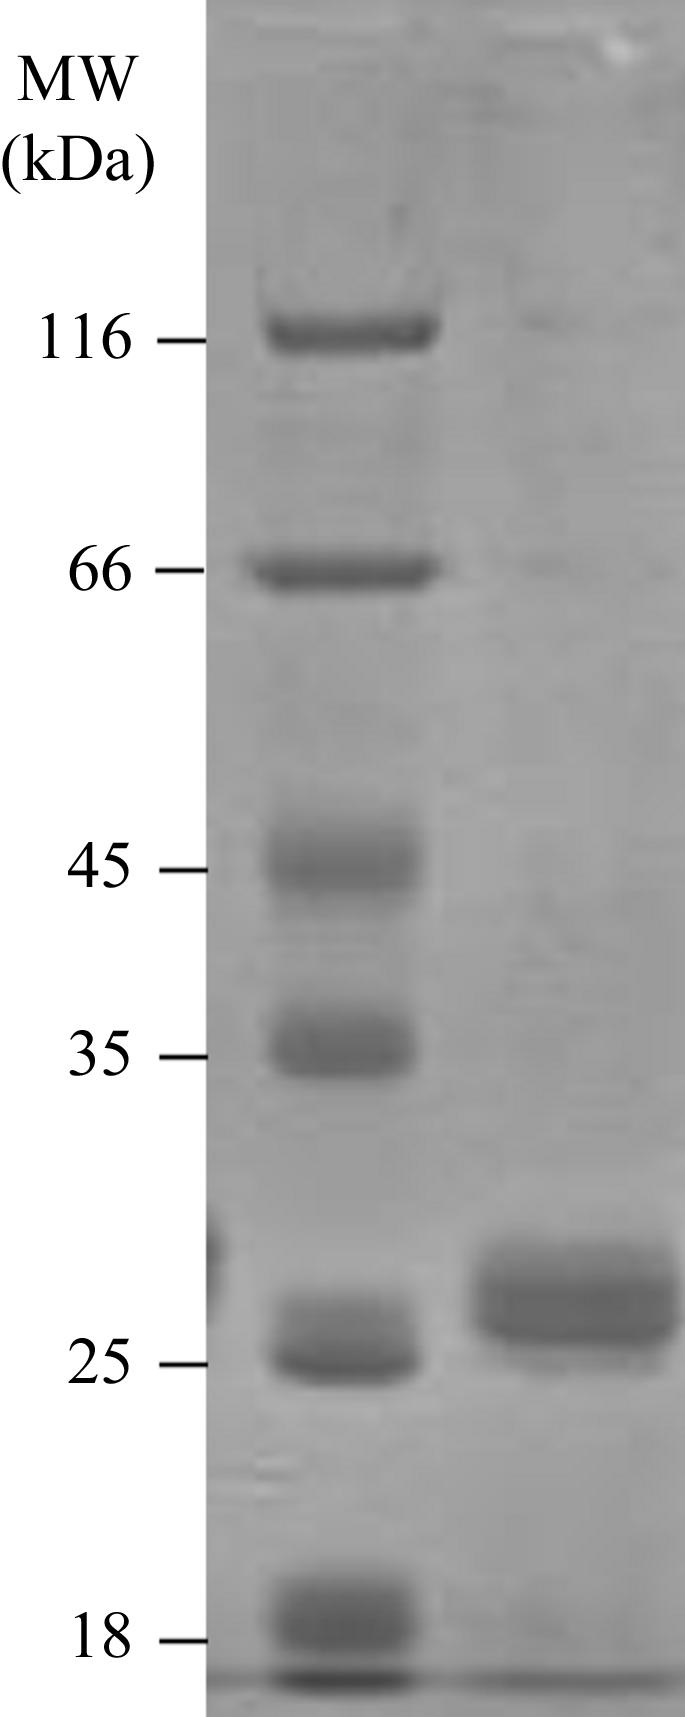
The best results were obtained when transforming E. coli BL21(DE3)pLysS at 303 K in 2YT media containing ampicillin and chloramphenicol, with induction of protein expression using 0.5 mM IPTG when A 600 reached 0.6–0.8. The pellet was resuspended in 300 mM NaCl, 50 mM sodium phosphate buffer pH 8.0 (buffer A) containing 0.1% Triton X-100 and 5% glycerol. Total protein was extracted by sonication. Purification of the recombinant protein was performed using an Ni–NTA affinity (Qiagen) column and a step-purification procedure [one wash step with 20 column volumes (CV) buffer A, one step to remove nonspecific binding with 20 CV buffer A and 25 mM imidazole and a specific elution step with 10 CV buffer A containing 300 mM imidazole]. The recombinant YeaZ protein corresponds to the native protein with the N-terminal methionine replaced by an extended His tag (SYYHHHHHHLESTSLYKKAGL). The purity of the purified protein was assessed by SDS–PAGE (Fig. 1 ▶). Desalting was performed using 20 mM Tris buffer pH 8.0 and the recombinant protein was concentrated to 29 mg ml−1 using a centrifugal filter device (Ultrafree Biomax 10K; Millipore, Bedford, MA, USA). The purified protein was characterized by mass spectroscopy and by N-terminal Edman sequencing. Isoelectric focusing using pH 3–10 gradient pre-cast gels (Novex) revealed a band around pI 5.4.
Figure 1.

SDS–PAGE of the purified YeaZ.
2.2. Crystallization
The YeaZ recombinant protein was initially screened at 293 K against 480 different conditions corresponding to commercially available crystallization solutions (Crystal Screen from Hampton Research and Wizard Screen from Emerald BioStructures) and an in-house incomplete factorial experimental design produced using the SAmBA software (Audic et al., 1997 ▶). The screening for crystallization conditions was performed on 3 × 96-well crystallization plates (Greiner) loaded by an eight-needle dispensing robot (Tecan WS 100/8 workstation modified for our needs), using one 1 µl sitting drop per condition (Abergel et al., 2003 ▶).
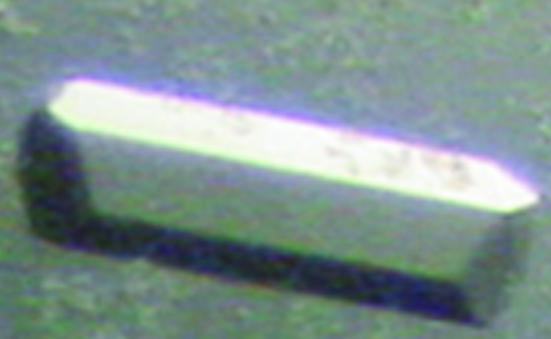
A few small aggregated crystals appeared after several weeks in 0.1 M sodium acetate buffer pH 4.7, 4–12%(w/v) PEG 8000 and 0.2 M NaCl. These conditions were refined at 293 K using 24-well crystallization plates (Greiner). The best conditions were obtained by mixing 1 µl of 17 mg ml−1 protein solution with 0.5 µl reservoir solution. The hanging drops on the cover slides were vapour-equilibrated against 1 ml of reservoir solution consisting of 0.1 M sodium acetate buffer pH 4.7–5.5, 4–8%(w/v) PEG 8000, 0.2 M NaCl and 10–20%(v/v) glycerol. Crystals reached typical dimensions of 0.2 × 0.4 × 0.4 mm (Fig. 2 ▶).
Figure 2.
A typical YeaZ crystal.
2.3. Data collection and processing
In order to obtain heavy-atom derivatives, native crystals were soaked for 6 h in 100 µl of a solution consisting of 8%(w/v) PEG 8000, 0.2 M NaCl, 10%(v/v) glycerol and 0.1 M sodium acetate pH 5.5 and containing 0.1 M Gd-DOTMA complex (Girard et al., 2003 ▶). After back-soaking in the reservoir solution without gadolinium complex for less than 1 min, a crystal was picked out in a 0.5 × 0.5 mm cryoloop (Hampton Research) and flash-frozen at 105 K in a nitrogen-gas stream. X-ray diffraction data were collected on the FIP BM30A beamline (ESRF, Grenoble, France) with a 165 mm diameter MAR CCD detector. A MAD data set was collected at wavelengths corresponding to the peak and inflection of the Gd L III absorption edge and at a far remote wavelength near the Se K absorption edge. The peak and inflection wavelengths were selected based on the fluorescence spectrum of the YeaZ derivative crystal (Table 1 ▶). Data at each wavelength were collected over a total angular range of 120° using angular steps of 1°. The crystal-to-detector distance was set to 110 mm for data collected at the Gd L III absorption edge. Indeed, owing to geometric limitations (minimum crystal-to-detector distance of 110 mm) the resolution limit for a 165 mm MAR CCD detector at these wavelengths is 2.7 Å. To reach a higher resolution we would have had to collect a second data set by changing the 2θ angle. The remote wavelength was collected at a 180 mm crystal-to-detector distance, which corresponded to a complete 2.28 Å resolution data set. Diffraction data were processed using MOSFLM (Leslie, 1992 ▶) and SCALA from the CCP4 package (Collaborative Computational Project, Number 4, 1994 ▶). A decrease in beam intensity occurred during data collection of the inflection data set (a scale factor of around 2 between the two data sets), thus resulting in a decrease in I/σ(I) and a consequent increase in R sym.
Table 1. X-ray data-collection statistics.
Values in parentheses are for the highest resolution shell.
| MAD | |||
|---|---|---|---|
| Data set | λ1 | λ2 | λ3 |
| Beamline | ESRF/BM30A | ||
| Wavelength (Å) | 1.71006 | 1.71066 | 0.97972 |
| Space group | P212121 | ||
| Unit-cell parameters (Å) | a = 76.34, b = 97.6, c = 141.94 | ||
| Resolution range (Å) | 25–2.7 (2.79–2.7) | 25–2.7 (2.79–2.7) | 25–2.28 (2.4–2.28) |
| Observations | 117477 | 116400 | 231483 |
| Unique reflections | 24873 | 24845 | 44418 |
| Multiplicity | 4.4 (2.0) | 4.3 (2.0) | 5 (2.6) |
| Completeness | 98.0 (89.2) | 97.8 (87.4) | 98.3 (89.7) |
| 〈I/σ(I)〉† | 15.7 (6.3) | 12 (3.4) | 9.3 (2.8) |
| Rsym‡ (%) | 3.2 (10.5) | 4.6 (20.3) | 5.7 (19.7) |
〈I/σ(I)〉 is the mean signal-to-noise ratio, where I is the integrated intensity of a measured reflection and σ(I) is the standard deviation of the integrated intensity measurement.
R
sym = 
 , where I
h,i is the ith measurement of the integrated intensity of reflection h and 〈Ih〉 is the mean intensity of reflection h over all measurements.
Mass spectroscopy of the YeaZ protein revealed a total weight of 27 563.4 Da, corresponding to the recombinant protein with the tag (theoretical MW 27 708 Da). Assuming the presence of four monomers in the asymmetric unit, the packing density of YeaZ in the crystal is 2.4 Å3 Da−1, indicating an approximate solvent content of 49% (Matthews, 1968 ▶). Data-collection statistics for the three wavelengths are presented in Table 1 ▶. A self-rotation search was performed using the AMoRe software (Navaza, 2001 ▶) and identified 16 peaks corresponding to two twofold axis relating the four YeaZ molecules present in the asymmetric unit (correlation 20.2%, resolution 15–2.5 Å).
2.4. Initial phasing
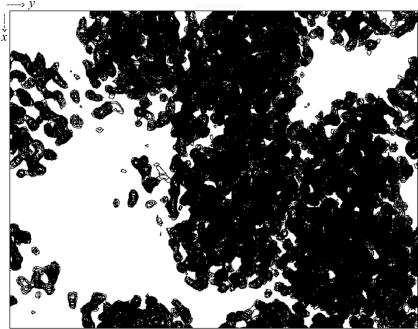
A heavy-atom site search and phase determination were performed using the program SOLVE (Terwilliger & Berendzen, 1999 ▶) using data collected at the three wavelengths in the 20–2.8 Å resolution range. A single solution was found with six heavy-atom sites with a Z score of 14.3 for a signal-to-noise ratio of 0.3, leading to a mean figure of merit of 0.46. Heavy-atom positions were then used as a seeding solution in autoSHARP (de La Fortelle & Bricogne, 1997 ▶; Bricogne et al., 2003 ▶). The phases obtained were improved using the solvent-flattening and histogram-matching procedures SOLOMON (Abrahams & Leslie, 1996 ▶) and DM (Cowtan, 1994 ▶; Cowtan & Main, 1996 ▶) as implemented in autoSHARP and the electron-density maps were used to construct the main chain of the molecules using TURBO-FRODO (http://afmb.cnrs-mrs.fr/rubrique113.html), validating the presence of four monomers in the asymmetric unit. The projection of the electron-density map corresponding to the best solution after solvent flattening is shown in Fig. 3 ▶.
Figure 3.
Projection along the z axis of the electron-density map corresponding to the best solution. This solution was obtained using SOLVE (Terwilliger & Berendzen, 1999 ▶) and solvent flattening was performed using DM (Cowtan & Main, 1996 ▶).
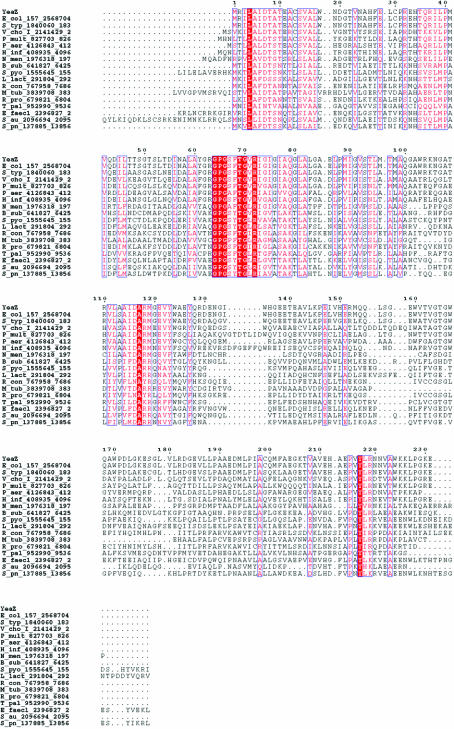
The YeaZ sequence is highly conserved in other bacterial genomes and multiple alignment reveals patches of sequence conservation that are probably linked to the physiological function of the protein (Fig. 4 ▶). The structural analysis of YeaZ in the light of the multiple alignment should thus provide a better understanding of its molecular function and therefore of its functional role in the bacteria.
Figure 4.
Multiple alignment of the E. coli K12 YeaZ sequence with orthologous bacterial sequences. Solid red boxes correspond to strictly conserved residues, while residues conserved in >70% of aligned sequences are coloured red. The multiple alignment was generated using the T-coffee software (http://www.igs.cnrs-mrs.fr/Tcoffee/tcoffee_cgi/index.cgi; Poirot et al., 2004 ▶). Sequences in the alignment are named YeaZ or the organism abbreviation according to SWISS-PROT.
Acknowledgments
We thank Bracco Imaging spa, Milan, Italy for kindly providing samples of Gd-DOTMA. We also wish to thank Deborah Byrne, Sabine Chenivesse, Céline Deregnaucourt, Caroline Maza and Marjorie Varagnol, our structural genomics team.
References
- Abergel, C., Coutard, B., Byrne, D., Chenivesse, S., Claude, J. B., Deregnaucourt, C., Fricaux, T., Gianesini-Boutreux, C., Jeudy, S., Lebrun, R., Maza, C., Notredame, C., Poirot, O., Suhre, K., Varagnol, M. & Claverie, J. M. (2003). J. Struct. Funct. Genomics, 4, 141–157. [DOI] [PubMed] [Google Scholar]
- Abrahams, J. P. & Leslie, A. G. W. (1996). Acta Cryst. D52, 30–42. [DOI] [PubMed] [Google Scholar]
- Audic, S., Lopez, F., Claverie, J. M., Poirot, O. & Abergel, C. (1997). Proteins, 29, 252–257. [DOI] [PubMed] [Google Scholar]
- Bricogne, G., Vonrhein, C., Flensburg, C., Schiltz, M. & Paciorek, W. (2003). Acta Cryst. D59, 2023–2030. [DOI] [PubMed] [Google Scholar]
- Collaborative Computational Project, Number 4 (1994). Acta Cryst. D50, 760–763. [Google Scholar]
- Cowtan, K. (1994). Jnt CCP4/ESF–EACBM Newsl. Protein Crystallogr.31, 34–38.
- Cowtan, K. D. & Main, P. (1996). Acta Cryst. D52, 43–48. [DOI] [PubMed] [Google Scholar]
- Girard, E., Stelter, M., Anelli, P. L., Vicat, J. & Kahn, R. (2003). Acta Cryst. D59, 118–126. [DOI] [PubMed] [Google Scholar]
- La Fortelle, E. de & Bricogne, G. (1997). Methods Enzymol.276, 472–494. [DOI] [PubMed]
- Leslie, A. G. W. (1992). Jnt CCP4/ESF–EACBM Newsl. Protein Crystallogr.26
- Matthews, B. W. (1968). J. Mol. Biol.33, 491–497. [DOI] [PubMed] [Google Scholar]
- Navaza, J. (2001). Acta Cryst. D57, 1367–1372. [DOI] [PubMed] [Google Scholar]
- Poirot, O., Suhre, K., Abergel, C., O’Toole, E. & Notredame, C. (2004). Nucleic Acids Res.32, W37–W40. [DOI] [PMC free article] [PubMed] [Google Scholar]
- Terwilliger, T. C. & Berendzen, J. (1999). Acta Cryst. D55, 849–861. [DOI] [PMC free article] [PubMed] [Google Scholar]


