

Abstract
Alterations in adipogenesis could have significant impact on several aging processes. We previously reported that calorie restriction (CR) in rats significantly increases the level of circulating adiponectin, a distinctive marker of differentiated adipocytes, leading to a concerted modulation in the expression of key transcription target genes and, as a result, to increased fatty acid oxidation and reduced deleterious lipid accumulation in other tissues. These findings led us to investigate further the effects of aging on adipocytes and to determine how CR modulates adipogenic signaling in vivo. CR for 2 and 25 months, significantly increased the expression of PPARγ, C/EBPβ and Cdk-4, and partially attenuated age-related decline in C/EBPα expression relative to rats fed ad libitum (AL). As a result, adiponectin was upregulated at both mRNA and protein levels, resulting in activation of target genes involved in fatty acid oxidation and fatty acid synthesis, and greater responsiveness of adipose tissue to insulin. Moreover, CR significantly decreased the ratio of C/EBPß isoforms LAP/LIP, suggesting the suppression of gene transcription associated with terminal differentiation while facilitating preadipocytes proliferation. Morphometric analysis revealed a greater number of small adipocytes in CR relative to AL feeding. Immunostaining confirmed that small adipocytes were more strongly positive for adiponectin than the large ones. Overall these results suggest that CR increased the expression of adipogenic factors, and maintained the differentiated state of adipocytes, which is critically important for adiponectin biosynthesis and insulin sensitivity.
Keywords: C/EBPs, PPAR, Lipid Metabolism, Insulin Sensitivity, Insulin/Insulin-Like Signaling
1. INTRODUCTION
Adipose tissue, once thought to function primarily as a passive depot for the storage of excess lipid, is now understood to play a central role in metabolic regulation, feeding behavior and secretion of a variety of metabolic hormones. Fat depots are also involved in preventing deleterious lipid accumulation in other tissues (Camp et al., 2002, Korner and Aronne, 2003). Unlike other tissues, adipose mass has considerable capacity to expand through a complex interplay between proliferation and differentiation of preadipocytes into functional adipocytes (adipogenesis), an increase in individual adipocyte size (hypertrophy), or both throughout lifespan (Bertrand et al., 1978). Excessive accumulation of adipose tissue in obesity contributes to the development of metabolic and cardiovascular diseases, and certain cancers (Must et al., 1999, Mokdad et al., 2001). On the other hand, loss of adipose tissue predisposes individuals, especially the elderly, to chronic skin ulcers, disturbances of body temperature and decreased energy reserves in the face of chronic illness (Watters and Bessey, 1994, Klipstein-Grobusch et al., 1995). Another complication of excessive fat loss includes glucose intolerance, potentially contributing to the paradoxical development of type II diabetes in very old lean patients (Moitra et al., 1998, Agarwal and Garg, 2006). The capacity of preadipocytes to differentiate appears to decrease with aging (Kirkland et al., 1994, Karagiannides et al., 2001). This age-related decline in adipogenesis could be attenuated by overexpression of Klotho, an anti-aging related marker (Chihara et al., 2006). It is therefore not surprising to note that the adipogenic potential has been implicated in many processes related to different aspects of aging, including insulin sensitivity, lipid metabolism, stress response and inflammation.
As a key factor for controlling adipose mass, the molecular mechanisms that regulate adipogenesis have been subject to intense scrutiny. To a large degree, many aspects of adipogenesis could be described as a cascade of gene expression regulated by a small set of transcription factors, including the genes for CCAAT/enhancer binding protein α (C/EBPα) and peroxisome proliferator-activated receptor γ (PPARγ) (Barak et al., 1999, Rosen et al., 2000, Linhart et al., 2001). However, the induction of both of these factors during the early phase of adipogenesis is regulated by C/EBPβ through association with C/EBP regulatory elements within the promoters of the corresponding genes (Rana et al., 1995, Wu et al., 1995, Yang and Chow, 2003). C/EBPβ is a member of the bZIP family of transcription factors that binds to DNA as homodimers or heterodimers with other C/EBPs. There are three major isoforms of C/EBPβ: two full-length LAP (liver-enriched activator protein, 34 kD and 38 kD) isoforms and one truncated 20 kD LIP (liver-enriched inhibitory protein) isoform (Descombes and Schibler, 1991), which are produced at specific stages of differentiation through alternative use of the two translation initiation sites within a single mRNA (Darlington et al., 1998, Calkhoven et al., 2000, Xiong et al., 2001). Because LIP lacks most of the transactivation domain but contains the DNA-binding and dimerization domains, it is proposed to function as a dominant negative regulator of full-length C/EBP LAP (Descombes et al., 1990). Furthermore, cyclin-dependent kinase 4 (Cdk4) has been shown recently to promote adipogenesis and participate in adipocyte function through direct activation of PPARγ (Abella et al., 2005), strongly suggesting that cell cycle regulators trigger adipogenesis.
Adiponectin is one of many adipocyte-derived hormones that is exclusively expressed and regulated in differentiated adipocytes (Gregoire, 2001, Korner et al., 2005). It acts as autocrine factor in adipose tissues by triggering programmed gene expression responsible for adipogenesis in vitro models (Fu et al., 2005). Circulating levels of adiponectin have been shown paradoxically to be decreased in diabetic and obese conditions of mice (Combs et al., 2002), rhesus monkeys (Hotta et al., 2001) and humans (Lindsay et al., 2002, Stefan et al., 2002). In contrast, calorie restriction (CR), which provides multiple health benefits and extends lifespan in diverse organisms (Weindruch et al., 1986, Masoro, 2000, Roth et al., 2001), enhances plasma adiponectin levels in normal animals (Berg et al., 2002, Zhu et al., 2004), as well as in long-lived Ames dwarf mice (Wang et al., 2006)and GHR-KO mice (Berryman et al., 2004). These results support the hypothesis that adipogenesis per se may exert beneficial effects on many processes related to different aspects of aging.
To characterize further the effects of aging on adipocyte biology and to determine how CR modulates adipogenic signaling in vivo, we have extended our previous findings regarding CR-induced increase in adiponectin (Zhu et al., 2004) to examine the expression of transcription factors that regulate pathways of adipogenesis and to identify target genes responsible for maintaining the differentiated state while repressing individual cell hypertrophy. We conclude that CR increases the expression of adipogenic factors, and maintains the differentiated state of adipocytes, which is critically important for adiponectin biosynthesis and insulin sensitivity.
2. MATERIALS AND METHODS
2.1 Materials
Human recombinant insulin, protein A-Sepharose, mouse monoclonal antibody against βactin, and triglyceride assay kit (GPO Trinder) were obtained from Sigma (St. Louis, MO). Reagents for RT-PCR and SDS-PAGE were purchased from Invitrogen™ Life Technologies (Carlsbad, CA). QuantumRNA 18S Internal Standards kit was from Ambion (Austin, TX). The antibodies against insulin β-subunit and phosphotyrosine (4G10) were from Upstate Biotechnology (Lake Placid, NY). Rabbit polyclonal antibody against adiponectin was purchased from Chemicon (Temecula, CA). Rabbit polyclonal antibodies against PPARγ, C/EBPα and C/EBPβ were from Santa Cruz Biotechnology. Rat insulin and mouse/rat leptin ELISA kits were from ALPCO (Windham, NH), whereas adiponectin RIA kit was obtained from Linco Research (St. Charles, MO). All other chemicals were obtained from Sigma at the highest quality available.
2.2 Animal protocols
Male Fischer-344 rats born at the Gerontology Research Center were weaned at 28 days, housed individually and randomly assigned to either AL, fed ad libitum, or CR, provided with a daily food allotment of 60% of that eaten by the AL rats. All animals were maintained on a 12 hr light/dark cycle in a separate vivarium at the Gerontology Research Center under specific pathogen-free conditions, and supplied with NIH-31 standard rodent chow for AL rats (Harlan Teklad, Indianapolis, IN) and with NIH-31 fortified rodent chow for CR rats (Harlan Teklad). In a fasted state, body weights were recorded, and blood samples from snipped tails were collected in micorcapillary tubes for determination of plasma parameters. At each experimental time-point (2- and 25-mo CR or AL), the rats were fasted overnight and anesthetized with sodium pentobarbital (60 mg/kg body weight, i.p). The abdominal cavity was opened, and the portal vein was exposed. Then 4 ml of normal saline (0.9% NaCl) with or without human recombinant insulin at a dose of 10 U/kg body weight (0.4 mg) was injected to the portal vein. The epididymal adipose tissue was excised 60 seconds after insulin injection, then immediately frozen in liquid nitrogen prior to storage at −80°C. All animal procedures for this study were reviewed and approved by the Animal Care and Use Committee (ACUC) at the Gerontology Research Center (NIA/NIH).
2.3 Immunoprecipitation and western blotting
The frozen adipose tissue was homogenized in ice-cold lysis buffer (50 mM Tris-HCl, pH 7.5, 120 mM NaCl, 1% Nonidet P-40, 1mM Na3VO4, 1mM EDTA, 50 mM NaF, 1mM benzamidine, 0.5 mM PMSF, and 1:500 protease-inhibitor cocktail) using a polytron homogenizer. After 60 min incubation at 4°C with constant rotation, the insoluble material was removed by centrifugation at 14,000 rpm for 20 min at 4°C. Equal protein amounts of tissue (500 μg) were incubated in 0.5 ml of immunoprecipitation buffer (20mM Tris-HCl, pH 7.5, 150 mM NaCl, 1% Nonidet P-40, 1% Triton X-100, 1mM Na3VO4, 1 mM EGTA, 1 mM PMSF, 1 mM NaF, 1mM EDTA, and 1:500 protease-inhibitor cocktail) with 1μg of antibody against IR-β subunit overnight at 4°C with constant agitation. On the following day, immunocomplexes were bound to protein A-Sepharose beads (25 μl of 50% slurry) during additional 2-hr incubation at 4°C with constant agitation, and were then washed four times with ice-cold immunoprecipitation buffer. Proteins were eluted by boiling for 10 min in 80 μl of 2 X Laemmli SDS sample buffer. Protein samples, either total protein or immunoprecipitated proteins, were separated by 4–20% gradient SDS-PAGE gels. The resolved proteins were transferred to a 0.45μm PVDF membrane, and probed with primary antibodies against IR, phosphotyrosine, C/EBPα, C/EBPß, PPARγ, Cdk-4 and β-actin overnight at 4°C. On the following day, the membrane was washed and incubated with a secondary antibody conjugated with horseradish peroxidase for 1 hr at room temperature. Signals from immunoblotting were analyzed by measuring the density using the NIH Image.
2.4 RNA extraction, synthesis of cDNA and semiquantitative multiplex polymerase chain reaction (RT-PCR)
Total RNA was extracted using TRizol reagent according to the manufacturer’s suggested protocols. Single stranded complementary DNA (cDNA) was synthesized from DNase-treated RNA samples using MMLV reverse transcriptase with a mixture of an oligo (dT) primer and random hexanucleotide primer. Polymerization reactions were performed in a thermocycler in a 50-μl reaction volume containing 3 μl of cDNA (150 ng total RNA equivalents), Taq PCR buffer, 60 μM of each dNTP, 1.25 mM MgCl2, and 2.5 units of Taq DNA polymerase. The samples were also tested without reverse transcriptase to ensure that there was no contamination with genomic DNA. In each PCR set, the gene products of interest were amplified with an internal control gene (18S rRNA) diluted with competimers, to correct for experimental variations between samples (RNA quantification, starting cDNA, gel loading, etc). The thermal cycle profile consisted of an initial denaturation step (4 min at 94 °C), followed by the number of amplification cycles (30s of denaturation at 94°C, 30s of annealing at 55°C, and 45s of extension at 72°C) and a final extension step of 7 min at 72 °C. The specific primers, ratio of 18S primer to competimers, and cycle number used for multiplex PCR are indicated in Table 1. To ensure the validity of the measurement of mRNA levels by semiquantitative multiplex RT-PCR, control experiments were performed using 2-mo AL adipose tissue cDNA to show that the amount of each amplimer obtained in a multiplex PCR was independent of the presence of the another primer, excluding the possibility of strong interference between primers. Our results on PCR amplification and quantity were highly reproducible, as judged by multiple PCR determination from the same cDNA preparation (coefficient of variation <10%). The final PCR products were separated by 8% polyacrylamide gels in TBE buffer, and visualized by SYBR staining. Band intensity was quantified with the NIH Image. The average intensity of each product was expressed relative to the internal control gene 18S rRNA. These ratios were then used to calculate relative mRNA levels.
Table 1.
Sequences of oligonucleotide primers and PCR conditions.
| Gene name | Size (bp) | 5′oligonucleotide | 3′oligonucleotide | Genbank™ Assession No | Cycles | 18S Primers : Competimers |
|---|---|---|---|---|---|---|
| Insulin receptor (IR) | 275 | ATGGGACCACTGTACGCTTC | CATTGAGGAACTCGATCCGT | M29014 | 33 | 1 : 4 |
| PPARγ(II) | 266 | TGACAGTGACTTGGCCATATTT | GCAGAGGGTGAAGGCTCATA | Y12882 | 31 | 3: 7 |
| Fatty acid synthase (FAS) | 234 | GCCCTGCTACCACTGAAGAG | GTTGTAATCGGCACCCAAGT | M76767 | 29 | 1 : 1 |
| Hormone sensitive lipase (HSL) | 285 | CTGCCTTCCCTGATGGTTT | GACACAGGGCTGCTAAGCTC | X51415 | 28 | 1 : 1 |
| SREBP-1C | 250 | GCCTATTTGATGCCCCCTAT | AGTGGCACTGGCTCCTCTT | AF286470 | 32 | 2 : 3 |
| Acy-CoA oxidase (ACO) | 261 | AGCTGTGCTGAGGAACCTGT | GATTTCTTGGCCCACTCAAA | J02752 | 30 | 2 : 3 |
| Adiponectin | 360 | GTCACTGTCCCCAATGTTCC | AGAGGCCTGGTCCACATTTT | NM_144744 | 28 | 3 : 7 |
2.5 Histological and morphometric analysis of adipose tissue
The epididymal adipose tissue was collected through a longitudinal cut above the epididymis, carefully cassetted, and then fixed in ice-cold 4% paraformaldehyde in 0.1 M phosphate buffer. After fixation overnight at 4°C, the tissue was embedded in Tissue-Tec OCT and quickly frozen in dry ice and ethanol. Two sets of the three serial cryostat sections (15–20 μm thick) were obtained at intervals of approximately 300 μm. Sections from the first set were stained with hematoxylin-eosin. Using a quantitative morphometric method, starting at a random field, in one corner of the section, the sizes of adipocytes within 10 fields in every other field per tissue block were measured at 20X magnification using AmioVision software. Distributions of adipocyte size were obtained from individual data of cell sizes. To avoid inter-rating variation, a single observer (M.Z.) carried out morphometric analysis (coefficient of variation less than 7%). Sections from the second sets were incubated with mouse monoclonal antibody against adiponectin followed by biotin-conjugated second antibody and streptavidin-horseradish peroxidase.
2.6 Plasma leptin determination
Plasma leptin values were determined using a commercially available ELISA kit.
2.7 Statistical analysis
Data are expressed as means ± SEM of 6–8 individual animals. Statistical significance was determined using a two-way (age by diet regimen) analysis of variance (ANOVA) with post-hoc Fisher’s test (2-month AL vs. 25-month AL; 2-month AL vs. 2-month CR; 25-month AL vs. 25-month CR). Distributions of adipocyte size were analyzed by the Quantitative Distribution method. The comparison of distributions between AL and CR groups was determined by Kolmogorov-Smirnov test, with assistance from STATVIEW software (SAS Institute, Inc). The level of significance was accepted as p ≤ 0.05.
3. RESULTS
3.1 Effects of CR on body weight and various plasma parameters in a fasted state
We have previously examined the changes in body weight and plasma insulin, adiponectin and triglycerides concentrations were examined as a function of age and diet by two-way ANOVA (age by diet) as shown in (Zhu et al., 2004). In addition, we measured plasma leptin and fund that it was significantly reduced by CR throughout the experiments (diet effect, p<0.0001 with age by diet interaction, p=0.009) shown in Table 2.
Table 2.
Plasma leptin concentration in a fasted state
| Time after CR diet (month) | Plasma leptin (pg/ml)
|
|
|---|---|---|
| AL | CR | |
| 2 | 270.84±25.85 | 84.75±11.40* |
| 10 | 399.37±28.86 | 78.53±20.52*** |
| 15 | 457.32±46.75 | 42.31±8.99*** |
| 20 | 271.60±51.01 | 124.68±84.22* |
Data are expressed as means±SEM of 7 rats;
p <0.01,
p <0.001,
p <0.0001 vs. AL counterparts according to post-hoc Fisher’s test.
3.2 CR activates transcription factors that induce expression of genes associated with adipogenesis
To determine whether CR status alters the signals involved in adipogenic transcription cascade, we first chose to analyze the transcriptional events and target genes associated with adipogenesis. As shown in Fig. 1, the difference in the expression of mRNA for PPARγ was much more dependent on diet (p=0.001) than age (p=0.31); post-hoc tests indicated that CR, both 2-month and 25-month, significantly increased the expression of mRNA for PPARγ (Fig. 1A, left panel). A similar profile was also observed with regard to PPARγ protein expression (Fig. 1A, right panel; diet effect, p=0.0009). The expression of C/EBPα protein exhibited an age-related decline (age effect, p=0.003), which was attenuated by CR at 25 months (Fig. 1B). We next compared the expression levels of the two C/EBPβ protein isoforms, LAP and LIP, between AL and CR regimens (Fig. 1D). Full length C/EBPβ-LAP (combination of 38kD and 34kD bands) expression declined with age (age effect, p=0.0001); whereas C/EBPβ-LIP isoform was significantly increased by CR (diet effect, p=0.0003), thereby resulting in significant decrease in the ratio of LAP/LIP in rats on CR diet. Because cyclin-dependent kinase 4 (Cdk4) increases adipogenic potential and participates in adipocyte function through direct activation of PPARγ (Abella et al., 2005) we further investigated whether Cdk4 expression in WAT was affected by CR during aging. As shown in Fig. 1C, Cdk4 protein expression significantly increased following a 2- or 25-month CR feeding (diet effect, p=0.0006), which was independent of age (p=0.39). As a consequence, there was an increased expression of adiponectin, a distinctive marker of differentiated adipocytes (diet effect, p=0.006) without any significant age effect (p=0.44) (Fig. 1E).
Figure 1.
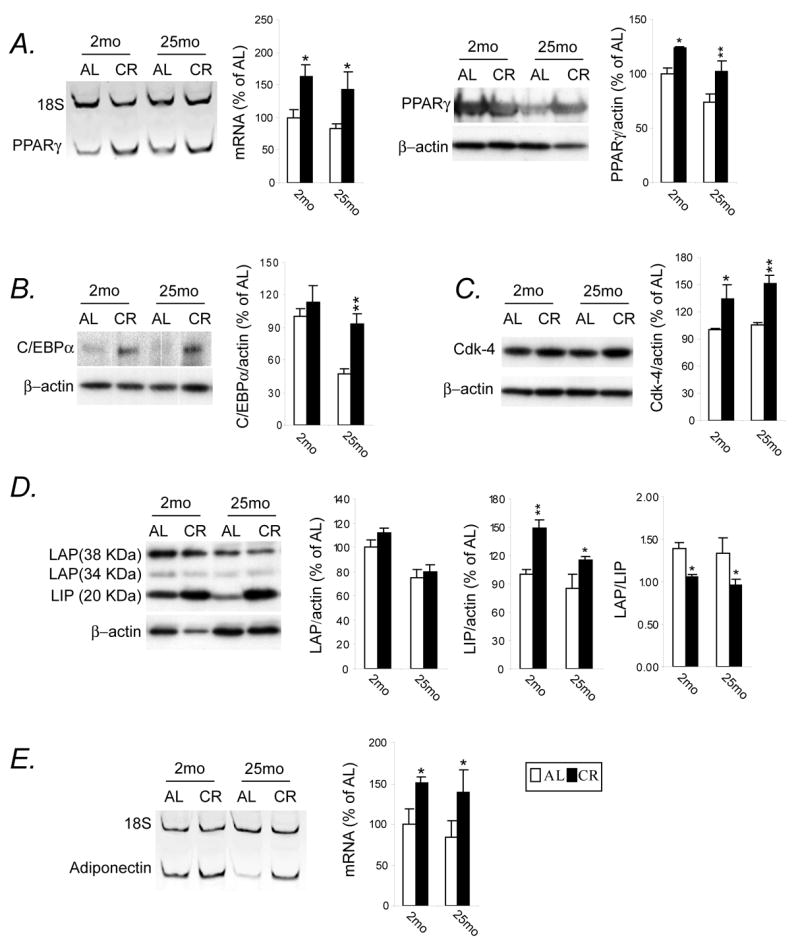
CR activates transcription factors that induce the expression of genes associated with adipogenesis. Animals (n=5–8) maintained on either AL or CR diet for 2- and 25-mo were sacrificed in a fasted state. Total RNA was isolated from frozen epididymal fat depot, and mRNA levels were compared by semiquantitative multiplex RT-PCR. After normalization of the specific gene to the internal control gene, 18S rRNA, mRNA levels are represented as means ± SEM, expressed as relative levels of 2-mo AL group. Representative PCR products, PPARγ (A, left panel) and adiponectin (E) are also presented. Additionally, equal amounts of total proteins from each group resolved with SDS-PAGE were detected with antibodies against PPARγ, CEBPα, Cdk-4 and CEBPβ. Data are expressed as percentage of changes in PPARγ (A, right panel), CEBPα (B), Cdk-4 (C) and CEBPβ (2D) versus β-actin (served as loading control). * P<0.05, ** P<0.01 versus AL counterparts according to two-way (age by diet regimen) ANOVA with post-hoc Fisher’s tests.
3.3 CR leads to heterogeneity of adipocyte size with a shift of cell population toward small size
The size and number of adipocytes reflect not only the capacity of lipid storage and the status of adipocyte growth and differentiation but also modulation of several signaling pathways (Farnier et al., 2003, Suzuki et al., 2005). The morphological analyses indicated that the adipocyte size in rats maintained on CR diet for 6 months tended to be smaller than that seen in age-matched AL rats (Fig. 2A). Quantitative measurement of cell profile area revealed that there was no significant difference in skewness of distributions between CR and AL rats (2.62 vs. 2.49; positive skewed). However, the value of kurtosis was markedly higher in rats on CR diet than that seen in rats on AL diet (21.34 vs. 15.67). The median size of cells in CR rats was dramatically smaller than that observed in AL rats (2961 μm2 vs. 4276 μm2, p<0.0001). The Kolmogorov-Smirnov test demonstrated that the difference in distributions of cell size between CR and AL rats was statistically significant (p<0.0001). Furthermore, histological examination revealed that smaller adipocytes (Fig. 2C, right-panel) were more strongly positive for adiponectin than were the larger ones (Fig. 2C, right vs. left-panels).
Figure 2.
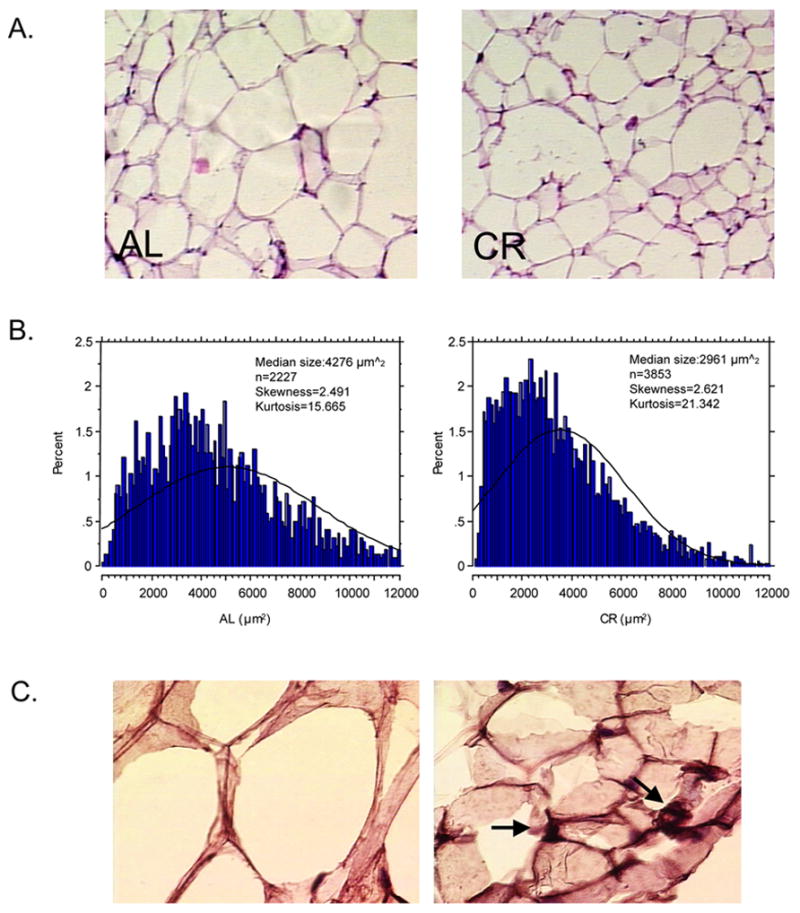
CR results in heterogeneity of adipocyte size with a shift of cell population toward small size. Animals maintained on either AL or CR diets for 6 months were sacrificed. The epididymal fat was collected through a longitudinal cut above the epididymus and carefully cassetted for tissue processing. Two sets of three serial cryostate sections (15–20 μm thick) were obtained at intervals of approximately 300 μm. Sections from the first set were stained with Hematoxylin-Eosin (A). Using a quantitative morphometric method, starting at a random field in one corner of the section, the sizes of adipocytes within 10 fields in every other field per tissue block (n=6–7) were measured at 20X magnification assistance from AmioVision software (B). Distributions of adipocytes size were obtained from individual data of cell sizes and analyzed by the Quantitative Distribution Method. The statistical comparison of distributions between AL and CR groups was determined by Kolmogorov-Smirnov (P<0.0001). Sections of the second sets were immunostained by use of an ABC kit, followed by Hematoxylin counterstaining. The primary antibody used was rabbit polyclonal anti-adiponectin (C).
The adipocytes generate feedback signals, including adiponectin and leptin. To assess adipocytes to synthesize adipocyte-derived hormones, we measured the tissue contents of adiponectin and leptin. As shown in Fig. 3A, tissue adiponectin levels were decreased with age (age effect, p=0.003) and increased by CR (diet effect, p=0.0002) with age by diet interaction (p<0.0001). In contrast, tissue leptin contents were increased with age (age effect, p=0.001), and decreased by CR (diet effect, p<0.0001) (Fig. 3B).
Figure 3.
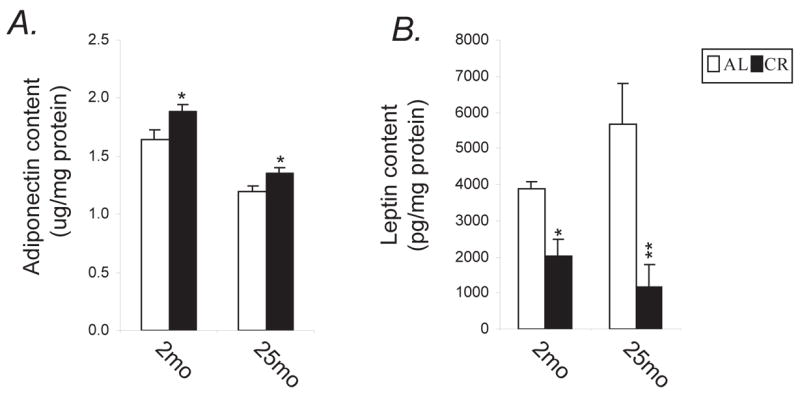
CR attenuates age-related decline in tissue content of adiponectin and age-related increase in tissue content of leptin. Animals used and tissue processing were the same as those in Fig. 2. The tissue contents were measured by use of commercially available kits. The tissue contents of adiponectin (A) and leptin (B) were calculated for each animal as the product of adiponectin and leptin from mg total protein. * P<0.05, ** P<0.001 versus AL counterparts according to two-way (age by diet regimen) ANOVA with post-hoc Fisher’s tests.
3.4 CR maintains expression of mRNAs for fatty acid synthase (FAS) and acyl-CoA oxidase (ACO) at high levels and increases insulin-mediated activation of the insulin receptor
Because aging is associated with a decline in insulin sensitivity in adipocytes (Yu and Zhu, 2004), we further examined the effects of CR on two important functional aspects in these cells, i.e., gene expression associated with lipid metabolic pathway and insulin receptor function. Two-way ANOVA revealed an age effect (p<0.0001) and diet effect (p=0.0034) on the expression of mRNA for FAS. Results of post-hoc tests demonstrated that FAS mRNA expression declined with age (p=0.04), and increased by CR (p=0.04 for 2-month; p=0.02 for 25-month) (Fig. 4B). A similar trend was observed for the expression of ACO mRNA (age effect, p=0.004); and this age effect was partially attenuated by CR at both ages (diet effect, p=0.001) (Fig. 4C). The expression of hormone sensitive lipase (HSL) mRNA also declined with age (age effect, p=0.04), which was independent of the diet effect (p=0.84) (Fig. 4A).
Figure 4.
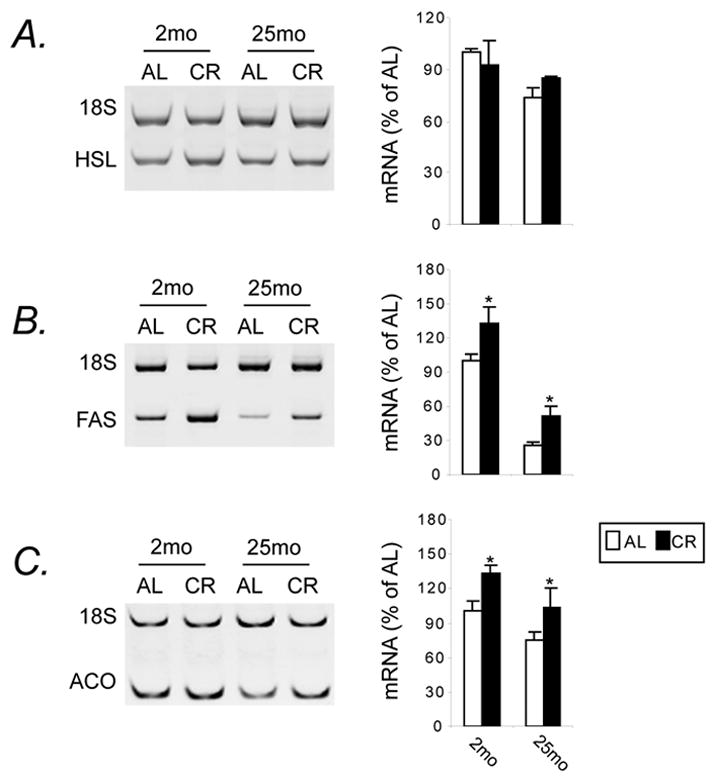
CR maintains mRNAs for fatty acid synthase (FAS) and acyl-CoA oxidase (ACO) at high levels. Animals used and tissue processing were the same as Fig. 2. After normalization of the specific gene to the internal control gene, 18S rRNA, mRNA levels represent means ± SEM, expressed as relative levels of 2-mo AL group. Representative PCR products, hormone sensitive lipase (HSL) (A), FAS (B) and ACO (C), are also presented. * P<0.05 versus AL counterparts according to two-way (age by diet regimen) ANOVA with post-hoc Fisher’s tests.
To determine whether CR modulates any insulin receptor (IR) signaling during aging, we first assessed IR expression at mRNA and protein levels in adipose tissue. Results of two-way ANOVA revealed significant age effect (p<0.0001) and diet effect (p=0.0005) on the IR mRNA, and post-hoc tests confirmed this age-dependent decline, which was attenuated by CR (Fig. 5A). Regarding the measures of IR-β protein (Fig 5B) and insulin-stimulated tyrosine phosphorylation of the IR (pY-IR) (Fig. 5C), we noted a 14% age-related decline in IR-β expression, but this difference did not reach a significant level (p=0.55). However, CR upregulated IR-β and pY-IR expression at both ages (p=0.04 and 0.02 for 2-month CR; p=0.02 and 0.007 for 25-month CR, respectively). No significant age- and diet-related changes in basal pY-IR levels were observed (data not shown).
Figure 5.
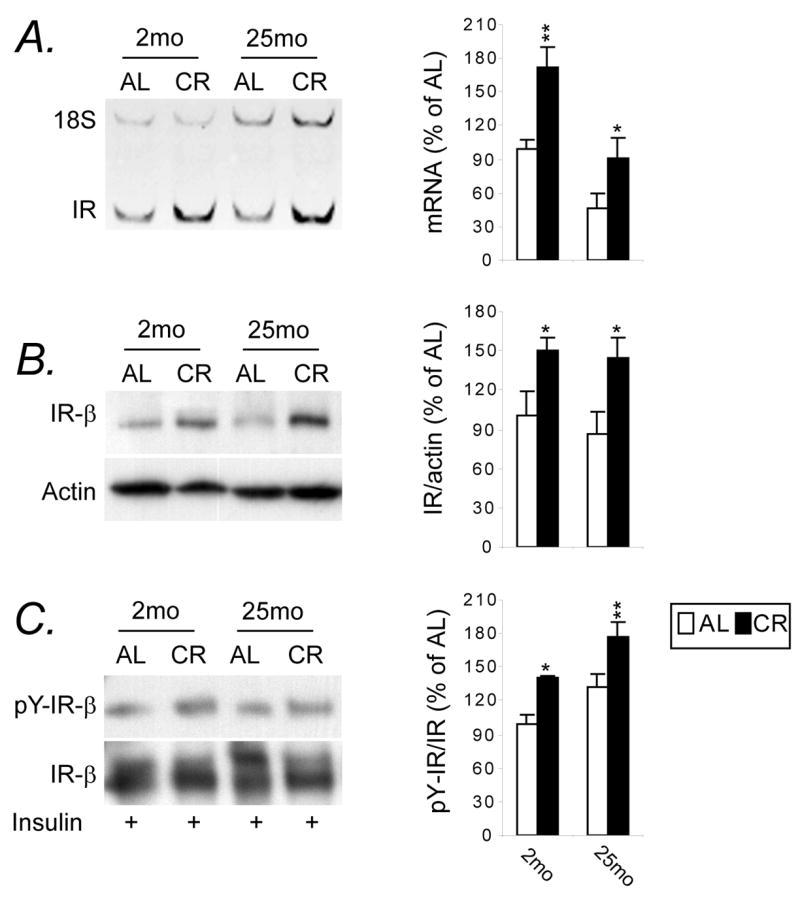
CR increases insulin-mediated activation of the insulin receptor. Animals (n=5–8) maintained on either AL or CR diet for 2 and 25 months were anesthetized in a fasted state. Normal saline with or without human recombinant insulin (10 units/kg body weight) was injected to the portal vein. The epididymal fat depot from each animal was excised 60 second after injection and proteins were isolated. Equal amount of protein lysates was subjected to immunoprecipitation with anti-insulin β-subunit antibody, and separated by SDS-PAGE and Western blot analysis using either antibody against phosphotyrosine or IR-β subunit antibody. Data are expressed as the percentage change of tyrosine phosphorylation of insulin receptor (pY-IR) as compared with total IR. The graphs represent means ± SEM, expressed as percent of 2-mo AL group at the expression levels of IR mRNA (A), IR protein (B) and pY-IR (C). * P<0.05, ** P<0.01 versus AL counterparts according to two-way (age by diet regimen) ANOVA with post-hoc Fisher’s tests.
4. DISCUSSION
The capacity of preadipocytes to differentiate appears to decrease with aging. This is in accord with the hypothesis that aging affects the adipogenic potential or program. In the present study, we demonstrated that CR, both short-term and long-term, increased the expression of PPARγ, C/EBPβ and Cdk-4, and attenuated the age-related decline in C/EBPα expression in white adipose tissue, all of which have been documented as key effectors in the adipogenic program (Wu et al., 1995, Barak et al., 1999, Linhart et al., 2001, Yang and Chow, 2003, Abella et al., 2005). Our findings that CR increased adiponectin biosynthesis and release into the circulation from terminally-differentiated adipocytes were of significance. During differentiation of preadipocytes into adipocytes adiponectin is increased by more than 100-fold (Fu et al., 2005, Korner et al., 2005), suggesting that this differentiated state is critically important for increased adiponectin. Furthermore, the findings that CR increased the expression of Cdk4 provided further support for CR-induced adipogenesis since disruption of Cdk4 or activating mutations in Cdk4 in primary preadipocytes results in reduced and increased adipogenic potential of these cells, respectively (Abella et al., 2005). Taken together, these findings suggest an important role for adipogenesis in the beneficial effects of CR during aging. In fact, there is no evidence to date to suggest that reduction of adipogenesis per se has any beneficial effects. In contrast, impaired adipogenesis has been reported to be associated with insulin resistance (Heilbronn et al., 2004, Yang et al., 2004), and when adipocytes are absent, as in engineered lipodystrophy, lipids accumulate in muscle, liver and other locations. This is believed to cause significant metabolic derangement, including hyperlipidemia and diabetes in mice (Moitra et al., 1998, Shimomura et al., 1998).
Analysis of C/EBPβ-knockout mice demonstrates important role for C/EBPβ protein in establishing the differentiated phenotypes of several cell types (Screpanti et al., 1995, Tanaka et al., 1995, Sterneck et al., 1997, Mukherjee et al., 2001, Zhu et al., 2002, Grimm et al., 2005, Bagchi et al., 2006), including adipocytes (Chen et al., 2000, Carmona et al., 2005). The potential physiological significance of C/EBPβ-LIP isoform has been demonstrated in a number of studies in which LIP has been found to serve in a signal amplification mechanism, whereby the transcription activation potential of C/EBPβ-LAP isoform increases dramatically when an appropriate LAP/LIP ratio is reached (Descombes and Schibler, 1991), suggesting that the LAP/LIP ratio is more important for target gene expression than the absolute level of LAP or LIP. In liver, the LAP/LIP ratio is relatively low during early postnatal development when cell proliferation is still high, and increases markedly in adult animals as hepatocytes become quiescent (Descombes and Schibler, 1991). These findings suggest that a decreased ratio of LAP/LIP (due to a relative increase in LIP expression) we observed in CR model might contribute to inhibit terminal differentiation and promotes selective growth of preadipocytes (Descombes and Schibler, 1991, Luedde et al., 2004). In primary cultured preadipocytes from rats with different ages, LIP expression was increased with age, which was associated with decreased expression of C/EBPα and PPARγ, whereas the overall level of C/EBPβ was not changed (Karagiannides et al., 2001). Consistently, our results also revealed a slight reduction of PPARγ and significant decrease of C/EBPα expression in adipose tissue during aging. However, we did not find significant age-related changes in relative LIP expression. These discrepancies may be due to the fact that LIP can function as an activator or repressor, depending on its binding partners, i.e. its protein-protein interactions with adjacent DNA-binding or coactivator proteins (Hsieh et al., 1998). This further suggests that different hormonal and metabolic signals govern the regulation of adipogenesis in vitro and in vivo. In fact, the effects of hormones and metabolic factors on adipogenesis in vitro and in vivo have been controversial. In addition to adipongensis, the LAP/LIP ratio appears to be critical in glucose metabolism. In chronic hyperglycemia, the LAP/LIP ratio was increased, which results in an increase of cAMP- and dexamethason-induced phosphenolpyruvate carboxykinase (PEPCK) expression, thereby impairing the repressive effects of insulin (Shao et al., 2005). This hyperglycemia-driven increase in the LAP/LIP ratio was considered to be a critical molecular event involved in the pathogenesis of diabetes. It is reasonable therefore to speculate that low blood glucose observed in CR rats (Zhu et al., 2004) has specific effects on decreased LAP/LIP ratio and function. Future studies are necessary to provide support for this hypothesis.
The insulin/insulin-like signaling has been shown to play an important role in regulating lifespan. Adipose-specific insulin receptor knockout (FIRKO) appears to increase median and maximum lifespan in mice (Bluher et al., 2003), similar to CR models, suggesting that both of the models may represent different mechanisms underlying the effects on lifespan. A strong trend toward a difference may result from the alternative splicing of insulin receptor (IR) molecule. This splicing process can produce two receptor isoforms (IR-α and IR-β) with discrete functional characteristics regarding affinity for insulin, efficiency for transmitting the insulin signals, as well as activating different downstream pathways. The relative abundances of two receptor isoforms are regulated in a tissue- and development-specific manner (Moller et al., 1989, Sesti et al., 1994). During preadipocyte differentiation, the alternative splicing of IR is shifted from isoform α to β (Serrano et al., 2005), consistent with our findings indicating an increased expression of IR-β isoform by western blot in CR rats. Although we have not analyzed the splicing process of IR at a molecular level, our results indicating increased overall expression of the IR mRNA implicated a critical contribution to the altered splicing ratio (Kosaki and Webster, 1993). Therefore, it is not surprised that FIRKO and CR employ different mechanisms underlying longevity since FIRKO mice lack for the IR splicing process due to deletion of IR. In contrast to our previous results (Zhu et al., 2004), some studies have showed that CR did not induce significant changes in pY-IR levels in muscle from both normal and Ames dwarf mice (Argentino et al., 2005). A possible reason might be attributable to a different insulin stimulation time. An over insulin-stimulation might cause pY-IR expression to reach to the saturated level.
Beyond the present findings, there is much to consider regarding the mechanism by which CR elicits adipogenesis. Although many pathways influence adipogenesis in vitro, the importance of these pathways for adipocyte development in vivo has not been tested as assiduously. We speculated that adipose mass may exert a negative feedback on adipogenesis. Unlike enhanced adipogenesis in obesity that is not the cause but the result of energy imbalance (Rosen and MacDougald, 2006), our findings based on morphometric analysis clearly demonstrated heterogeneity of cell size in CR rats, with a shift in size characteristics of the cell population toward small size along with a 73% increase in cell number within an equivalent reference area compared with AL controls. Overall adipose mass in CR rats was obviously less than that in AL controls. It is possible that brief period of disruption or discordance between adipocyte production and apoptosis may occur under certain physiological and pathological conditions. However, our data do not support this hypothesis since we could not find any significant differences in the expression of apoptosis-related markers, such as poly (ADP-ribose) polymerase (PARP), Bcl-2 and Bad, between CR rats and AL counterparts (data not shown). It seems that adipocyte removal through apoptosis may be necessary, but not sufficient for induction of adipogenesis in CR condition.
The induction of preadipocyte differentiation in vivo is influenced by a balance of positive and negative signals (MacDougald and Mandrup, 2002). Nutritional signaling and local signals originating from both preadipocytes and mature adipocytes contribute also to the regulation of adipogenesis (Rosen et al., 2000). Indeed, the effects of these inducers are complex, and data from tissue culture cannot be simply extrapolated to composite adipocytes in vivo. For instance, the earlier studies revealed that efficient differentiation in vitro requires either insulin (Girard et al., 1994) or IGF-1(Schmidt et al., 1990); however, there is scant evidence to support such a role in vivo because both plasma insulin and IGF-1 levels are reduced by CR (Breese et al., 1991, Roth et al., 2001, Zhu et al., 2004), suggesting that the effects of insulin and IFG-1 in vivo might be accommodating rather than stimulatory. Moreover, adipocytes generate feedback signals, including adiponectin and leptin. In contrast to CR-induced increase in adiponectin, our data indicated that both circulating leptin and leptin content in adipose tissue were reduced in CR rats. However, this inverse relationship between adiponectin and leptin was only observed in vivo (Matsubara et al., 2002, Zhang et al., 2002) not in vitro (Korner et al., 2005), suggesting that an indirect mechanism may govern their production and/or secretion. Several lines of evidence have implicated free fatty acids (FFAs) as a potential inducer of adipogenesis. The circulating levels of FFAs, which are derived from lipolysis in adipose tissue, are significantly increased during CR (MacDonald and Webber, 1995, de Cabo et al., 2003). Although the activation of PPARγ occurs through the binding of small lipophilic ligands, mainly fatty acids or fatty acid derivatives derived from nutrition or metabolism (Auwerx, 1999, Rosen et al., 2000), it has not been established whether an increase in circulating FFAs in CR rats would be sufficient to induce higher expression of PPARγ in vivo. In this regard, we speculate that due to limited caloric supply in the CR condition, lipid synthesis and FFAs release may become uninhibited. A prolonged CR diet may increase de novo adipocyte production to keep up with the demand to compensate for limited fuel supply.
In summary, CR, both short-term and long-term, significantly increases the expression of PPARγ, C/EBPβ and Cdk-4 levels, and attenuates age-related decline in C/EBPα expression in white adipose tissue, all of which have been documented as key effectors in adipogenic program. As a result, adiponectin at both mRNA and protein levels is elevated, and thereby results in the activation of target genes involved in fatty acid oxidation and fatty acid synthesis, and renders white adipose tissue more responsive to insulin. These findings support the hypothesis that CR-induced adipogenesis contributes to healthy aging processes. Thus, CR-induced adipogenesis, in terms of increased expression of adipogenic factors, and maintaining the differentiated state of adipocytes, would be critically important to manipulate adipose tissue towards more healthy physiological outcomes during aging.
Acknowledgments
This research was supported by the Intramural Research Program of the National Institute on Aging, NIH
Footnotes
Publisher's Disclaimer: This is a PDF file of an unedited manuscript that has been accepted for publication. As a service to our customers we are providing this early version of the manuscript. The manuscript will undergo copyediting, typesetting, and review of the resulting proof before it is published in its final citable form. Please note that during the production process errors may be discovered which could affect the content, and all legal disclaimers that apply to the journal pertain.
References
- Abella A, Dubus P, Malumbres M, Rane SG, Kiyokawa H, Sicard A, Vignon F, Langin D, Barbacid M, Fajas L. Cdk4 promotes adipogenesis through PPARgamma activation. Cell Metab. 2005;2:239–249. doi: 10.1016/j.cmet.2005.09.003. [DOI] [PubMed] [Google Scholar]
- Agarwal AK, Garg A. Genetic Disorders of Adipose Tissue Development, Differentiation, and Death. Annu Rev Genomics Hum Genet. 2006 doi: 10.1146/annurev.genom.7.080505.115715. [DOI] [PubMed] [Google Scholar]
- Argentino DP, Dominici FP, Munoz MC, Al-Regaiey K, Bartke A, Turyn D. Effects of long-term caloric restriction on glucose homeostasis and on the first steps of the insulin signaling system in skeletal muscle of normal and Ames dwarf (Prop1df/Prop1df) mice. Exp Gerontol. 2005;40:27–35. doi: 10.1016/j.exger.2004.09.005. [DOI] [PubMed] [Google Scholar]
- Auwerx J. PPARgamma, the ultimate thrifty gene. Diabetologia. 1999;42:1033–1049. doi: 10.1007/s001250051268. [DOI] [PubMed] [Google Scholar]
- Bagchi MK, Mantena SR, Kannan A, Bagchi IC. Control of uterine cell proliferation and differentiation by C/EBPbeta: functional implications for establishment of early pregnancy. Cell Cycle. 2006;5:922–925. doi: 10.4161/cc.5.9.2712. [DOI] [PubMed] [Google Scholar]
- Barak Y, Nelson MC, Ong ES, Jones YZ, Ruiz-Lozano P, Chien KR, Koder A, Evans RM. PPAR gamma is required for placental, cardiac, and adipose tissue development. Mol Cell. 1999;4:585–595. doi: 10.1016/s1097-2765(00)80209-9. [DOI] [PubMed] [Google Scholar]
- Berg AH, Combs TP, Scherer PE. ACRP30/adiponectin: an adipokine regulating glucose and lipid metabolism. Trends Endocrinol Metab. 2002;13:84–89. doi: 10.1016/s1043-2760(01)00524-0. [DOI] [PubMed] [Google Scholar]
- Berryman DE, List EO, Coschigano KT, Behar K, Kim JK, Kopchick JJ. Comparing adiposity profiles in three mouse models with altered GH signaling. Growth Horm IGF Res. 2004;14:309–318. doi: 10.1016/j.ghir.2004.02.005. [DOI] [PubMed] [Google Scholar]
- Bertrand HA, Masoro EJ, Yu BP. Increasing adipocyte number as the basis for perirenal depot growth in adult rats. Science. 1978;201:1234–1235. doi: 10.1126/science.151328. [DOI] [PubMed] [Google Scholar]
- Bluher M, Kahn BB, Kahn CR. Extended longevity in mice lacking the insulin receptor in adipose tissue. Science. 2003;299:572–574. doi: 10.1126/science.1078223. [DOI] [PubMed] [Google Scholar]
- Breese CR, Ingram RL, Sonntag WE. Influence of age and long-term dietary restriction on plasma insulin-like growth factor-1 (IGF-1), IGF-1 gene expression, and IGF-1 binding proteins. J Gerontol. 1991;46:B180–187. doi: 10.1093/geronj/46.5.b180. [DOI] [PubMed] [Google Scholar]
- Calkhoven CF, Muller C, Leutz A. Translational control of C/EBPalpha and C/EBPbeta isoform expression. Genes Dev. 2000;14:1920–1932. [PMC free article] [PubMed] [Google Scholar]
- Camp HS, Ren D, Leff T. Adipogenesis and fat-cell function in obesity and diabetes. Trends Mol Med. 2002;8:442–447. doi: 10.1016/s1471-4914(02)02396-1. [DOI] [PubMed] [Google Scholar]
- Carmona MC, Hondares E, Rodriguez de la Concepcion ML, Rodriguez-Sureda V, Peinado-Onsurbe J, Poli V, Iglesias R, Villarroya F, Giralt M. Defective thermoregulation, impaired lipid metabolism, but preserved adrenergic induction of gene expression in brown fat of mice lacking C/EBPbeta. Biochem J. 2005;389:47–56. doi: 10.1042/BJ20050009. [DOI] [PMC free article] [PubMed] [Google Scholar]
- Chen SS, Chen JF, Johnson PF, Muppala V, Lee YH. C/EBPbeta, when expressed from the C/ebpalpha gene locus, can functionally replace C/EBPalpha in liver but not in adipose tissue. Mol Cell Biol. 2000;20:7292–7299. doi: 10.1128/mcb.20.19.7292-7299.2000. [DOI] [PMC free article] [PubMed] [Google Scholar]
- Chihara Y, Rakugi H, Ishikawa K, Ikushima M, Maekawa Y, Ohta J, Kida I, Ogihara T. Klotho protein promotes adipocyte differentiation. Endocrinology. 2006;147:3835–3842. doi: 10.1210/en.2005-1529. [DOI] [PubMed] [Google Scholar]
- Combs TP, Wagner JA, Berger J, Doebber T, Wang WJ, Zhang BB, Tanen M, Berg AH, O’Rahilly S, Savage DB, Chatterjee K, Weiss S, Larson PJ, Gottesdiener KM, Gertz BJ, Charron MJ, Scherer PE, Moller DE. Induction of adipocyte complement-related protein of 30 kilodaltons by PPARgamma agonists: a potential mechanism of insulin sensitization. Endocrinology. 2002;143:998–1007. doi: 10.1210/endo.143.3.8662. [DOI] [PubMed] [Google Scholar]
- Darlington GJ, Ross SE, MacDougald OA. The role of C/EBP genes in adipocyte differentiation. J Biol Chem. 1998;273:30057–30060. doi: 10.1074/jbc.273.46.30057. [DOI] [PubMed] [Google Scholar]
- de Cabo R, Furer-Galban S, Anson RM, Gilman C, Gorospe M, Lane MA. An in vitro model of caloric restriction. Exp Gerontol. 2003;38:631–639. doi: 10.1016/s0531-5565(03)00055-x. [DOI] [PubMed] [Google Scholar]
- Descombes P, Chojkier M, Lichtsteiner S, Falvey E, Schibler U. LAP, a novel member of the C/EBP gene family, encodes a liver-enriched transcriptional activator protein. Genes Dev. 1990;4:1541–1551. doi: 10.1101/gad.4.9.1541. [DOI] [PubMed] [Google Scholar]
- Descombes P, Schibler U. A liver-enriched transcriptional activator protein, LAP, and a transcriptional inhibitory protein, LIP, are translated from the same mRNA. Cell. 1991;67:569–579. doi: 10.1016/0092-8674(91)90531-3. [DOI] [PubMed] [Google Scholar]
- Farnier C, Krief S, Blache M, Diot-Dupuy F, Mory G, Ferre P, Bazin R. Adipocyte functions are modulated by cell size change: potential involvement of an integrin/ERK signalling pathway. Int J Obes Relat Metab Disord. 2003;27:1178–1186. doi: 10.1038/sj.ijo.0802399. [DOI] [PubMed] [Google Scholar]
- Fu Y, Luo N, Klein RL, Garvey WT. Adiponectin promotes adipocyte differentiation, insulin sensitivity, and lipid accumulation. J Lipid Res. 2005;46:1369–1379. doi: 10.1194/jlr.M400373-JLR200. [DOI] [PubMed] [Google Scholar]
- Girard J, Perdereau D, Foufelle F, Prip-Buus C, Ferre P. Regulation of lipogenic enzyme gene expression by nutrients and hormones. Faseb J. 1994;8:36–42. doi: 10.1096/fasebj.8.1.7905448. [DOI] [PubMed] [Google Scholar]
- Gregoire FM. Adipocyte differentiation: from fibroblast to endocrine cell. Exp Biol Med (Maywood) 2001;226:997–1002. doi: 10.1177/153537020122601106. [DOI] [PubMed] [Google Scholar]
- Grimm SL, Contreras A, Barcellos-Hoff MH, Rosen JM. Cell cycle defects contribute to a block in hormone-induced mammary gland proliferation in CCAAT/enhancer-binding protein (C/EBPbeta)-null mice. J Biol Chem. 2005;280:36301–36309. doi: 10.1074/jbc.M508167200. [DOI] [PubMed] [Google Scholar]
- Heilbronn L, Smith SR, Ravussin E. Failure of fat cell proliferation, mitochondrial function and fat oxidation results in ectopic fat storage, insulin resistance and type II diabetes mellitus. Int J Obes Relat Metab Disord. 2004;28(Suppl 4):S12–21. doi: 10.1038/sj.ijo.0802853. [DOI] [PubMed] [Google Scholar]
- Hotta K, Funahashi T, Bodkin NL, Ortmeyer HK, Arita Y, Hansen BC, Matsuzawa Y. Circulating concentrations of the adipocyte protein adiponectin are decreased in parallel with reduced insulin sensitivity during the progression to type 2 diabetes in rhesus monkeys. Diabetes. 2001;50:1126–1133. doi: 10.2337/diabetes.50.5.1126. [DOI] [PubMed] [Google Scholar]
- Hsieh CC, Xiong W, Xie Q, Rabek JP, Scott SG, An MR, Reisner PD, Kuninger DT, Papaconstantinou J. Effects of age on the posttranscriptional regulation of CCAAT/enhancer binding protein alpha and CCAAT/enhancer binding protein beta isoform synthesis in control and LPS-treated livers. Mol Biol Cell. 1998;9:1479–1494. doi: 10.1091/mbc.9.6.1479. [DOI] [PMC free article] [PubMed] [Google Scholar]
- Karagiannides I, Tchkonia T, Dobson DE, Steppan CM, Cummins P, Chan G, Salvatori K, Hadzopoulou-Cladaras M, Kirkland JL. Altered expression of C/EBP family members results in decreased adipogenesis with aging. Am J Physiol Regul Integr Comp Physiol. 2001;280:R1772–1780. doi: 10.1152/ajpregu.2001.280.6.R1772. [DOI] [PubMed] [Google Scholar]
- Kirkland JL, Hollenberg CH, Kindler S, Gillon WS. Effects of age and anatomic site on preadipocyte number in rat fat depots. J Gerontol. 1994;49:B31–35. doi: 10.1093/geronj/49.1.b31. [DOI] [PubMed] [Google Scholar]
- Klipstein-Grobusch K, Reilly JJ, Potter J, Edwards CA, Roberts MA. Energy intake and expenditure in elderly patients admitted to hospital with acute illness. Br J Nutr. 1995;73:323–334. doi: 10.1079/bjn19950033. [DOI] [PubMed] [Google Scholar]
- Korner A, Wabitsch M, Seidel B, Fischer-Posovszky P, Berthold A, Stumvoll M, Bluher M, Kratzsch J, Kiess W. Adiponectin expression in humans is dependent on differentiation of adipocytes and down-regulated by humoral serum components of high molecular weight. Biochem Biophys Res Commun. 2005;337:540–550. doi: 10.1016/j.bbrc.2005.09.064. [DOI] [PubMed] [Google Scholar]
- Korner J, Aronne LJ. The emerging science of body weight regulation and its impact on obesity treatment. J Clin Invest. 2003;111:565–570. doi: 10.1172/JCI17953. [DOI] [PMC free article] [PubMed] [Google Scholar]
- Kosaki A, Webster NJ. Effect of dexamethasone on the alternative splicing of the insulin receptor mRNA and insulin action in HepG2 hepatoma cells. J Biol Chem. 1993;268:21990–21996. [PubMed] [Google Scholar]
- Lindsay RS, Funahashi T, Hanson RL, Matsuzawa Y, Tanaka S, Tataranni PA, Knowler WC, Krakoff J. Adiponectin and development of type 2 diabetes in the Pima Indian population. Lancet. 2002;360:57–58. doi: 10.1016/S0140-6736(02)09335-2. [DOI] [PubMed] [Google Scholar]
- Linhart HG, Ishimura-Oka K, DeMayo F, Kibe T, Repka D, Poindexter B, Bick RJ, Darlington GJ. C/EBPalpha is required for differentiation of white, but not brown, adipose tissue. Proc Natl Acad Sci U S A. 2001;98:12532–12537. doi: 10.1073/pnas.211416898. [DOI] [PMC free article] [PubMed] [Google Scholar]
- Luedde T, Duderstadt M, Streetz KL, Tacke F, Kubicka S, Manns MP, Trautwein C. C/EBP beta isoforms LIP and LAP modulate progression of the cell cycle in the regenerating mouse liver. Hepatology. 2004;40:356–365. doi: 10.1002/hep.20333. [DOI] [PubMed] [Google Scholar]
- MacDonald IA, Webber J. Feeding, fasting and starvation: factors affecting fuel utilization. Proc Nutr Soc. 1995;54:267–274. doi: 10.1079/pns19950053. [DOI] [PubMed] [Google Scholar]
- MacDougald OA, Mandrup S. Adipogenesis: forces that tip the scales. Trends Endocrinol Metab. 2002;13:5–11. doi: 10.1016/s1043-2760(01)00517-3. [DOI] [PubMed] [Google Scholar]
- Masoro EJ. Caloric restriction and aging: an update. Exp Gerontol. 2000;35:299–305. doi: 10.1016/s0531-5565(00)00084-x. [DOI] [PubMed] [Google Scholar]
- Matsubara M, Maruoka S, Katayose S. Inverse relationship between plasma adiponectin and leptin concentrations in normal-weight and obese women. Eur J Endocrinol. 2002;147:173–180. doi: 10.1530/eje.0.1470173. [DOI] [PubMed] [Google Scholar]
- Moitra J, Mason MM, Olive M, Krylov D, Gavrilova O, Marcus-Samuels B, Feigenbaum L, Lee E, Aoyama T, Eckhaus M, Reitman ML, Vinson C. Life without white fat: a transgenic mouse. Genes Dev. 1998;12:3168–3181. doi: 10.1101/gad.12.20.3168. [DOI] [PMC free article] [PubMed] [Google Scholar]
- Mokdad AH, Bowman BA, Ford ES, Vinicor F, Marks JS, Koplan JP. The continuing epidemics of obesity and diabetes in the United States. Jama. 2001;286:1195–1200. doi: 10.1001/jama.286.10.1195. [DOI] [PubMed] [Google Scholar]
- Moller DE, Yokota A, Caro JF, Flier JS. Tissue-specific expression of two alternatively spliced insulin receptor mRNAs in man. Mol Endocrinol. 1989;3:1263–1269. doi: 10.1210/mend-3-8-1263. [DOI] [PubMed] [Google Scholar]
- Mukherjee D, Kaestner KH, Kovalovich KK, Greenbaum LE. Fas-induced apoptosis in mouse hepatocytes is dependent on C/EBPbeta. Hepatology. 2001;33:1166–1172. doi: 10.1053/jhep.2001.24032. [DOI] [PubMed] [Google Scholar]
- Must A, Spadano J, Coakley EH, Field AE, Colditz G, Dietz WH. The disease burden associated with overweight and obesity. Jama. 1999;282:1523–1529. doi: 10.1001/jama.282.16.1523. [DOI] [PubMed] [Google Scholar]
- Rana B, Xie Y, Mischoulon D, Bucher NL, Farmer SR. The DNA binding activity of C/EBP transcription factor is regulated in the G1 phase of the hepatocyte cell cycle. J Biol Chem. 1995;270:18123–18132. doi: 10.1074/jbc.270.30.18123. [DOI] [PubMed] [Google Scholar]
- Rosen ED, MacDougald OA. Adipocyte differentiation from the inside out. Nat Rev Mol Cell Biol. 2006;7:885–896. doi: 10.1038/nrm2066. [DOI] [PubMed] [Google Scholar]
- Rosen ED, Walkey CJ, Puigserver P, Spiegelman BM. Transcriptional regulation of adipogenesis. Genes Dev. 2000;14:1293–1307. [PubMed] [Google Scholar]
- Roth GS, Ingram DK, Lane MA. Caloric restriction in primates and relevance to humans. Ann N Y Acad Sci. 2001;928:305–315. doi: 10.1111/j.1749-6632.2001.tb05660.x. [DOI] [PubMed] [Google Scholar]
- Schmidt W, Poll-Jordan G, Loffler G. Adipose conversion of 3T3-L1 cells in a serum-free culture system depends on epidermal growth factor, insulin-like growth factor I, corticosterone, and cyclic AMP. J Biol Chem. 1990;265:15489–15495. [PubMed] [Google Scholar]
- Screpanti I, Romani L, Musiani P, Modesti A, Fattori E, Lazzaro D, Sellitto C, Scarpa S, Bellavia D, Lattanzio G, et al. Lymphoproliferative disorder and imbalanced T-helper response in C/EBP beta-deficient mice. Embo J. 1995;14:1932–1941. doi: 10.1002/j.1460-2075.1995.tb07185.x. [DOI] [PMC free article] [PubMed] [Google Scholar]
- Serrano R, Villar M, Martinez C, Carrascosa JM, Gallardo N, Andres A. Differential gene expression of insulin receptor isoforms A and B and insulin receptor substrates 1, 2 and 3 in rat tissues: modulation by aging and differentiation in rat adipose tissue. J Mol Endocrinol. 2005;34:153–161. doi: 10.1677/jme.1.01635. [DOI] [PubMed] [Google Scholar]
- Sesti G, Tullio AN, D’Alfonso R, Napolitano ML, Marini MA, Borboni P, Longhi R, Albonici L, Fusco A, Agliano AM, et al. Tissue-specific expression of two alternatively spliced isoforms of the human insulin receptor protein. Acta Diabetol. 1994;31:59–65. doi: 10.1007/BF00570536. [DOI] [PubMed] [Google Scholar]
- Shao J, Qiao L, Janssen RC, Pagliassotti M, Friedman JE. Chronic hyperglycemia enhances PEPCK gene expression and hepatocellular glucose production via elevated liver activating protein/liver inhibitory protein ratio. Diabetes. 2005;54:976–984. doi: 10.2337/diabetes.54.4.976. [DOI] [PubMed] [Google Scholar]
- Shimomura I, Hammer RE, Richardson JA, Ikemoto S, Bashmakov Y, Goldstein JL, Brown MS. Insulin resistance and diabetes mellitus in transgenic mice expressing nuclear SREBP-1c in adipose tissue: model for congenital generalized lipodystrophy. Genes Dev. 1998;12:3182–3194. doi: 10.1101/gad.12.20.3182. [DOI] [PMC free article] [PubMed] [Google Scholar]
- Stefan N, Vozarova B, Funahashi T, Matsuzawa Y, Ravussin E, Weyer C, Tataranni PA. Plasma adiponectin levels are not associated with fat oxidation in humans. Obes Res. 2002;10:1016–1020. doi: 10.1038/oby.2002.138. [DOI] [PubMed] [Google Scholar]
- Sterneck E, Tessarollo L, Johnson PF. An essential role for C/EBPbeta in female reproduction. Genes Dev. 1997;11:2153–2162. doi: 10.1101/gad.11.17.2153. [DOI] [PMC free article] [PubMed] [Google Scholar]
- Suzuki R, Tobe K, Aoyama M, Sakamoto K, Ohsugi M, Kamei N, Nemoto S, Inoue A, Ito Y, Uchida S, Hara K, Yamauchi T, Kubota N, Terauchi Y, Kadowaki T. Expression of DGAT2 in white adipose tissue is regulated by central leptin action. J Biol Chem. 2005;280:3331–3337. doi: 10.1074/jbc.M410955200. [DOI] [PubMed] [Google Scholar]
- Tanaka T, Akira S, Yoshida K, Umemoto M, Yoneda Y, Shirafuji N, Fujiwara H, Suematsu S, Yoshida N, Kishimoto T. Targeted disruption of the NF-IL6 gene discloses its essential role in bacteria killing and tumor cytotoxicity by macrophages. Cell. 1995;80:353–361. doi: 10.1016/0092-8674(95)90418-2. [DOI] [PubMed] [Google Scholar]
- Wang Z, Al-Regaiey KA, Masternak MM, Bartke A. Adipocytokines and lipid levels in Ames dwarf and calorie-restricted mice. J Gerontol A Biol Sci Med Sci. 2006;61:323–331. doi: 10.1093/gerona/61.4.323. [DOI] [PubMed] [Google Scholar]
- Watters JM, Bessey PQ. Critical care for the elderly patient. Surg Clin North Am. 1994;74:187–197. doi: 10.1016/s0039-6109(16)46235-3. [DOI] [PubMed] [Google Scholar]
- Weindruch R, Walford RL, Fligiel S, Guthrie D. The retardation of aging in mice by dietary restriction: longevity, cancer, immunity and lifetime energy intake. J Nutr. 1986;116:641–654. doi: 10.1093/jn/116.4.641. [DOI] [PubMed] [Google Scholar]
- Wu Z, Xie Y, Bucher NL, Farmer SR. Conditional ectopic expression of C/EBP beta in NIH-3T3 cells induces PPAR gamma and stimulates adipogenesis. Genes Dev. 1995;9:2350–2363. doi: 10.1101/gad.9.19.2350. [DOI] [PubMed] [Google Scholar]
- Xiong W, Hsieh CC, Kurtz AJ, Rabek JP, Papaconstantinou J. Regulation of CCAAT/enhancer-binding protein-beta isoform synthesis by alternative translational initiation at multiple AUG start sites. Nucleic Acids Res. 2001;29:3087–3098. doi: 10.1093/nar/29.14.3087. [DOI] [PMC free article] [PubMed] [Google Scholar]
- Yang TT, Chow CW. Transcription cooperation by NFAT.C/EBP composite enhancer complex. J Biol Chem. 2003;278:15874–15885. doi: 10.1074/jbc.M211560200. [DOI] [PubMed] [Google Scholar]
- Yang X, Jansson PA, Nagaev I, Jack MM, Carvalho E, Sunnerhagen KS, Cam MC, Cushman SW, Smith U. Evidence of impaired adipogenesis in insulin resistance. Biochem Biophys Res Commun. 2004;317:1045–1051. doi: 10.1016/j.bbrc.2004.03.152. [DOI] [PubMed] [Google Scholar]
- Yu YH, Zhu H. Chronological changes in metabolism and functions of cultured adipocytes: a hypothesis for cell aging in mature adipocytes. Am J Physiol Endocrinol Metab. 2004;286:E402–410. doi: 10.1152/ajpendo.00247.2003. [DOI] [PubMed] [Google Scholar]
- Zhang Y, Matheny M, Zolotukhin S, Tumer N, Scarpace PJ. Regulation of adiponectin and leptin gene expression in white and brown adipose tissues: influence of beta3-adrenergic agonists, retinoic acid, leptin and fasting. Biochim Biophys Acta. 2002;1584:115–122. doi: 10.1016/s1388-1981(02)00298-6. [DOI] [PubMed] [Google Scholar]
- Zhu M, Miura J, Lu LX, Bernier M, DeCabo R, Lane MA, Roth GS, Ingram DK. Circulating adiponectin levels increase in rats on caloric restriction: the potential for insulin sensitization. Exp Gerontol. 2004;39:1049–1059. doi: 10.1016/j.exger.2004.03.024. [DOI] [PubMed] [Google Scholar]
- Zhu S, Yoon K, Sterneck E, Johnson PF, Smart RC. CCAAT/enhancer binding protein-beta is a mediator of keratinocyte survival and skin tumorigenesis involving oncogenic Ras signaling. Proc Natl Acad Sci U S A. 2002;99:207–212. doi: 10.1073/pnas.012437299. [DOI] [PMC free article] [PubMed] [Google Scholar]