Abstract
The principal aim of the immune system is to establish a balance between defense against pathogens and avoidance of autoimmune disease. This balance is achieved partly through regulatory T cells (Tregs). CD4+CD25+ Tregs are either naturally occurring or induced by antigens and are characterized by the expression of the X-linked forkhead/winged helix transcription factor, Foxp3. Here we report a previously unrecognized subset of CD4+CD25+ Tregs derived from CD4+CD25− T cells induced by nitric oxide (NO). The induction of Tregs (NO-Tregs) is independent of cGMP but depends on p53, IL-2, and OX40. NO-Tregs produced IL-4 and IL-10, but not IL-2, IFNγ, or TGFβ. The cells were GITR+, CD27+, T-betlow, GATA3high, and Foxp3−. NO-Tregs suppressed the proliferation of CD4+CD25− T cells in vitro and attenuated colitis- and collagen-induced arthritis in vivo in an IL-10-dependent manner. NO-Tregs also were induced in vivo in SCID mice adoptively transferred with CD4+CD25− T cells in the presence of LPS and IFNγ, and the induction was completely inhibited by NG-monomethyl-l-arginine, a pan NO synthase inhibitor. Therefore, our findings uncovered a previously unrecognized function of NO via the NO–p53–IL-2–OX40–survivin signaling pathway for T cell differentiation and development.
Keywords: cytokines, inflammation, colitis, collagen-induced arthritis
There is considerable current interest in the functional role of regulatory T cells (Tregs), which subsume the role, if not the characteristics, of the much-maligned suppressor T cells. There are at least three major types of Tregs: Th3, Tr1, and CD4+CD25+ T cells with overlapping functions (1–3). CD4+CD25+ Tregs are arguably the best characterized, principally because it is relatively easy to obtain a large number of cells. The main characteristic of Tregs is the expression of the intracellular X-linked forkhead/winged helix transcription factor, Foxp3 (4–6). Here we report a previously unrecognized subset of Foxp3− CD4+CD25+ Tregs (NO-Tregs) derived from CD4+CD25− T cells and induced by nitric oxide (NO).
NO is a key mediator of a variety of biological functions, such as vascular relaxation, platelet aggregation, neurotransmission, tumoricidal and microbicidal activities, and immunosuppression (7–20). NO also is associated with some of the most important immunopathologies, including rheumatoid arthritis, diabetes, systemic lupus erythematosus, and septic shock (12–14). However, the mechanisms by which NO mediates this spectrum of diseases remain obscure.
NO is derived from the guanidino nitrogen atoms (15) and molecular oxygen (16, 17) in a reaction catalyzed by the enzyme NO synthase (NOS). There are three forms of NOS. The endothelial (eNOS or NOS1) and neuronal (nNOS or NOS3) forms produce the amount of NO required for physiological functions. The cytokine-inducible form (iNOS or NOS2) is activated by a number of immunological stimuli, such as IFNγ, TNFα, and LPS, and catalyzes a high output of NO, which can be cytotoxic. Direct evidence for the critical biological functions of NOS has been provided by strains of mice with disrupted NOS genes (21–23).
We previously reported that NO selectively enhanced type 1 helper T (Th1) cell differentiation and expansion. This process was mediated by enhanced IL-12 receptor β2 expression through a cGMP-dependent pathway (24). Th1 cells are key players in the host immune defense against pathogens, as well as causing a range of autoimmune inflammatory conditions, some of which are NO-dependent. We wondered how this NO-Th1 self-amplification cycle might be regulated. A potential candidate would be Tregs. We now report that NO, together with anti-CD3 [(αCD3) triggering T cell antigen receptor (TcR)] activation, induced the proliferation and sustained survival of CD4+CD25− T cells, which became CD4+CD25+ but remained Foxp3−. The induction process depended on the hitherto unrecognized p53–IL-2–OX40–survivin signaling pathway. This previously unrecognized population of Tregs suppressed the proliferation and function of freshly purified CD4+CD25− effector cells in vitro and colitis- and collagen-induced arthritis in the mouse in an IL-10-dependent manner. Therefore, this report links the functions of NO, p53, and Tregs, three key areas of biomedicine.
Results
NO Enhances Proliferation of CD4+CD25− T Cells.
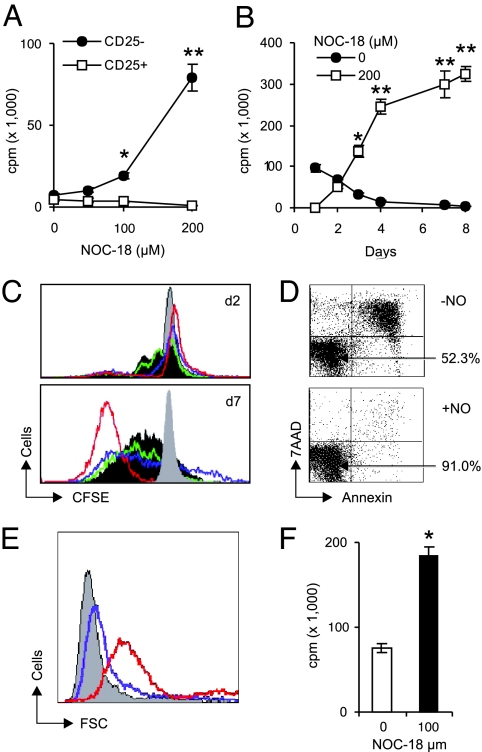
CD4+CD25+ and CD4+CD25− T cells were purified from the lymph nodes of BALB/c mice and were cultured with soluble anti-CD3 (sαCD3) antibody and mitomycin-C-treated spleen cells [as antigen-presenting cells (APC), a culture condition known to be optimal for the suppressive function of Tregs] (25) in the presence of NOC-18 (a stable NO donor). NO had little or no effect on the proliferation of the CD4+CD25+ T cells. In contrast, 100–200 μM NOC-18, which constantly released 200–400 nM NO with a half-life of 20 h (26), markedly enhanced the proliferation, division, and viability of CD4+CD25− T cells (Fig. 1 A–E). There was a transient delay of cell proliferation on day 2. Thereafter, the cells continued to divide, reaching 40× the original number by day 6 and remained up to 95% viable by days 10–14 of culture. Similar results also were obtained with CD4+CD25− T cells from OVA-TcR transgenic mice (DO.11.10) activated with low doses of OVA peptide323–339 and APC (Fig. 1F) and with human peripheral blood CD4+ T cells activated with αCD3 and APC (data not shown). The increase in cell proliferation was effective only when NO was added soon (<6 h) after the TcR activation, but was independent of cGMP [supporting information (SI) Fig. 8 A and B]. NO had to be present for at least 16 h to have a significant effect (data not shown). Similar effects also were obtained with CD8+ T cells (SI Fig. 8C) and with another NO donor, S-nitrosoglutathione (Alexis Laboratories, San Diego, CA) (data not shown). NO alone was without effect (data not shown). Therefore, these results reveal a previously unrecognized function of NO, which, in conjunction with TcR triggering, selectively enhances the differentiation and survival of a population of CD4+CD25− and CD8+ T cells.
Fig. 1.
NO enhanced proliferation, division, and viability of CD4+CD25− T cells. (A) CD4+CD25+ and CD4+CD25− T cells from BALB/c mice were cultured with sαCD3, APC, and the NO donor (NOC-18). Cell proliferation was determined on day 4. (B) The cells in A also were cultured with 200 μM NOC-18, and proliferation was determined from days 1–8. (C) CFSE-labeled CD4+CD25− T cells were cultured with sαCD3, APC, and NO, and cell division was assayed on days 2 and 9 (gray, control without sαCD3 or NO; dark gray, −NO; green, +50; blue, 100; red, 200 μM NOC-18). (D) Cell viability (percentage indicated by arrows) was determined on day 6 with annexin/7-aminoactinomycin D. (E) Cell size was determined by forward cell scattering (gray, −NO; blue, 100; red, 200 μM NOC-18) and propidium iodide staining (78% at G1/G2, 5% S, 2% G2/M, and 15% apoptotic) on day 11. (F) CD4+CD25− T cells from OVA-TcR transgenic mice (DO.11.10) were cultured with 300 nM OVA peptide323–339, APC and 100 μM NOC-18 for 6 days, and proliferation was determined. All results are representative of three experiments, and cell proliferation is expressed as cpm ± SD (n = 3). *, P < 0.05; **, P < 0.01, compared with cultures without NO.
NO-Induced CD4+CD25− T Cell Proliferation Is IL-2- and OX40 Dependent.
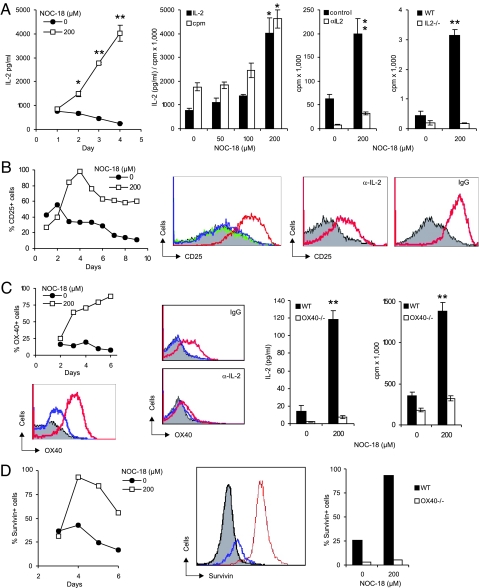
We then characterized the NO-stimulated CD4+CD25− T cells by first examining the cytokines in the supernatant of CD4+CD25− T cells cultured with αCD3 and APC in the presence of NO. IL-4, IFNγ, TNFα, and granulocyte/macrophage colony-stimulating factor were produced in low concentrations (<10 pg/ml) and were not affected by the presence of NO (data not shown). In contrast, IL-2 synthesis was markedly enhanced by the addition of NO in a dose- and time-dependent manner (Fig. 2A). The production of IL-2 closely paralleled the proliferation of CD4+CD25− T cells, suggesting a causal relationship between IL-2 synthesis and cellular differentiation. The NO-induced proliferation of CD4+CD25− T cells depended on IL-2 production, because the effect was completely abrogated by a neutralizing anti-IL-2 antibody and because cells from IL-2−/− mice did not proliferate in response to NO. However, the induction of IL-2 synthesis by NO was transient, peaking at days 3–4, falling back to background level by day 5, and was not detectable by day 7 (SI Fig. 9). No IL-2 synthesis was detected in culture of CD4+CD25+ Tregs similarly activated with NO (data not shown).
Fig. 2.
NO-induced CD4+CD25− T cell proliferation depends on IL-2 and OX40 and associated with survivin. CD4+CD25− T cells from BALB/c mice were cultured for 6 days (unless stated otherwise) as in Figure 1. (A) NO induced IL-2 synthesis in a time- and dose-dependent manner. IL-2 synthesis correlated with cell proliferation. NO-induced T cell proliferation was abrogated by αIL-2 antibody, and IL-2−/− cells (B6 × 129 strain) did not respond to NO. (B) NO induced CD25 expression in a time- and dose-dependent manner and was reduced by αIL-2 (gray, −NO; green, +50; blue, 100; red, 200 μM NOC-18). (C) OX40 was induced by NO in a time- and dose-dependent manner and was inhibited by αIL-2 (color code as in B). CD4+CD25− T cells from OX40−/− mice (B6 × 129 strain) did not produce IL-2 or proliferate when stimulated with NO. (D) NO induced survivin expression in a time- and dose-dependent manner (gray, isotype control; blue, −NO; red, 200 μM NOC-18), and OX40−/− cells did not express survivin in response to NO (day 4). Data are representative of three experiments each. For cpm and IL-2, data are mean ± SD (n = 3). *, P < 0.05; **, P < 0.01, compared with control without NO.
Because IL-2 can induce its own receptor expression (27), we investigated the effect of NO on IL-2Rα (CD25) expression. CD25 expression on CD4+CD25− T cells was induced by NO in a time- and dose-dependent manner. Furthermore, the induction of CD25 expression by NO was markedly reduced by a neutralizing anti-IL-2 antibody (Fig. 2B).
OX40–OX40L interaction has been reported to be a key costimulator for T cell proliferation (28). Therefore, we investigated OX40 expression on CD4+CD25− T cells after NO stimulation in the presence of αCD3 and APC. NO markedly enhanced OX40 expression on CD4+CD25− T cells in a dose- and time-dependent manner. More importantly, CD4+CD25− T cells from OX40−/− mice were not responsive to NO-induced proliferation (Fig. 2C). Furthermore, OX40 expression and IL-2 synthesis were mutually dependent. OX40 expression on CD4+CD25− T cells was inhibited by anti-IL-2 antibody, and cells from OX40−/− mice did not produce IL-2 when stimulated by NO.
OX40 was reported to mediate its proproliferative function via the transcription factor survivin (29). Therefore, we investigated the expression of survivin in CD4+CD25− T cells after NO stimulation in the presence of αCD3 and APC. NO induced survivin expression in CD4+CD25− T cells in a time- and dose-dependent manner (Fig. 2D). Furthermore, NO-induced survivin expression was reduced by anti-OX40L antibody (data not shown), and survivin was not inducible by NO in cells from OX40−/− mice.
Thus, it appears that NO enhances the production of IL-2, which is evident 2 days after NO stimulation. IL-2 then induces IL-2Rα (CD25) expression, which starts 3 days after NO stimulation. IL-2 amplifies cellular proliferation in an autocrine manner via CD25. IL-2 also induces OX40 expression, which appears 3 days after NO stimulation. OX40 contributes to the expanded cells' survival via the induction of survivin.
NO-Induced CD4+CD25− T Cell Proliferation Is p53-Dependent.
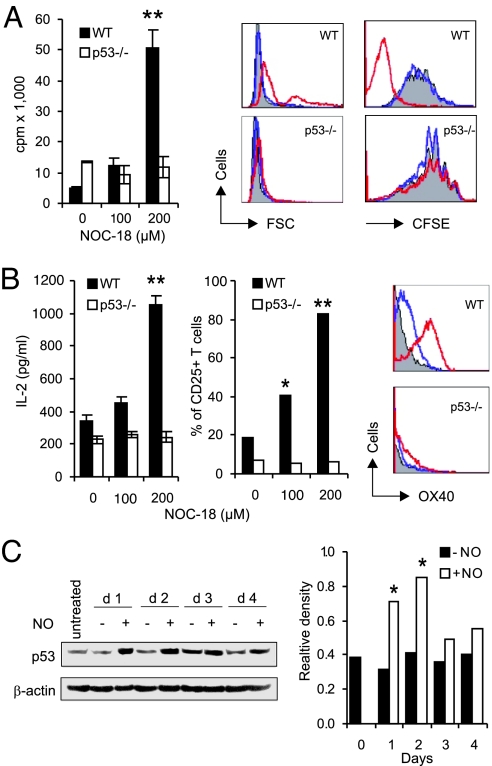
The remarkable proliferation and survival of the blast-like, NO-induced CD4+CD25− T cells prompted us to investigate the potential role of p53, the quintessential tumor-suppressor gene (30). Unexpectedly, CD4+CD25− T cells from p53−/− mice failed to proliferate, differentiate, or form blasts in response to NO in the presence of αCD3 and APC (Fig. 3A). Furthermore, cells from p53−/− mice also failed to produce IL-2 or to express CD25 or OX40 (Fig. 3B). Western blot analysis showed that wild-type CD4+CD25− T cells stimulated with NO expressed enhanced levels of p53 protein from days 1–2 of culture before returning to the basal level (Fig. 3C). Thus, it appears that NO enhances p53 expression, which leads to increased production of IL-2 and the subsequent expression of CD25, OX40, and survivin.
Fig. 3.
NO-induced CD4+CD25− T cell proliferation was p53-dependent. (A) Cells from p53−/− mice (B6 × 129 strain) did not show enhanced proliferation, blast formation (forward scattering), or cell division (CFSE) in response to NO (gray, −NO; blue, 100; red, 200 μM NOC-18). (B) p53−/− cells failed to produce IL-2 or express CD25 or OX40 (color code as in A). (C) Western blot of kinetics of p53 expression induced by NO (200 μM NO-C18) in CD4+CD25− T cells from BALB/c mice. Relative density, p53 vs. β-actin. All data are representative of three experiments. *, P < 0.05; **, P < 0.01, compared with controls without NO.
NO-Tregs Are Foxp3−.
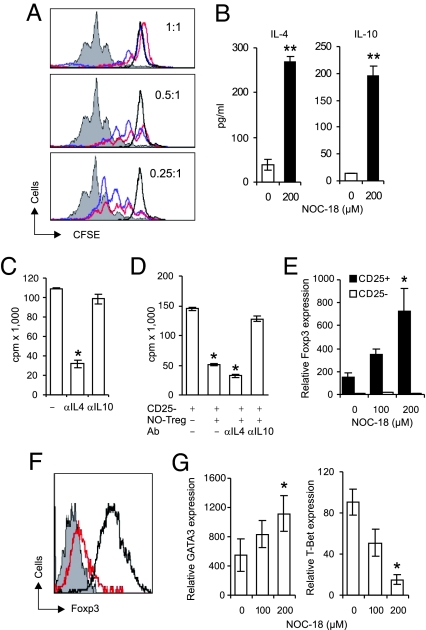
The conversion of CD4+CD25− cells to CD4+CD25+ T cells by NO prompted us to investigate the suppressive function of this population of cells with the Treg phenotype. Freshly purified CD4+CD25− cells (responders) were cocultured with NO-induced CD4+CD25+ T (NO-Tregs) cells or freshly purified CD4+CD25+ T (natural Tregs) cells in the presence of αCD3 and APC. NO-Tregs were as efficient as the natural Tregs in suppressing the responders' differentiation (Fig. 4A). NO-Tregs proliferated in response to restimulation with αCD3 and APC. This proliferation was significantly enhanced by the presence of NO (SI Fig. 10). On restimulation, NO-Tregs produced significant amounts of IL-4 and IL-10 (Fig. 4B) but produced little or no IL-2, TGFβ, or IFNγ (data not shown). The proliferation of NO-Tregs was significantly reduced by anti-IL-4, but not by anti-IL-10 antibody (Fig. 4C). In contrast, the suppressive effect of NO-Tregs on the responder cells was significantly reversed by anti-IL-10, but not by anti-IL-4, antibody (Fig. 4D). This result was confirmed by the finding that NO-Tregs from IL-4−/− mice remained suppressive (SI Fig. 11), whereas NO-Tregs from IL-10−/− mice were not suppressive (SI Fig. 11B). NO-Tregs treated with mitomycin-C also lost their suppressive activity (SI Fig. 11C).
Fig. 4.
NO-Tregs suppressed CD4+CD25− T cell proliferation without expression of Foxp3. (A) CFSE-labeled-CD4+CD25− T cells (responders from BALB/c mice) were cocultured with sαCD3 + APC and a reducing number of freshly purified CD4+CD25+ T cells (natural Tregs) or CD4+CD25− T cells stimulated for 6 days previously with 200 μM NOC-18 (NO-Tregs). Division of the responder cells was assayed by FACS on day 3. (B) NO-Tregs (red) were as efficient as natural Tregs (blue) in suppressing the differentiation of the responders (gray, responders alone; black, responders without sαCD3 or APC). NO-Tregs produced IL-4 and IL-10 and proliferated when restimulated with sαCD3 + APC. (C) The proliferation was blocked by anti-IL-4, but not by anti-IL-10 antibody. (D) However, suppression of the proliferation of the responders by NO-Tregs was reversed by anti-IL-10, but not by anti-IL-4 antibody. (E and F) NO-Tregs did not express Foxp3, whereas natural Tregs showed enhanced Foxp3 expression (E, TaqMan PCR; F, flow cytometry, day 2 culture with sαCD3 + APC; gray, NO-Tregs stained with isotype antibody; red, NO-Tregs; black, natural Tregs stained with αFoxp3 antibody). Similar results were obtained with day 6 cultures (data not shown). (G) NO-Tregs showed enhanced GATA3 and reduced T-bet expression (TaqMan PCR, day-6 cultures). Data are representative of three experiments. *, P < 0.05; **, P < 0.01, compared with control without NO.
Foxp3 expression has been closely associated with the function of Tregs. Therefore, we examined Foxp3 expression in NO-Tregs. Freshly purified CD4+CD25+ and CD4+CD25− T cells from BALB/c mice were cultured with αCD3 and APC for ≤6 days in the presence of NO. Although natural Tregs expressed high levels of Foxp3, which was markedly elevated by the presence of NO, CD4+CD25− T cells did not express detectable levels of Foxp3 with or without the presence of NO (Fig. 4 E and F). NO-Tregs also did not express detectable levels of Foxp3 after restimulation by αCD3 and APC with or without the presence of additional NO (data not shown). In contrast, NO-Tregs expressed enhanced levels of GATA3 (a key Th2 transcription factor) and decreased levels of T-bet (the central Th1 transcription factor) (Fig. 4G). NO-Tregs also expressed GITR, a marker of, among others, natural Tregs (31, 32) and CD27 (recently reported to be a marker of activated human Tregs) (SI Fig. 12) (33). Thus, NO-Tregs have a Th2-like phenotype with no detectable expression of Foxp3, and the suppressive effect is IL-10-dependent.
Induction of NO-Tregs in Vivo.
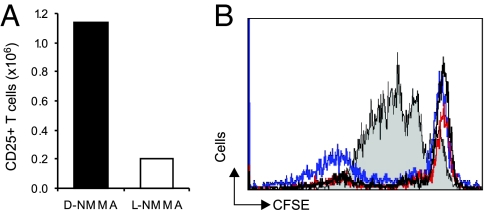
We next investigated the induction of NO-Tregs in vivo. SCID mice were injected i.p. with 4 × 10⁶ CD4+CD25− T cells together with LPS and IFNγ (to generate NO in vivo). The mice were then injected i.p daily for 3 days with the NOS inhibitor NG-monomethyl-l-arginine (NMMA) or the inactive d-NMMA. Mice were killed on day 4; the spleen, lymph nodes, and peritoneal exudates were harvested; and the total number of CD4+CD25+ T cells was counted. Whereas >1.2 × 10⁶ CD4+CD25+ T cells were harvested from mice treated with d-NMMA, <2 × 10⁵ CD4+CD25+ T cells were collected from mice treated with l-NMMA (Fig. 5A). The CD4+CD25+ T cells from mice treated with the control d-NMMA were as efficient as natural Tregs in suppressing the proliferation of effector cells (Fig. 5B). These results demonstrate that NO-Tregs can be generated from CD4+CD25− T cells in vivo by endogenously produced NO.
Fig. 5.
Generation of NO-Tregs in vivo. (A) l-NMMA, but not d-NMMA, prevented the generation of CD4+CD25+ T cells in SCID mice (n = 5) transferred with CD4+CD25− T cells and injected with LPS and IFNγ. (B) Generated NO-Tregs are as suppressive as natural Tregs. Results are representative of two experiments.
NO-Tregs Attenuate Colitis and Collagen-Induced Arthritis (CIA).
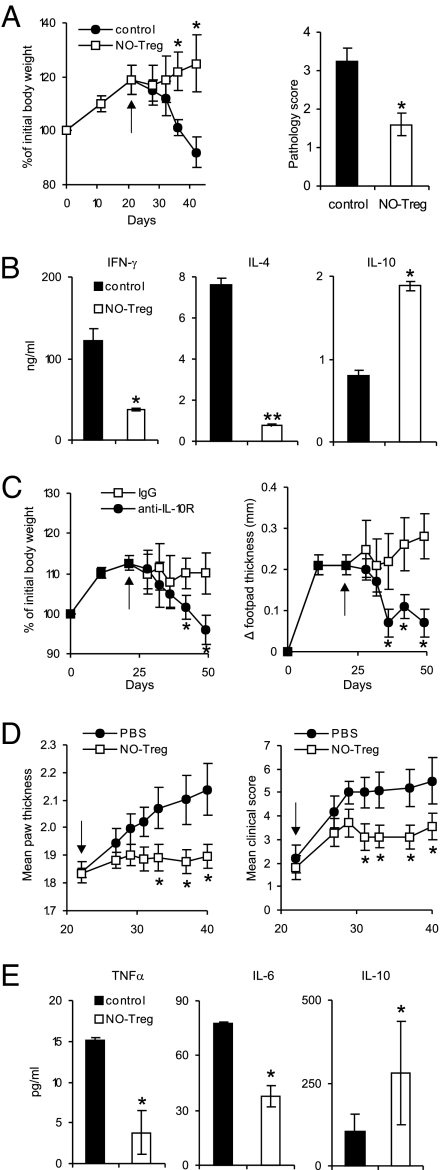
To investigate the function of NO-Treg in vivo, we used two models of murine inflammatory disease, colitis and CIA. SCID mice were reconstituted with CD4+CD25− effector T cells on day 0 and infected in the footpad with the protozoan parasite Leishmania major on day 1 as described in ref. 34. The mice were injected i.p. with NO-Tregs on day 21. Control mice not transferred with NO-Tregs developed colitis from day 14, whereas those treated with NO-Tregs recovered from the disease (Fig. 6A). The therapeutic effect of NO-Tregs in colitis was confirmed by histological examination (SI Fig. 13A). The disease recovery was accompanied by a reduction in IFNγ and IL-4 but also by an increase in IL-10 synthesis (Fig. 6B). The therapeutic effect of NO-Tregs on colitis was reversed by the injection of anti-IL-10R antibody (Fig. 6C). Furthermore, the disease-promoting effect of NO-Tregs on Leishmania infection also was reversed by the anti-IL-10R antibody (Fig. 6C). In the CIA model, DBA/1 mice were immunized with type II collagen (CII) in complete Freund's adjuvent (CFA) and boosted with CII (35) and injected i.p. with NO-Tregs 21 days later. Mice treated with NO-Tregs developed significantly less-severe arthritis compared with the untreated control mice (Fig. 6D). The reduction in disease severity also was evident in histological examination (SI Fig. 13B) and was accompanied by reduced IL-6 and TNFα but with increased IL-10 concentration in the serum (Fig. 6E). Therefore, these results demonstrate that NO-Tregs could cure established inflammatory conditions and that the therapeutic effect is IL-10-dependent.
Fig. 6.
NO-Tregs attenuated colitis and CIA. (A) NO-Tregs reversed the body-weight loss and colon pathology of SCID mice reconstituted with CD4+CD25− T cells. Data are mean ± SD (n = 5) and representative of two experiments. (B) Lymph node cells from NO-Tregs-treated mice (as in A) produced less IFNγ and IL-4 but produced more IL-10 (ELISA of supernatants from day-3 cultures with plate-bound αCD3). (C) The therapeutic effect of NO-Tregs on colitis and the disease-promoting effect of NO-Tregs on leishmaniasis were reversed by anti-IL-10R antibody (for clarity, control group without NO-Tregs is not shown, similar to the αIL-10R group; see A). (D) NO-Tregs attenuated established CIA. Data are mean ± SD (n = 10). (E) Sera from NO-Tregs-treated mice (as in D) produced less IL-6 and TNFα, but produced more IL-10 (ELISA). Arrows indicate day of NO-Tregs injection. *, P < 0.05; **, P < 0.01, compared with control without NO.
Discussion
The heterogeneity of Tregs has recently been recognized. In addition to the naturally occurring Tregs, Tregs are now known to be inducible from CD4+CD25− T cells by specific antigens in humans and mice (36–38). Tregs with a Th1-like phenotype also have been reported (39), whereas Tregs induced by IL-10 mediate their suppressive function in the absence of Foxp3 (40). NO-Tregs reported here represent a previously unrecognized subset of Tregs derived from CD4+CD25− T cells induced by NO together with TcR activation. NO-Tregs are CD4+CD25+, Foxp3−, GITR+, and CD27+, with a Th2 phenotype; they cure inflammatory disease in an IL-10-dependent manner. NO-Tregs are distinct from natural Tregs in that NO-Tregs do not express Foxp3. NO-Tregs also are different from Th3 in that NO-Tregs do not produce TGFβ. NO-Tregs also are distinct from Th2 cells because Th2 are not suppressive against CD4+CD25− effector cells. However, NO-Tregs are akin to Tr1 in that both NO-Tregs and Tr1 are IL-10-dependent but Foxp3-independent. However, NO-Tregs are different from Tr1 in that the induction of NO-Tregs is IL-10-independent.
In agreement with earlier reports (25), natural Tregs did not produce detectable levels of IL-2 and, hence, could not respond to the NO–p53–IL–2 pathway (Fig. 7). This result could explain the selective action of NO on CD4+CD25− T cells, but not on CD4+CD25+ T cells. CD4+CD25− T cells produced large amounts of IL-2 in their initial response to NO and TcR triggering. However, NO-Tregs matured from CD4+CD25− T cells after 6 days culture with NO, and TcR stimulation could no longer produce IL-2. In contrast, NO-Tregs produced substantial levels of IL-4 and IL-10. IL-4 was able to sustain the proliferation of NO-Tregs, which used IL-10 for their suppressive function. The mechanism for the selective induction of IL-4 and IL-10, but not IL-2, by NO on NO-Tregs is currently unknown and merits further investigation. It could well involve the selective modulations of T-bet (41, 42) and GATA3 (43–44), the master switches for Th1 and Th2, respectively.
Fig. 7.
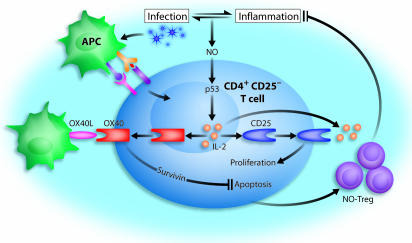
Schematic representation of the induction and function of NO-Tregs. NO can be produced during infection and inflammation, which mutually regulate each other. NO, together with TcR signaling, stabilize p53, which in turn enhances IL-2 synthesis in CD4+CD25− T cells. IL-2 induces IL-2Rα (CD25) expression. Interaction of IL-2 and CD25 enhances cellular proliferation. IL-2 also induces OX40 (CD134) expression, which, when engaged by OX40 ligand (OX40L), leads to the induction of survivin, which prevents apoptosis. The resulting proliferative T cells are immunosuppressive NO-Tregs, which can suppress inflammatory response and, hence, limit potentially damaging autoimmune diseases resulting from the infection.
NO has been reported to prevent apoptosis (45) and to stabilize p53 expression (46). Although p53 is normally associated with suppressing cellular proliferation, overexpression of the p53-dependent gene, Hi95, a member of the sestrin gene family, has been reported to protect cells against hydrogen peroxide-induced apoptosis (47). The observation here that NO-mediated induction of IL-2 is p53-dependent is unexpected, because p53 has been reported to inhibit directly the expression of IL-2 in activated T cells (48). IL-2 is essential for the induction of Tregs (49, 50). In our system, the effect of NO is independent of cGMP. Therefore, it is conceivable that NO, in conjunction with TcR triggering, can reprogram p53 functions, leading to enhanced expression of IL-2 with the subsequent induction of CD25, OX40, and survivin, which increase cellular proliferation and prevent apoptosis (Fig. 7). Thus, our data uncover a previously unrecognized NO signaling pathway in cell differentiation.
To demonstrate the generation of NO-Tregs in vivo, we used SCID mice to avoid the additional effect of natural Tregs. We used LPS to mimic bacterial infection because SCID mice are highly susceptible to infection. IFNγ was administrated to induce NO in vivo. The use of iNOS−/− mice (21–23) is unlikely to show a distinct phenotype because eNOS and nNOS could compensate for iNOS deficiency, and the combined effect of the three NOSs could well be essential for the induction of NO-Tregs. Furthermore, iNOS−/− mice would contain natural Tregs, which would not be separable from NO-Tregs in vivo or ex vivo due to lack of selective cell surface marker. Using a pan NOS inhibitor, l-NMMA, we demonstrated that endogenously generated NO could induce NO-Tregs from highly purified (>99.9%) CD4+CD25− T cells. It is likely that NO-Tregs could be induced under acute infection to fine tune the balance between host defense and autoimmunity. The 200–400 nM dose of NO used is likely to occur in vivo in sites of acute infection and inflammation and has been used routinely in experiments in vitro (18–20). The relatively low production of NO by human macrophages may suggest that the finding could be of limited clinical implication. However, humans do produce substantial amounts of NO, comparable with that of rodents in vivo, perhaps by other inflammatory cells. Thus, it is likely that the findings reported here are equally applicable to humans.
NO-Tregs are effective in treating established experimental inflammation, demonstrating their potential therapeutic value in clinical inflammatory diseases. During acute infections, NO could be produced locally at the site of infection or in the lymphoid organs as a consequence of the production and stimulatory effects of proinflammatory cytokines (such as IFNγ). NO is not only necessary to combat the pathogens but are known to damage host tissues. Thus, it is critical that the excessive immune responses be tightly controlled. The induction of a subpopulation of NO-Tregs may represent an important mechanism to prevent autoimmunity by limiting excessive effector T cell activities (Fig. 7).
Materials and Methods
Further information is presented in SI Materials and Methods.
Cell Cultures and Assays.
CD4+CD25− and CD4+CD25+ T cells were purified from the spleen and lymph nodes of mice by autoMACS (34) and cultured with αCD3 and APC for ≤14 days in the presence of the NO donor NOC-18 with or without αIL-2, αIL-4, and αIL-10 antibodies. Cell proliferation was determined by 3H incorporation and carboxyfluorescein diacetate succinimidyl ester (CFSE) staining. Cell surface markers CD25, OX40, GITR, and CD27 (BD Bioscience, San Jose, CA) and intracellular expression of survivin (Novus Biologicals, Littleton, CO) and Foxp3 (eBioscience, San Diego, CA) were determined by FACS using antibodies as indicated. Expression levels of Foxp3, T-bet, and GATA3 were analyzed by quantitative PCR.
Colitis Model.
The colitis model was carried out as described in ref. 34. SCID mice were infected in the right hind footpad with 1 × 10⁶ stationary-phase Leishmania major (LV39) promastigotes 1 day after receiving i.p. 5 × 10⁵ CD4+CD25− cells. On day 21, SCID mice were injected i.p. with 2.5 × 10⁶ cells per mouse NO-Tregs. In some experiments, mice also were injected i.p. on day 21 with 1 mg of monoclonal anti-IL-10R antibody (DNAX Research Laboratories, Palo Alto, CA) or control rat IgG2a. Mice were monitored for body weight at regular intervals. At the end of the experiment, mice were killed, and draining lymph node cells were harvested and cultured in vitro with immobilized αCD3. Culture supernatant was harvested at 72 h and assayed for cytokines by ELISA.
Arthritis Model.
CIA was induced in DBA/1 mice by intradermal injection of 200 μg of acidified bovine CII (Sigma–Aldrich, St. Louis, MO) emulsified in complete Freund's adjuvant (CFA) (Difco, Detroit, MI) and boosted i.p. with 200 μg of CII in PBS on day 21 as described in ref. 35. On day 21, NO-Tregs (2.5 × 10⁶ per mouse) were injected i.p. Mice were monitored for signs of arthritis, scored (35), and killed on day 40, and sera were collected and assayed for cytokines by ELISA.
Supplementary Material
Acknowledgments
We thank Rod Ferrier and James Reilly for histological slide preparation. This work was supported by the Wellcome Trust, the Medical Research Council, the Arthritis Research Campaign, the Chief Scientist's Office (Edinburgh, Scotland), the European Union, and Ministry of Science and Higher Education of Poland Grants 4PO 5B0 1319 and 2PO 5BO 8527 (to W.N.).
Abbreviations
- APC
antigen-presenting cells
- CIA
collagen-induced arthritis
- CFSE
carboxyfluorescein diacetate succinimidyl ester
- CII
type II collagen
- NMMA
NG-monomethyl- arginine
- NOS
nitric oxide synthase
- TcR
T cell antigen receptor
- Treg
regulatory T cell.
Footnotes
The authors declare no conflict of interest.
This article is a PNAS Direct Submission.
This article contains supporting information online at www.pnas.org/cgi/content/full/0703725104/DC1.
References
- 1.Chen Y, Kuchroo VK, Inobe J, Hafler DA, Weiner HL. Science. 1994;265:1237–1240. doi: 10.1126/science.7520605. [DOI] [PubMed] [Google Scholar]
- 2.Sakaguchi S, Sakaguchi N, Asano M, Itoh M, Toda M. J Immunol. 1995;155:1151–1164. [PubMed] [Google Scholar]
- 3.Groux H, O'Garra A, Bigler M, Rouleau M, Antonenko S, de Vries JE, Roncarolo MG. Nature. 1997;389:737–742. doi: 10.1038/39614. [DOI] [PubMed] [Google Scholar]
- 4.Hori S, Nomura T, Sakaguchi S. Science. 2003;299:1057–1061. [PubMed] [Google Scholar]
- 5.Fontenot JD, Gavin MA, Rudensky AY. Nat Immunol. 2003;4:330–336. [PubMed] [Google Scholar]
- 6.Khattri R, Cox T, Yasayko SA, Ramsdell F. Nat Immunol. 2003;4:337–342. [PubMed] [Google Scholar]
- 7.Moncada S, Palmer RM, Higgs EA. Pharmacol Rev. 1991;43:109–142. [PubMed] [Google Scholar]
- 8.Moncada S, Higgs A. N Engl J Med. 1993;329:2002–2012. doi: 10.1056/NEJM199312303292706. [DOI] [PubMed] [Google Scholar]
- 9.Nathan CF, Hibbs JB., Jr Curr Opin Immunol. 1991;3:65–70. doi: 10.1016/0952-7915(91)90079-g. [DOI] [PubMed] [Google Scholar]
- 10.Liew FY, Cox FE. Immunol Today. 1991;12:A17–A21. doi: 10.1016/S0167-5699(05)80006-4. [DOI] [PubMed] [Google Scholar]
- 11.Marletta MA. J Biol Chem. 1993;268:12231–12234. [PubMed] [Google Scholar]
- 12.Nathan C, Xie QW. Cell. 1994;78:915–918. doi: 10.1016/0092-8674(94)90266-6. [DOI] [PubMed] [Google Scholar]
- 13.Vladutiu AO. Clin Immunol Immunopathol. 1995;76:1–11. doi: 10.1006/clin.1995.1081. [DOI] [PubMed] [Google Scholar]
- 14.Liew FY. Curr Opin Immunol. 1995;7:396–399. doi: 10.1016/0952-7915(95)80116-2. [DOI] [PubMed] [Google Scholar]
- 15.Palmer RMJ, Ashton DS, Moncada S. Nature. 1988;333:664–666. doi: 10.1038/333664a0. [DOI] [PubMed] [Google Scholar]
- 16.Kwon NS, Nathan CF, Gilker C, Griffith OW, Matthews DE, Stuehr DJ. J Biol Chem. 1990;265:13442–13445. [PubMed] [Google Scholar]
- 17.Leone AM, Palmer RM, Knowles RG, Francis PL, Ashton DS, Moncada S. J Biol Chem. 1991;266:23790–23795. [PubMed] [Google Scholar]
- 18.Kim YM, Chung HT, Kim SS, Han JA, Yoo YM, Kim KM, Lee GH, Yun HY, Green A, Li J, et al. J Neurosci. 1999;19:6740–6747. doi: 10.1523/JNEUROSCI.19-16-06740.1999. [DOI] [PMC free article] [PubMed] [Google Scholar]
- 19.Kim YM, Chung HT, Simmons RL, Billiar TR. J Biol Chem. 2000;275:10954–10961. doi: 10.1074/jbc.275.15.10954. [DOI] [PubMed] [Google Scholar]
- 20.Macphail SE, Gibney CA, Brooks BM, Booth CG, Flanagan BF, Coleman JW. J Immunol. 2003;171:4809–4815. doi: 10.4049/jimmunol.171.9.4809. [DOI] [PubMed] [Google Scholar]
- 21.MacMicking JD, Nathan C, Hom G, Chartrain N, Fletcher DS, Trumbauer M, Stevens K, Xie QW, Sokol K, Hutchinson N, et al. Cell. 1995;81:641–650. doi: 10.1016/0092-8674(95)90085-3. [DOI] [PubMed] [Google Scholar]
- 22.Wei XQ, Charles IG, Smith A, Ure J, Feng GJ, Huang FP, Xu D, Mullers W, Moncada S, Liew FY. Nature. 1995;375:408–411. doi: 10.1038/375408a0. [DOI] [PubMed] [Google Scholar]
- 23.Laubach VE, Shesely EG, Smithies O, Sherman PA. Proc Natl Acad Sci USA. 1995;92:10688–10692. doi: 10.1073/pnas.92.23.10688. [DOI] [PMC free article] [PubMed] [Google Scholar]
- 24.Niedbala W, Wei XQ, Campbell C, Thomson D, Komai-Koma M, Liew FY. Proc Natl Acad Sci USA. 2002;99:16186–16191. doi: 10.1073/pnas.252464599. [DOI] [PMC free article] [PubMed] [Google Scholar]
- 25.Sakaguchi S. Annu Rev Immunol. 2004;22:531–562. doi: 10.1146/annurev.immunol.21.120601.141122. [DOI] [PubMed] [Google Scholar]
- 26.Keefer LK, Nims RW, Davies KM, Wink DA. Methods Enzymol. 1996;268:281–293. doi: 10.1016/s0076-6879(96)68030-6. [DOI] [PubMed] [Google Scholar]
- 27.Kim HP, Kelly J, Leonard WJ. Immunity. 2001;15:159–172. doi: 10.1016/s1074-7613(01)00167-4. [DOI] [PubMed] [Google Scholar]
- 28.Salek-Ardakani S, Song J, Halteman BS, Jember AG, Akiba H, Yagita H, Croft M. J Exp Med. 2003;198:315–324. doi: 10.1084/jem.20021937. [DOI] [PMC free article] [PubMed] [Google Scholar]
- 29.Song J, So T, Cheng M, Tang X, Croft M. Immunity. 2005;22:621–631. doi: 10.1016/j.immuni.2005.03.012. [DOI] [PubMed] [Google Scholar]
- 30.Vousden KH, Lu X. Nat Rev Cancer. 2002;2:594–604. doi: 10.1038/nrc864. [DOI] [PubMed] [Google Scholar]
- 31.Shimizu J, Yamazaki S, Takahashi T, Ishida Y, Sakaguchi S. Nat Immunol. 2002;3:135–142. doi: 10.1038/ni759. [DOI] [PubMed] [Google Scholar]
- 32.McHugh RS, Whitters MJ, Piccirillo CA, Young DA, Shevach EM, Collins M, Byrne MC. Immunity. 2002;16:311–323. doi: 10.1016/s1074-7613(02)00280-7. [DOI] [PubMed] [Google Scholar]
- 33.Ruprecht CR, Gattorno M, Ferlito F, Gregorio A, Martini A, Lanzavecchia A, Sallusto F. J Exp Med. 2005;201:1793–1803. doi: 10.1084/jem.20050085. [DOI] [PMC free article] [PubMed] [Google Scholar]
- 34.Liu H, Hu B, Xu D, Liew FY. J Immunol. 2003;171:5012–5017. doi: 10.4049/jimmunol.171.10.5012. [DOI] [PubMed] [Google Scholar]
- 35.Leung BP, Xu D, Culshaw S, McInnes IB, Liew FY. J Immunol. 2004;173:145–150. doi: 10.4049/jimmunol.173.1.145. [DOI] [PubMed] [Google Scholar]
- 36.Zheng SG, Gray JD, Ohtsuka K, Yamagiwa S, Horwitz DA. J Immunol. 2002;169:4183–4189. doi: 10.4049/jimmunol.169.8.4183. [DOI] [PubMed] [Google Scholar]
- 37.Chen W, Jin W, Hardegen N, Lei KJ, Li L, Marinos N, McGrady G, Wahl SM. J Exp Med. 2003;198:1875–1886. doi: 10.1084/jem.20030152. [DOI] [PMC free article] [PubMed] [Google Scholar]
- 38.Walker M, Kasprowicz DJ, Gersuk VH, Benard A, Van Landeghen M, Buckner JH, Ziegler SF. J Clin Invest. 2003;112:1437–1443. doi: 10.1172/JCI19441. [DOI] [PMC free article] [PubMed] [Google Scholar]
- 39.Stock P, Akbari O, Berry G, Freeman GJ, Dekruyff RH, Umetsu DT. Nat Immunol. 2004;5:1149–1156. doi: 10.1038/ni1122. [DOI] [PubMed] [Google Scholar]
- 40.Vieira PL, Christensen JR, Minaee S, O'Neill EJ, Barrat FJ, Boonstra A, Barthlott T, Stockinger B, Wraith DC, O'Garra A. J Immunol. 2004;172:5986–5993. doi: 10.4049/jimmunol.172.10.5986. [DOI] [PubMed] [Google Scholar]
- 41.Szabo SJ, Kim ST, Costa GL, Zhang X, Fathman CG, Glimcher LH. Cell. 2000;100:655–669. doi: 10.1016/s0092-8674(00)80702-3. [DOI] [PubMed] [Google Scholar]
- 42.Finotto S, Neurath MF, Glickman JN, Qin S, Lehr HA, Green FHY, Ackerman K, Haley K, Galle PR, Szabo SJ, et al. Science. 2002;295:336–338. doi: 10.1126/science.1065544. [DOI] [PubMed] [Google Scholar]
- 43.Zheng W, Flavell RA. Cell. 1997;89:587–596. [Google Scholar]
- 44.Lee GR, Fields PE, Flavell RA. Immunity. 2001;14:447–459. doi: 10.1016/s1074-7613(01)00125-x. [DOI] [PubMed] [Google Scholar]
- 45.Melino G, Bernassola F, Knight RA, Corasaniti MT, Nistico G, Finazzi-Agro A. Nature. 1997;388:432–433. doi: 10.1038/41237. [DOI] [PubMed] [Google Scholar]
- 46.Brockhaus F, Brune B. Oncogene. 1999;18:6403–6410. doi: 10.1038/sj.onc.1203058. [DOI] [PubMed] [Google Scholar]
- 47.Budanov AV, Shoshani T, Faerman A, Zelin E, Kamer I, Kalinski H, Gorodin S, Fishman A, Chajut A, Einat P, et al. Oncogene. 2002;21:6017–6031. doi: 10.1038/sj.onc.1205877. [DOI] [PubMed] [Google Scholar]
- 48.Chaudhry S, Freebern WJ, Smith JL, Butscher WG, Haggerty CM, Gardner K. J Immunol. 2002;169:6767–6778. doi: 10.4049/jimmunol.169.12.6767. [DOI] [PubMed] [Google Scholar]
- 49.Papiernik M, de Moraes ML, Pontoux C, Vasseur F, Penit C. Int Immunol. 1998;10:371–378. doi: 10.1093/intimm/10.4.371. [DOI] [PubMed] [Google Scholar]
- 50.Furtado GC, Curotto de Lafaille MA, Kutchukhidze N, Lafaille JJ. J Exp Med. 2002;196:851–857. doi: 10.1084/jem.20020190. [DOI] [PMC free article] [PubMed] [Google Scholar]
Associated Data
This section collects any data citations, data availability statements, or supplementary materials included in this article.


