

Abstract
Proinflammatory cytokines induce both sickness behavior and depression, but their respective neurobiological correlates are still poorly understood. The aim of the present study was therefore to identify in mice the neural substrates of sickness and depressive-like behavior induced by lipopolysaccharide (LPS, 830 μg/kg, intraperitoneal). LPS-induced depressive-like behavior was dissociated from LPS-induced sickness by testing mice either at 6 h (at which time sickness was expected to be maximal) or at 24 h post-LPS (at which time sickness was expected to be minimal and not to bias the measurement of depressive-like behavior). Concurrently, the expression of acute and chronic cellular reactivity markers (c-Fos and FosB/ΔFosB respectively) was mapped by immunohistochemistry at these two time points. In comparison to saline, LPS decreased motor activity in a new cage at 6 but not at 24 h. In contrast, the duration of immobility in the tail suspension test was increased at both 6 and 24 h. This dissociation between decreased motor activity and depressive-like behavior was confirmed at 24 h post-LPS in the forced swim test. LPS also decreased sucrose consumption at 24 and 48 h, despite normal food and water consumption by that time. At 24 h post-LPS, LPS-induced depressive-like behavior was associated with a delayed cellular activity (as assessed by FosB/ΔFosB immunostaining) in specific brain structures, particularly within the extended amygdala, hippocampus and hypothalamus, whereas c-Fos labeling was markedly decreased by that time in all the brain areas at 6 h post-LPS. These results provide the first evidence in favor of a functional dissociation between the brain structures that underlie cytokine-induced sickness behavior and cytokine-induced depressive-like behavior, and provide important cues about the neuroanatomical brain circuits through which cytokines could have an impact on affect.
Keywords: Sickness behavior; depression; tail suspension test; forced swim test; functional neuroanatomy; c-Fos; FosB/ΔFosB; mapping; lipopolysaccharide; cytokines; extended amygdala; hippocampus, mouse
INTRODUCTION
Several features of cytokines-induced sickness behavior overlap with the clinical symptoms of depression (for reviews: Dantzer et al., 1999; Yirmiya, 2000; Leonard, 2001; Castanon et al., 2002; Matthews et al., 2004). These points of convergence include mood and cognitive alterations, behavioral changes such as decreased motor activity, attenuated sensitivity to reward and reduced food intake, alterations in brain monoaminergic neurotransmission (Hirschfeld, 2000) and activation of the hypothalamic-pituitary-adrenal axis (Checkley, 1996). However, there is only partial overlap between cytokine-induced sickness behavior and depression as revealed by longitudinal clinical studies on patients treated by cytokine immunotherapy and showing a chronic activation of the immune system. Whereas all patients responded to first injections of cytokine immunotherapy by sickness symptoms, only one third of them developed major depressive episodes after a few days or several weeks of treatment depending on the cytokines (Capuron et al., 2000; Capuron et al., 2001). Furthermore, pretreatment with the selective serotonin reuptake inhibitor paroxetine had no effect on neurovegetative symptoms such as fatigue and anorexia experienced by patients receiving cytokine immunotherapy (Capuron et al., 2002a) whereas it prevented the occurrence of anhedonia and depressed mood. Taken together, these data indicate that there is a functional dissociation between cytokine-induced sickness behavior and depression.
The mechanisms of the behavioral action of cytokines are usually studied in animals injected with the cytokine inducer lipopolysaccharide (LPS) or with recombinant proinflammatory cytokines (Dantzer, 2001; Konsman et al., 2002). Attempts to assess the neurobiological bases of cytokine-induced depression in animal models have concentrated on LPS or cytokine-induced anhedonia, as assessed by decreased preference for sucrose (De La Garza, 2005), reduced response to rewarding brain stimulation (Anisman et al., 2002) and attenuation of cocaine-induced place preference (Suzuki et al., 1994). Proinflammatory cytokines have also been shown to be able to increase the duration of immobility in the forced swim test (Makino et al., 2000; Yamano et al., 2000; Dunn & Swiergiel, 2005). However, the depressive-like behavior induced by administration of LPS or specific cytokines is confounded in most of these experiments by the profound reduction in motor activity that occurs during the hours following treatment. Based on the clinical evidence showing that depression develops later than sickness in cytokine-treated patients, we decided in the present experiment to assess depressive-like behavior induced by cytokines at a time at which animals had recovered from LPS-induced depression of motor activity. Based on our previous extensive studies on LPS-induced sickness behavior (Dantzer, 2001), we hypothesized that sickness should be maximal at 6 h post-LPS and minimal at 24 h post-LPS whereas LPS-induced depressive-like behavior should still be apparent at 24 h post-LPS. We tested this hypothesis by submitting mice to well-accepted tests of depressive-like behavior including the tail suspension test, the forced swim test and the sucrose consumption test (Cryan et al., 2002, 2005). At the neuroanatomical level, activation of the peripheral innate immune system has already been shown to induce the expression of c-Fos in a rapid and transient manner in a number of brain areas that have been proposed to underlie the different behavioral and metabolic components of cytokine-induced sickness behavior (e.g., Hansen et al., 2000a; Konsman et al., 2000). To determine the neuroanatomical substrates of LPS-induced depressive-like behavior, we decided to map the brain distribution of Delta FosB in addition to c-Fos since this truncated splice variant of FosB is characterized by a long half-life leading to its accumulation during repeated or long lasting stimulation (Nestler et al., 2001). Our results show a partial dissociation in the neural correlates of LPS-induced sickness behavior and depressive-like behavior.
MATERIALS AND METHODS
Animals and treatments
All experiments were performed on 8-weeks old male CD1 Crl:CD-1 (ICR) mice obtained from Charles River or from a colony raised in the laboratory and weighing 35–40 g at the beginning of the experiments. Animals were randomly assigned to treatments, housed individually in polypropylene cages (24 × 14 × 13 cm), and maintained under standard colony conditions on corn cob litter, in a thermoregulated (23 ± 1°C) and humidity (40%) controlled room on a 12:12 hours light/dark cycle (light on from 7.00 AM to 7.00 PM). Food and water were available ad libitum. Mice were handled individually everyday for 10 days before the experiments. All surgical and experimental procedures were performed in accordance with the National Institute of Health (NIH) guidelines, and with the European Communities Council Directive of 24 November 1986 (86/609/EEC) and were approved by the Institutional Animal Care and Use Committees.
LPS was phenol-extracted from Escherichia coli (serotype 0127:B8; RBI/Sigma). On the test day, it was dissolved in sterile endotoxin-free isotonic saline (for LPS) and administered intraperitoneally (i.p.). The dose of LPS (830 μg/kg) was selected on the basis of its ability to induce the full spectrum of sickness (Mormede et al., 2004) and a reliably increase of brain indoleamine 2,3 dioxygenase (IDO) activity, a putative mechanism in the depressive-like behavior induced by LPS (Lestage et al., 2002).
Behavioral experiments
All behavioral experiments were performed during the illuminated part of the cycle (between 9:00 and 12:00 AM), under conditions of dim light and low noise. Behavior was monitored via a video camera and videotaped to be scored later by a trained observer blind to drug treatments, using the “Observer Basic” software (Noldus, Netherlands). Behavioral data (mean ± SEM) were analyzed using a two-way (treatment × time) ANOVA with repeated measurement on the time factor, followed by a post-hoc pair wise multiple comparison procedure using the Bonferroni method if the interaction treatment × time was significant.
Motor activity
The effects of LPS on motor activity were assessed in mice individually placed into either a clean cage similar to the home cage but devoid of bedding litter (tail suspension experiment) or in a larger polypropylene cage (30 × 11 × 12 cm) divided into two communicating compartments that were separated by a plexiglas wall containing a small opening (2.5 × 3 cm) (forced swim experiment). In the first case, the cage was divided into four virtual quadrants and motor activity was measured by counting the number of line crossings and rearings over a five-min period. In the second case, activity was evaluated by counting the number of between-compartments crossings performed by each mouse over a period of 6 minutes and the number of rearings. In both cases, the cage was cleaned thoroughly between each test.
Tail suspension test
The tail suspension test (TST) was conducted in a similar manner as described by Steru et al. (Steru et al., 1985). The mice were taken from their home cage and a small piece of adhesive tape was placed approximately two cm from the tip of the tail. A single hole was punched in the tape and the mice were hung individually for a period of six min on a hook connected to a strain gauge. A computerized system for processing the force exerted on the gauge (Mouse Tail Suspension Package, MED-TSS-MS, Med Associates, St. Albans, VT) allowed to automatically collect and analyze the movements of each individual mouse. The time of immobility was determined after establishing an upper threshold level for each individual mouse that was set precisely at the activity level that would exclude all movements and only encompass immobility. Time below this threshold indicated the time of immobility.
For the purpose of the present experiment, mice received an i.p. injection of either saline (n=12) or LPS (830 μg/kg, n=12) and were immediately returned to their home cage. At 6 or 24 h post-treatment, mice were submitted to the measure of motor activity, returned immediately to their home cage, and tested in the tail suspension test apparatus less than five minutes after. The 6 and 24 h time points were studied at exactly the same time of the light cycle.
Forced swim test
The forced swim test (FST) was conducted as described previously (Porsolt, 2000). Briefly, each mouse was placed individually in a cylinder (diameter: 16 cm; height: 31 cm) containing 15 cm of water maintained at 25 ± 1°C. The water was changed and the cylinders were cleaned thoroughly between testing sessions. Mice were left into the water for 6 minutes and then returned to their home cage. The duration of swimming, climbing and immobility was evaluated during the 5 last minutes of the test. A mouse was judged to be immobile when it stopped struggling and moved only slowly to remain floating in the water, keeping its head above water. Increased duration of immobility of rodents in the FST has been proposed to reflect a state of helplessness that is reduced by antidepressants (Porsolt, 2000).
For the purpose of the present experiment, mice received an i.p. injection of either saline (n=7) or LPS (830 μg/kg, n=14) and were immediately returned to their home cage. Twenty-three hours later, mice were tested in the activity cage. One hour after this measure, mice were submitted to the FST.
Sucrose preference test
This experiment was designed to assess the effect of LPS on the preference for a palatable solution using a two-bottle paradigm in which mice could choose between a bottle of water and a bottle containing a sucrose solution. Blunted sucrose intake in this test has been proposed to reflect impaired sensitivity to reward and to model anhedonia, a core symptom of major depression (Monleon et al., 1995).
During the week preceding the experiment onset, all mice were given daily experience with the test procedure in their home cage to reduce reaction to novelty and to ensure stability of the baseline consumption. Each day, a bottle containing a freshly prepared 2% sucrose solution was juxtaposed to the bottle of water for 12 hours, beginning just at the lights offset. In order to avoid any place preference, the relative location (left or right) of the sucrose bottle was changed whenever intake was measured. Mice were not food and water deprived neither before nor during the test. Fluid consumption (grams) was measured by weighing bottles before and after each test session. As sucrose consumption depends on body weight, this variable was expressed as a percent body weight by calculating the ratio between the amount of sucrose that was consumed and the body weight × 100. The habituation period lasted until a stable sucrose intake level was reached, and the mean volume ingested over the 3 last training sessions was used as baseline value for each mouse. One day after the last training session, mice (n=10 per treatment group) received an i.p. injection of either saline or LPS (830 μg/kg) and their fluid consumption was recorded for 12 hours, starting 1 hour post-treatment, at the beginning of the dark period. The sucrose preference test was then repeated each subsequent night until the response of LPS-treated mice returned to the pre-treatment level.
Functional neuroanatomy experiments
Experimental design
This experiment aimed at analyzing the temporal pattern of LPS-induced brain cell activation. Mice were injected i.p. with 830 μg/kg LPS dissolved in endotoxin-free isotonic saline or with endotoxin-free isotonic saline as control. Mice were then sacrified 6 and 24 hours later (n = 6 for each treatment group).
Choice of markers of cellular reactivity
Immunohistochemistry was used to measure the expression of c-Fos (revealed by antiserum SC52, Santa Cruz Biotechnology, California, USA) as a marker of acute cellular reactivity, and the expression of FosB/ΔFosB (revealed by antiserum SC48, Santa Cruz Biotechnology, California, USA) as a marker of chronic cellular reactivity (see discussion below for more details about these markers). The SC52 antiserum was raised in rabbits against a synthetic peptide corresponding to amino acids 3–16 at the N-terminal of human and mouse c-Fos which does not cross-react with FosB according to the manufacturer’s Western blot analysis. The SC48 antiserum was raised against a synthetic peptide mapping with an internal N-terminal region of mouse FosB which does not cross-react with c-Fos according to the manufacturer’s Western blot analysis. In addition, since the truncated form ΔFosB lacks part of the FosB C-terminal (101 amino acid at the C-terminal region), but is identical to FosB at the N-terminal (Dobrazanski et al., 1991), the SC48 antiserum detects both full-length FosB and ΔFosB (Perrotti et al., 2004).
Tissue preparation
All immunohistochemistry experiments for the study of the expression of c-Fos and FosB/ΔFosB were carried out on tissue fixed with 4% paraformaldehyde (PFA). Immediately after a mild CO2 asphyxia, mice were sacrificed at various time points after treatment by intracardiac perfusion via the ascending aorta of sodium chloride (NaCl 9‰) at 4°C during 5 minutes followed by 100 ml of a 4% PFA solution at 4°C prepared in a 0.2 M phosphate buffer (pH=7.2). Brains were then dissected out and postfixed overnight in 4% PFA at 4°C. Brains were then placed for at least 2 hours in a cryoprotectant solution of 0.01 M phosphate buffer saline (PBS, pH=7.2) containing 20% sucrose, before being frozen into vapors of liquid nitrogen and preserved at −80°C. Free-floating serial coronal cryostat sections (30 μm) were then collected and preserved in 0.01 M PBS at pH=7.2 containing 0.03% sodium azide at 4°C until use.
Immunohistochemistry experiments
For immunohistochemistry, sections were rinsed in 0.01 M PBS at pH=7.2 for 10 min, then placed in 0.01 M PBS at pH=7.2 containing 1% H2O2 in order to inactivate endogenous peroxidases. After rinsing (0.01 M PBS at pH=7.2, 2 × 5 min), sections were preincubated in 0.01 M PBS at pH=7.2/1.5% Triton X100/3% normal donkey serum under agitation for 1 hour at room temperature. Sections were then incubated overnight at room temperature under agitation with the anti-c-Fos or the anti-FosB/ΔFosB primary antibody diluted 1/1000 in 0.01 M PBS at pH=7.2/0.3% Triton X100/0.03% sodium azide. The following day, sections were rinsed (0.01 M PBS, pH=7.2, 3 × 10 min) and incubated under agitation during 2 hours at room temperature with a biotinylated donkey anti-rabbit secondary antibody (Amersham Biosciences, Freiburg, Germany) diluted 1/200 in PBS 0.01M pH=7.2. Sections were rinsed in 0.01 MPBS pH=7.2, 3 × 10 min then incubated 90 min under agitation at room temperature in the ABC complex (Vector Laboratories, Peterborough, UK) diluted 1/200 in 0.01 M PBS at pH=7.2. After rinsing (PBS 0.01 M, pH=7.2, 2 × 10 min), sections were put into TBS 1X (pH=7.6; 3 × 5 min), before being revealed by diaminobenzidine diluted 1/20 in 1X TBS, pH=7.6, in the presence of 60 μl H 2O2 (which catalyses the reaction). Sections were then rinsed into 1X TBS, pH=7.6 (2 × 5 min) and into distilled water (2 × 5 min), then spread out over slides, air dried then and mounted in DePeX.
Data analysis
The anatomical levels and the brain structures of interest are presented in Figure 1 (Paxinos & Franklin, 2001). In a first step, c-Fos and FosB/ΔFosB labeling was semi-quantitatively analyzed by optical microscopy using a Nikon Eclipse E400 microscope and classified according to the number (n) of positive nuclei within a given structure: 0, no labeling; +/−, very few labeling, n < 5; +, few labeling, 5 < n < 25; ++, intense labeling, 25 < n < 50; +++, very intense labeling, 50 < n < 85; ++++, extremely intense labeling, n > 85. In a second step, quantitative measurements for the expression of the proteins c-Fos and FosB/ΔFosB were carried out within specific areas of interest. For this, immunostained sections were examined with a light microscope (Nikon Eclipse E400) and for each area of interest, RGB images were captured and digitized by a high-resolution CCD video camera system (Nikon DXM1200). Adobe Photoshop CS (Adobe Systems Incorporated, CA, USA) was then used to adjust contrast, brightness and to reduce image size into 800 × 640 pixels with a resolution of 300 pixels per inch; RGB images were then converted into 8-bit grayscale images. Therefore, grayscale images of some representative sections were compared with light microscopic views of these same sections before measurements in order to establish which gray levels of the stained profiles corresponded to c-Fos or FosB/ΔFosB immunolabelled nuclei; once established, these threshold parameters remained unchanged throughout the analysis of a particular brain structure. Image analysis and immunolabelled particles counting was performed using a PC version of NIH imaging software (ImageJ 1.33u, NIH, USA). Each grayscale image was first thresholded to the gray levels previously determined and then the number of immunoreactive nuclei was counted into a specific area drawn on the image, which corresponds to a particular brain structure. At least two sections per animal were counted for a given cerebral structure. To eliminate any bias in the selection of the brain analyzed, the brains were sectioned in a serial way that was the same for all the mice. All the brain structures of interest were quantified in their totality and at least two sections per mouse were counted for a given brain structure. Data were expressed as the mean ± SEM number of positive nuclei per surface unit (megapixel²). Statistical analyses were performed on individual raw data by a two-way treatment × time ANOVA, followed by a post-hoc multiple comparison procedure using the Bonferroni method if the interaction treatment × time interaction was significant, in order to compare LPS-induced c-Fos and FosB/ΔFosB expression to control at different time points (6 and 24 hours).
Fig. 1. Anatomical levels and cerebral structures analyzed for the expression of c-Fos and FosB/ΔFosB (adapted from: Paxinos & Franklin, 2001).
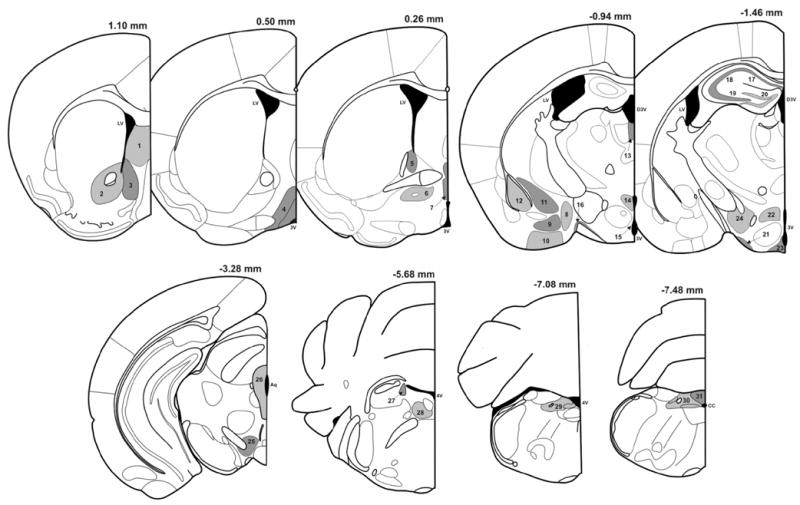
Rostro-caudal anatomical levels used for the analysis of the expression of c-Fos and FosB/ΔFosB and their distance from Bregma in mm. Thirty-one brain areas were semi-quantitatively analyzed: 1, lateral septum; 2, core part of the nucleus accumbens; 3, shell part of the nucleus accumbens; 4, medial preoptic area; 5, dorsal part of the bed nucleus of the stria terminalis; 6, ventral part of the bed nucleus of the stria terminalis; 7, median preoptic nucleus; 8, medial nucleus of the amygdala; 9, basomedial nucleus of the amygdala; 10, anterior cortical nucleus of the amygdala; 11, central nucleus of the amygdala; 12, basolateral nucleus of the amygdala; 13, paraventricular nucleus of the thalamus; 14, paraventricular nucleus of the hypothalamus; 15, periventricular nucleus of the hypothalamus; 16, supraoptic nucleus; 17, field CA1 of the hippocampus; 18, field CA2 of the hippocampus; 19, field CA3 of the hippocampus; 20, dentate gyrus; 21, retrochiasmatic part of the supraoptic nucleus; 22, dorsomedial hypothalamic nucleus; 23, arcuate nucleus; 24, lateral hypothalamic area; 25, ventral tegmental area; 26, periaqueductal gray; 27, locus coeruleus; 28, central gray pons; 29, anterior part of the nucleus tractus solitarius; 30, posterior part of the nucleus tractus solitarius; 31, area postrema. Abbreviations : LV, lateral ventricule;3V, third ventricule; D3V, dorsal part of the third ventricule; Aq, Sylvius aqueduct; 4V, fourth ventricule.
RESULTS
LPS induces depressive-like behavior at 24 h in the absence of any effect on motor activity
Fig. 2A shows the motor activity data in mice submitted to the tail suspension experiment. A two way ANOVA on the number of line crossings showed a significant time × treatment interaction (F1,44 = 6.75, P<0.05). Post-hoc comparison of individual group means revealed that compared to saline LPS decreased the number of line crossings at 6 h (P<0.001) but not at 24 h, and that there were fewer line crossings in the LPS-treated group at 6 than at 24 h (P<0.001). Essentially similar results were obtained for the number of rearings (time × treatment interaction: F1,44 = 14.0, P<0.001).
Figure 2. Depressive-like behavioral effects of LPS in the tail suspension test.
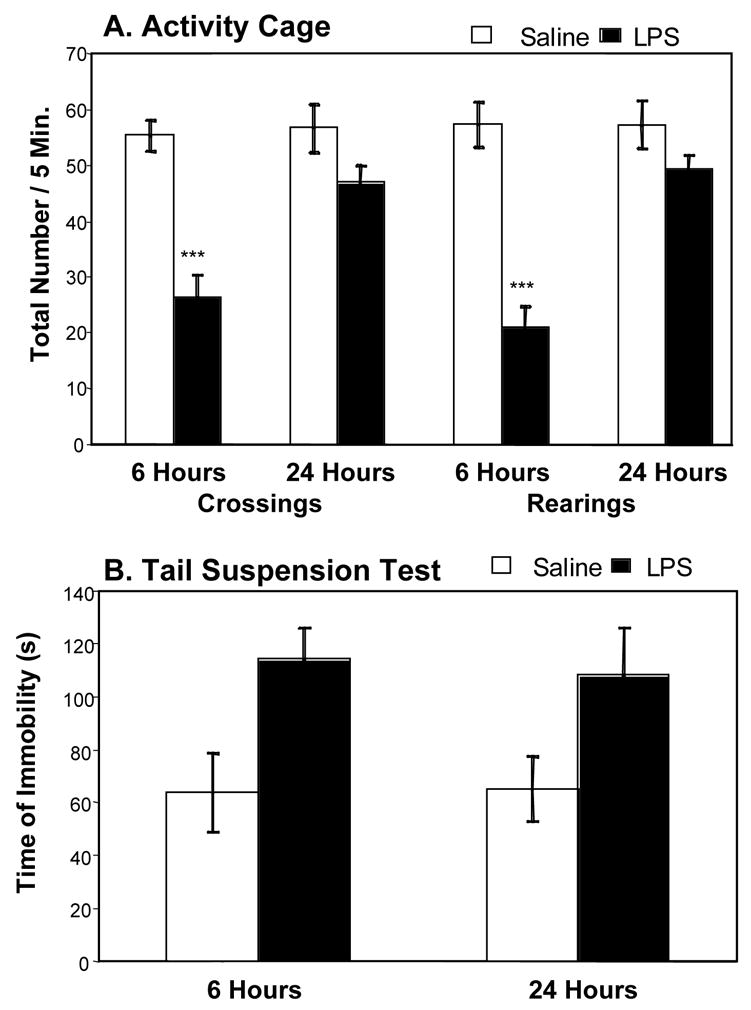
Mice were injected i.p. with either saline (n = 12) or LPS (n = 12). Five and twenty-three hours later, motor activity was assessed by the total number of crossings and rearings performed in an activity cage (A). One hour later, mice were placed into the tail suspension test for 6 minutes and the duration of immobility was measured (B), Bars represent the mean + S.E.M. *** P<0.001 for the effect of treatment (LPS vs. saline).
Fig. 2B show the duration of immobility in mice submitted to the tail suspension test. A two-way ANOVA revealed a significant effect of the treatment (F1,44 = 10.6, P<0.01) but not the time factor nor the treatment × time interaction. LPS-treated mice spent significantly longer time immobile than saline-treated mice. The data collected in the forced swim experiment are represented in Fig. 3 . Behavioral observation only took place at 24 h post-LPS. There was no effect of the treatment (LPS vs. saline) on motor activity, as assessed by the number of crossings and rearings performed in the two-compartment cage (P>0.05) (Fig. 3A). However, the duration of immobility measured in the FST was markedly enhanced in LPS-treated mice (F1,18=9.3, P<0.01) as compared to controls (Fig. 3B). This increase in immobility was associated with a marked reduction of the time spent swimming (F1,18=10.7, P<0.01), whereas the duration of climbing was not significantly altered.
Figure 3. Depressive-like behavioral effects of LPS in the forced swim test.
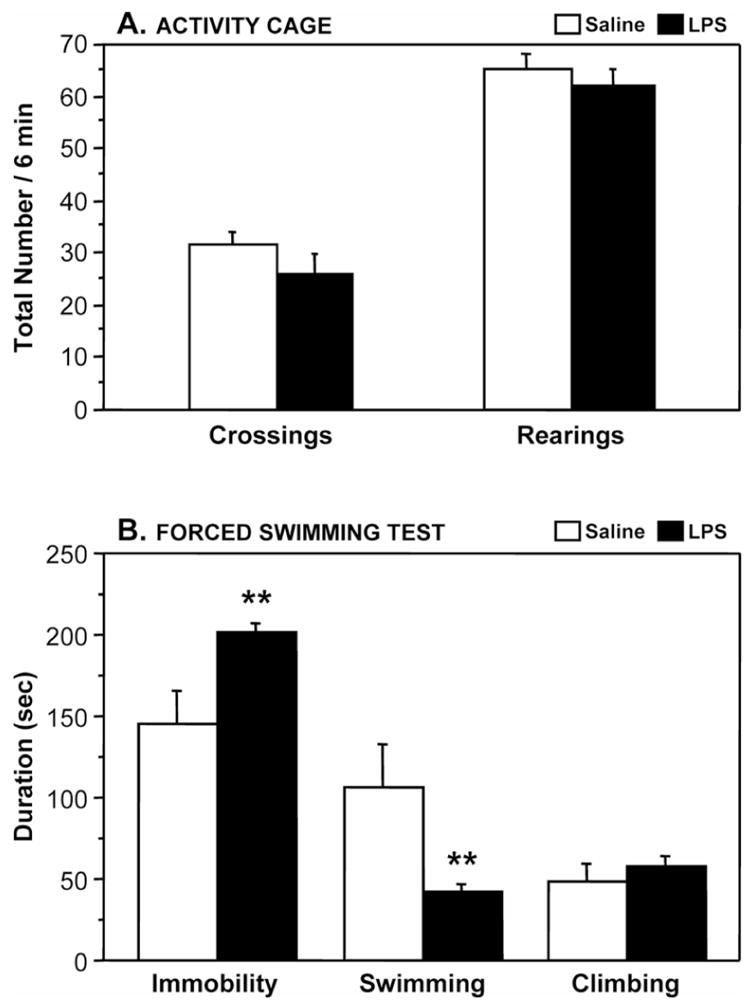
Mice were injected i.p with either saline (n = 7) or LPS (n = 14). Twenty-three hours later, motor activity was assessed by the total number of crossings and rearings performed in the activity cage (A). One hour later, mice were placed into the forced swim test for 6 min and the durations of immobility, swimming and climbing were measured during the last 5 min of the test (B). Bars represent the mean ± SEM. ** P<0.01 for the effect of treatment (LPS vs. Saline).
Fig. 4 shows the time-course of sucrose intake expressed as a percent body weight. At the end of the habituation period and before treatment, sucrose and water intakes were comparable in both the saline and LPS-treated groups. However, sucrose consumption declined as soon as 24 hours after treatment in LPS-treated mice (LPS: F1,54=20.3, P<0.001; time: F3,54=38.4, P<0.001; LPS × time interaction: F3,54=35.1, P<0.001) and it did not reach consumption levels of control mice within 3 days. Indeed, LPS-treated mice clearly drank less sucrose than controls at 24 hours ( P<0.001) and 48 hours (P<0.001) after treatment, but not any longer 72 hours later (P=0.78). Water intake remained unaltered in LPS- compared to saline-treated mice (F1,54=1.1, P>0.3; data not shown).
Figure 4. Depressive-like behavioral effect of LPS in the sucrose preference test.
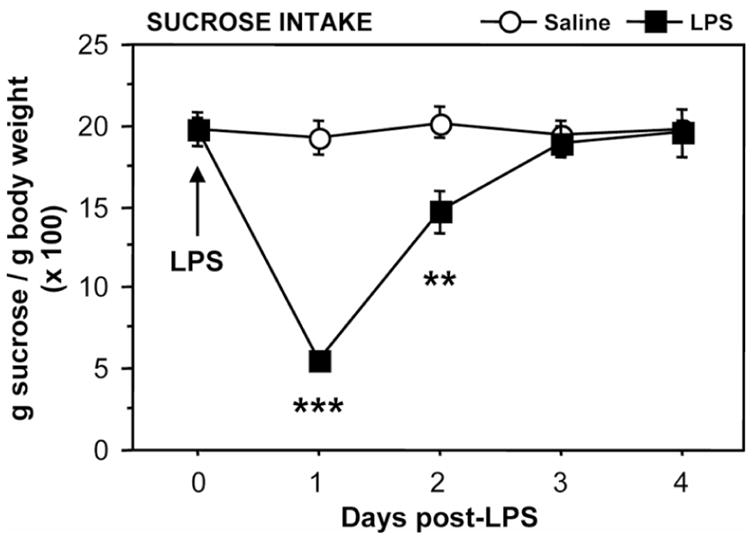
Mice were injected i.p. with either saline or LPS and their relative sucrose intake, expressed as percent bodyweight, was measured overnight during 4 consecutive days post-LPS. Values represent the mean ± SEM of 10 mice/group. ** P<0.01; *** P<0.001 for the effect of treatment (LPS vs. Saline).
Temporal pattern of LPS-induced brain cell reactivity
Mapping of LPS-induced c-Fos expression in the mouse brain over time
Basal levels of c-Fos protein expression were very low in the brain of mice treated with saline 6 and 24 h before euthanasia (Tables 1 and 2, and pictures A, D, G and J in Figs. 5 and 6). There was virtually no staining in any of the brain structures analyzed, except for some sparse labeled neurons within a few hypothalamic or limbic areas (see Table 1 for more details).
Table I. Semi-quantitative analysis of the expression of c-Fos and FosB/ΔFosB in the brain of mice injected with saline or LPS 6 or 24 h before being euthanized.
Thirty-one brain areas (see Fig. 1) were analyzed at various levels from Bregma. Labeling within a given structure was scored according to the number of positive nuclei (n) as 0 (virtually no labeling), +/− (very few labeling, n<5), + (few labeling, 5<n<25), ++ (intense labeling, 25<n<50), +++ (very intense labeling, 50<n<85), ++++ (extremely intense labeling, n>85).
| C-Fos expression
|
FosB/ΔFosB expression
|
|||||||||
|---|---|---|---|---|---|---|---|---|---|---|
| 6H
|
24H
|
6H
|
24 H
|
|||||||
| Cerebral structures | Bregma (mm) | Fig. 1 | Saline | LPS | Saline | LPS | Saline | LPS | Saline | LPS |
| Telencephalon | ||||||||||
| Lateral septum (LS) | 1.10 | 1 | 0 | ++ | 0 | + | + | + | ++ | ++ |
| Nucleus accumbens (Aob) | ||||||||||
| Core (AcbC) | 1.10 | 2 | 0 | 0 | 0 | 0 | +++ | +++ | +++ | +++ |
| Shell (AcbS) | 1.10 | 3 | 0 | +++ | 0 | ++ | +++ | +++ | +++ | +++ |
| Bed nucleus of the stria terminalis (BNST) | ||||||||||
| Dorsal part (BNSTd) | 0.26 | 5 | 0 | +++ | 0 | + | + | + | 0 | +++ |
| Ventral part (BNSTv) | 026 | 6 | +/− | +++ | +/− | ++ | + | + | +/− | ++ |
| Amygdala | ||||||||||
| Medial nucleus (MeA) | −0.94 | 8 | 0 | 0 | +/− | +/− | + | + | ++ | ++ |
| Basomedial nucleus (DMA) | −0.94 | 9 | 0 | 0 | 0 | 0 | + | + | ++ | ++ |
| Anterior cortical nucleus (Aco) | −0.94 | 10 | 0 | 0 | + | + | + | + | ++ | ++ |
| Central nucleus (CeA) | −0.94 | 11 | 0 | +++ | 0 | + | ++ | ++ | ++ | ++++ |
| Base-lateral nucleus (8LA) | −0.94 | 12 | 0 | + | 0 | 0 | ++ | ++ | ++ | ++ |
| Hippocampus | ||||||||||
| CA1 | −1.46 | 17 | 0 | 0 | 0 | 0 | +/− | + | +/− | ++ |
| CA2 | −1.46 | 18 | 0 | 0 | 0 | 0 | +/− | + | +/− | + |
| CAS | −1.46 | 19 | 0 | 0 | 0 | 0 | +/− | + | +/− | ++ |
| Dentate gyrus (DG) | −1.46 | 20 | 0 | 0 | 0 | 0 | +++ | +++ | +++ | +++ |
| Diencephalon | ||||||||||
| Medial preoptic area (MPA) | 0.50 | 4 | +/− | +++ | +/− | + | 0 | 0 | 0 | 0 |
| Median preoptic nucleus (MnPO) | 0.26 | 7 | 0 | ++ | 0 | + | 0 | 0 | 0 | 0 |
| Thalamus | ||||||||||
| Paraventricular nucleus (PV) | −0.94 | 13 | + | +++ | + | ++ | 0 | + | 0 | +++ |
| Hypothalamus | ||||||||||
| Paraventricular nucleus (PVN) | −0.94 | 14 | 0 | +++ | 0 | + | 0 | ++ | 0 | +++ |
| Per/ventricular nucleus (Pe) | −0.94 | 15 | 0 | ++ | 0 | 0 | 0 | + | 0 | + |
| Supraoptic nucleus (SO) | −0.94 | 16 | 0 | ++ | 0 | 0 | 0 | + | 0 | ++ |
| Retrochiasmatic part of the supraoptic nucleus (SOR) | −1.46 | 21 | 0 | ++ | +/− | + | + | ++ | + | +++ |
| Dorsomedial nucleus (DM) | −1.46 | 22 | 0 | +++ | +/− | + | 0 | + | 0 | ++ |
| Arcuate nucleus (Arc) | −1.46 | 23 | 0 | +++ | 0 | ++ | + | ++ | + | +++ |
| Lateral hypothalamic area (LH) | −1 46 | 24 | 0 | ++ | 0 | + | 0 | 0 | 0 | 0 |
| Mesencephalon | ||||||||||
| Ventral teg mental area (VTA) | −3.28 | 25 | 0 | 0 | 0 | 0 | 0 | 0 | 0 | 0 |
| Periaqueductal gray (PAG) | −3.28 | 26 | 0 | +/− | 0 | +/− | + | ++ | + | ++ |
| Metencephalon | ||||||||||
| Locus coeruleus (LC) | −5.68 | 27 | 0 | +++ | 0 | 0 | 0 | 0 | 0 | 0 |
| Central gray pons (CGPn) | −5.68 | 28 | 0 | 0 | 0 | 0 | 0 | 0 | 0 | 0 |
| Myelencephalon | ||||||||||
| Nucleus tractus solitarius (NTS) | ||||||||||
| Anterior part (NTSa) | −708 | 29 | 0 | ++++ | 0 | ++ | 0 | ++ | 0 | ++ |
| Posterior part (NTSp) | −7.48 | 30 | 0 | ++++ | 0 | ++ | 0 | ++ | 0 | ++ |
| Area postrema (AP) | −7.48 | 31 | 0 | +++ | 0 | +/− | 0 | +/− | 0 | +/− |
Table II. Quantification of c-Fos and FosB/ΔFosB expression in brain areas of saline- and LPS-treated mice at 6 and 24 h post treatment (n=6 per group).
Values represent mean ± SEM of the density of immunolabeled nuclei per surface unit. LPS values in bold are significantly different from saline values, as assessed by a 2-way treatment × time ANOVA and post-hoc Bonferoni tests. Percent change between 6 and 24 h was calculated by subtracting the normalized value at 24 h (mean LPS value at 24 h divided by mean Saline value at the same time point) from the normalized value at 6 h (mean LPS value at 6 h divided by mean Saline value at the same time point) and dividing the result by the normalized value at 6 h.
| A | c-Fos expression | |||||
|---|---|---|---|---|---|---|
| 6 hours | 24 hours | |||||
| BRAIN AREAS | Saline | LPS | Saline | LPS | Percent change between 6 and 24 h | |
| Extended Amygdala | ||||||
| - Acbs | 37.6 ± 5.07 | 324 ± 23.4 | 41.9 ± 3.08 | 234 ± 25.9 | − 35 | |
| - BNSTd | 32.5 ± 9.39 | 391 ± 39.7 | 33.6 ±10.0 | 160 ± 12.7 | − 60 | |
| - BSNTv | 23.9 ± 3.96 | 271 ± 36.2 | 28.0 ± 7.82 | 188 ± 16.8 | − 41 | |
| - CeA | 43.3 ± 10.0 | 367 ± 56.3 | 45.9 ± 8.06 | 177 ± 14.3 | − 55 | |
| Hypothalamus | ||||||
| - PVN | 22.8 ± 5.61 | 684 ± 84.3 | 36.7 ± 8.61 | 376 ± 39.9 | − 66 | |
| - ARC | 43.8 ± 5.33 | 579 ± 45.6 | 50.9 ± 10.1 | 388 ± 40.5 | − 42 | |
| NTS | 21.0 ± 2.76 | 750 ± 45.5 | 19.7 ± 2.97 | 308 ± 37.0 | − 56 | |
| B | FosB/ΔFosB expression | |||||
| 6 hours | 24 hours | |||||
| BRAIN AREAS | Saline | LPS | Saline | LPS | Percent change between 6 and 24 h | |
| Extended Amygdala | ||||||
| - Acbs | 472 ± 27.9 | 483 ± 44.4 | 396 ± 22.9 | 720 ± 64.5 | + 78 | |
| - BNSTd | 37.9 ± 3.05 | 123 ± 14.4 | 36.7 ± 6.29 | 403 ± 48.7 | + 237 | |
| - BNSTv | 31.3 ± 5.24 | 74.4 ± 5.31 | 26.7 ± 4.96 | 218 ± 33.5 | + 244 | |
| - CeA | 239 ± 13.8 | 258 ± 16.8 | 232 ± 19.4 | 539 ± 30.4 | + 116 | |
| Hypothalamus | ||||||
| - PVN | 31.3 ± 4.88 | 324 ± 27.5 | 22.0 ± 2.91 | 679 ± 29.8 | + 198 | |
| - Arc | 35.1 ± 2.99 | 182 ± 14.8 | 50.0 ± 6.76 | 279 ± 24.8 | + 7 | |
| NTS | 15.2 ± 1.56 | 278 ± 18.6 | 19.2 ± 2.09 | 440 ± 25.2 | + 26 | |
Figure 5. Photomicrographs illustrating LPS-induced c-Fos immunoreactivity within structures of the extended amygdala.
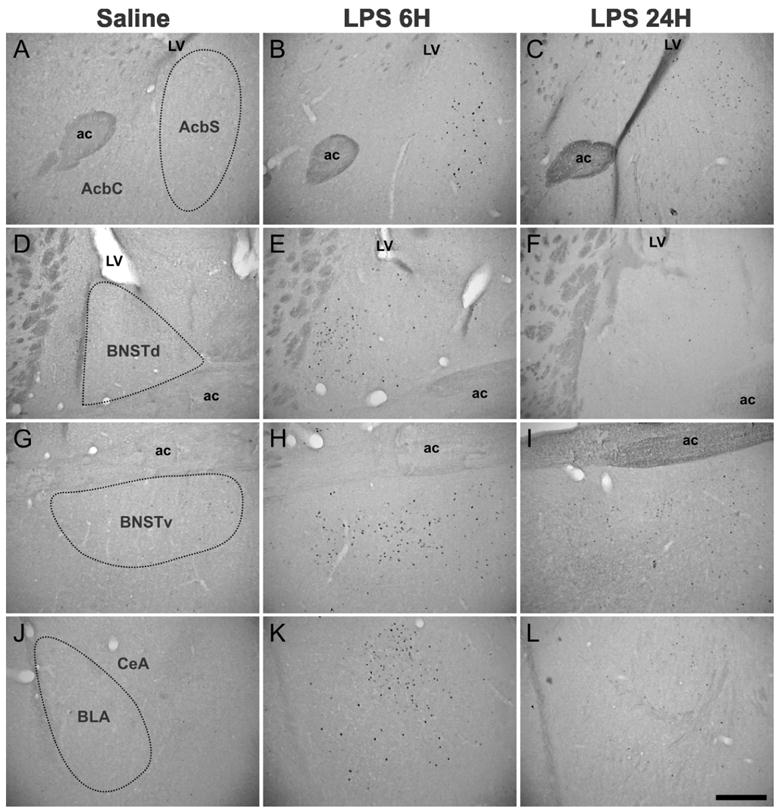
The “saline” pictures where little or no c-Fos immunostaining was detected (A, D, G and J) are representative of saline-treated mice euthanized 6 hours after treatment. C-Fos immunolabeling was increased 6 hours after LPS treatment in the AcbS, BNSTd, BNSTv, CeA and BLA (B, E, H and K), but the expression of c-Fos decreased between 6 and 24 hours (C, F, I and L). Note also that in the Acb, c-Fos induction following LPS was restricted to the shell part and that in the BNSTd, LPS-induced c-Fos immunoreactivity was detected in the lateral and juxtacapsular parts. Abbreviations: ac, anterior commissure; LV, lateral ventricule. Scale bar: 300 μm.
Figure 6. LPS-induced c-Fos immunoreactivity within hypothalamic nuclei.
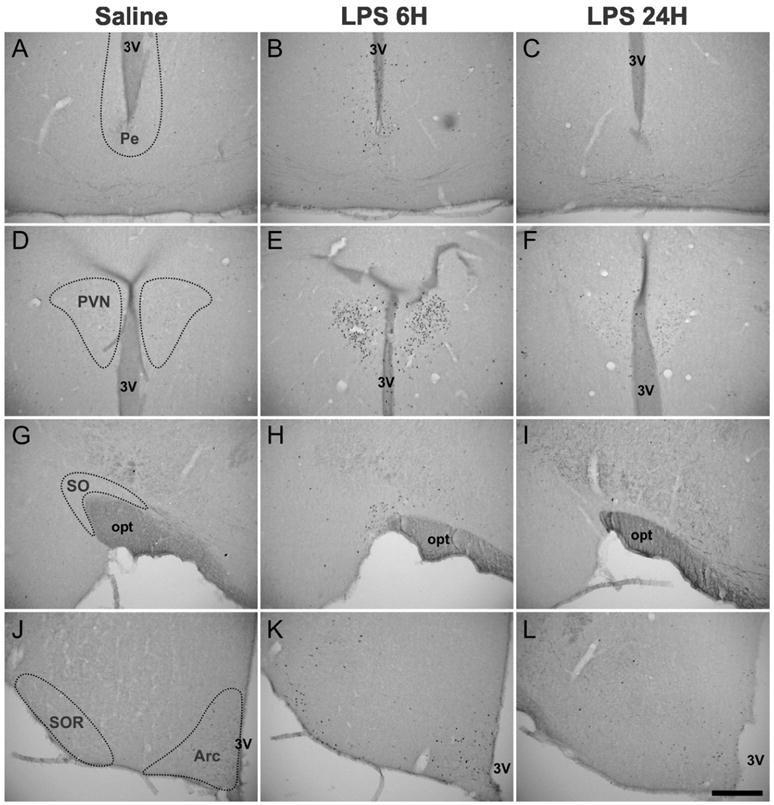
The “saline” pictures where little or no c-Fos immunostaining was detected (A, D, G and J) are representative of saline-treated mice euthanized 6 hours after treatment. C-Fos immunoreactivity was increased 6 hours after LPS treatment in the Pe, PVN, SO, SOR and Arc (B, E, H and K), but decreased between 6 and 24 hours (C, F, I and L). Abbreviations: 3V, third ventricule; opt: optic tract. Scale bar: 300 μm.
Six hours following LPS injection, there was a marked expression of c-Fos within a set of interconnected limbic structures (Tables 1 and 2, and pictures B, E, H and K in Fig. 5). The corresponding brains areas precisely outline the extended amygdala, that includes the shell part of the nucleus accumbens (AcbS), the bed nucleus of the stria terminalis (BNST) and the central nucleus of the amygdala (CeA). While c-Fos expression was not altered within the core part of the nucleus accumbens (AcbC; Fig. 5B) at this time, quantitative analysis (Table 2) showed that c-Fos immunoreactivity was strongly increased in the AcbS (+863%, P<0.001 vs. saline), as well as in the dorsal (BNSTd; Fig. 5E) and ventral (BNSTv; Fig. 5H) parts of the BNST (+1203% for BNSTd and +1137% for BNSTv, P<0.001 vs. saline in both cases). Within the many amygdaloid nuclei, LPS-induced c-Fos expression was very heterogeneous, with no or little labeling in the medial, basomedial, and anterior cortical nuclei (Table 1), and a strong c-Fos induction in the CeA (+848%, P<0.001 vs. control) which was apparent to a lesser extent in the basolateral nucleus (BLA; Fig. 5K). Among the other telencephalic areas analyzed, the lateral septum (LS) also displayed strong increases in c-Fos protein expression, whereas no c-Fos variation was detected in the fields of the hippocampus (Table 1). LPS also induced c-Fos in many parts of the diencephalon (Table 1), including the medial and median preoptic areas (MPA and MnPO respectively), the paraventricular nucleus of the thalamus (PV), the supraoptic nucleus (SO; Fig. 6H) and its retrochiasmatic part (SOR; Fig. 6K). Increases in the density of c-Fos immunolabeled cells were also detected within many other hypothalamic areas, such as in the periventricular (Pe; Fig. 6B) and paraventricular (PVN; Fig. 6E) nuclei, the dorsomedial nucleus (DM), the lateral hypothalamic area (LH), and the arcuate nucleus (Arc; Fig. 6K). Within the PVN and Arc, quantitative analysis revealed a marked increase in c-Fos immunoreactivity (+2994% for PVN and +1321% for Arc, P<0.001 vs. saline in both cases; Table 2). In more posterior brain areas, LPS treatment had no or little effect on c-Fos expression (Table 1), especially within the ventral tegmental area (VTA), periaqueductal gray (PAG) and central gray pons (CGPn). By contrast, noradrenergic nuclei, such as the locus coeruleus (LC) and nucleus of the solitary tract (NTS), displayed a marked increase in c-Fos immunoreactivity. This was also the case for the area postrema (AP). Among all the brain structures analyzed, the NTS was the most LPS-sensitive area since quantitative analysis revealed that this nucleus exhibited the strongest inductions of c-Fos immunoreactivity (+3563%, P<0.001 vs. saline; Table 2).
Twenty-four hours after LPS treatment, c-Fos immunoreactivity was globally lower in all the brain sites that were recruited by 6 hours (Tables 1 and 2, and pictures C, F, I and L in Figs. 5 and 6). Quantitative analysis confirmed that between 6 and 24 hours, c-Fos immunolabeling decreased by 35% in the AcbS, 60% in the BNSTd, 41% in the BNSTv, 55% in the CeA, 66% in the PVN, 42% in the Arc and 56% in the NTS (Table 2). In addition, no structure was newly recruited at this later time point, in comparison with the brain areas that displayed c-Fos immunolabeling at 6 hours post LPS. Nevertheless, some brain areas such as the LS, structures of the extended amygdala (Fig. 5C, F, I and L), the MPA, MnPO, PV, PVN (Fig. 6F), Arc (Fig. 6L), as well as NTS (and also to a lesser extent the SOR, DM and LH) still displayed significant c-Fos labeling 24 hours after LPS. In addition, in the structures quantitatively analyzed, the levels of c-Fos immunoreactivity were still very high relative to saline (+560% in the AcbS, +477% in the BNSTd, +672% in the BNSTv, +385% in the CeA, +1032% in the PVN, +762% in the Arc and +1560% in the NTS, P<0.001 vs. saline in all cases; Table 2). By contrast, the Pe (Fig. 6C), So (Fig. 6I) and LC which were recruited at 6 hours post LPS treatment did no longer exhibit any c-Fos immunolabeling by 24 hours.
Mapping of LPS-induced FosB/ΔFosB immunoreactivity: comparison with c-Fos labeling
Basal levels of FosB/ΔFosB immunoreactivity were somewhat heterogeneous across the structures analyzed (ble 1 and Fig. 7A, C, E, and G), which is in contrast with the low and homogeneous levels of c-Fos immunoreactivity detected in saline-treated mice. Indeed, very high levels of FosB/ΔFosB labeling were detected in specific telencephalic areas such as the LS, Acb (Fig. 7E), amygdala, and dentate gyrus (DG; Fig. 7G) 6 and 24 hours following saline injection, whereas little or no labeling was detected in the other brain structures (see Fig. 7A for NTS, Fig. 7C for PVN and Fig. 7G for CA1 and CA2). Interestingly, the density of FosB/ΔFosB positive nuclei in the AcbS under basal condition reached 472 ± 28 neurons per surface unit 6 hours after LPS, which was higher than LPS-induced c-Fos labeling in the same area (324 ± 23 neurons per surface unit) at the same time point (Table 2).
Figure 7. FosB/ΔFosB immunoreactivity in the NTSa, PVN, Acb and hippocampus.
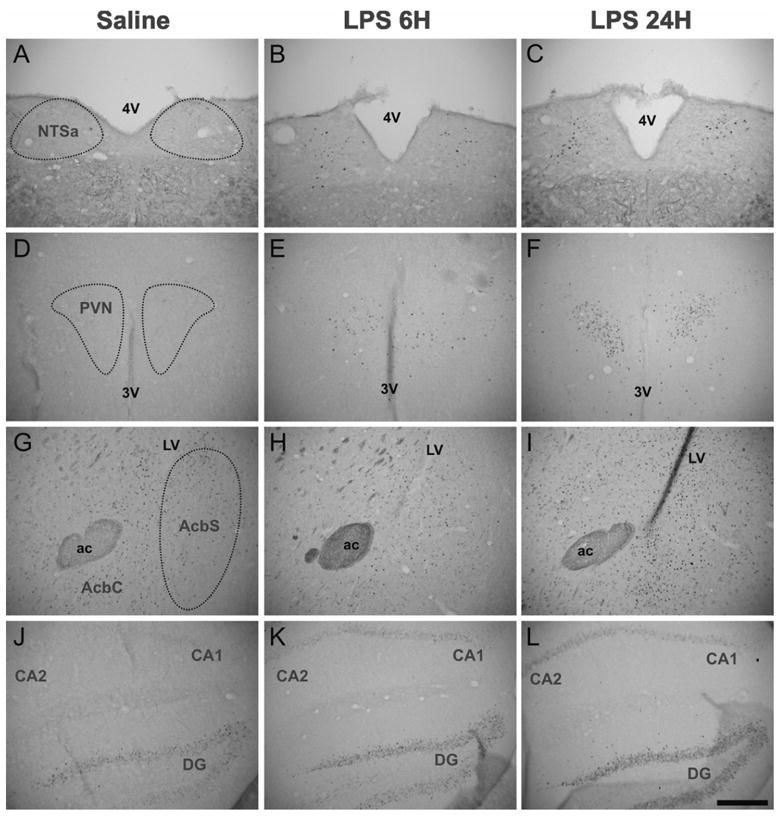
Basal levels of FosB/ΔFosB immunoreactivity were noticeably heterogeneous across the structures analyzed, as little or no FosB/ΔFosB immunostaining could be detected within the NTSa (A), PVN (D), and CA1 and CA2 (J), whereas a high basal staining level was detected within the Acb (G) and DG (J). In the brain structures with a low basal level [NTSa (B and C), PVN (E and F), and CA1 and CA2 (K and L)] as well as in the DG (K and L), LPS treatment induced a time-dependent increase of FosB/ΔFosB immunoreactivity with a maximum expression level at 24 hours after treatment. In contrast, in the Acb (H and I), FosB/ΔFosB expression was significantly increased only at 24 hours after LPS. Abbreviations: 3V, third ventricule; 4V, fourth ventricule; ac, anterior commissure; LV, lateral ventricule. Scale bar: 300 μm.
Tables 1 and 2 and Fig. 8 show that FosB/ΔFosB immunoreactivity was also strongly increased within a subset of the many brain structures which displayed LPS-induced c-Fos expression (i.e., in the Acb and BNST subdivisions, CeA, PV, PVN, Pe, SO, SOR, DM, Arc, NTS and to a lesser extent within the AP). However, no FosB/ΔFosB staining was detected in the MPA, MnPO and LH. In most brain sites analyzed (preoptic areas, hypothalamic areas and NTS) this induction occurred by 6 hours following LPS treatment (P<0.001 vs. saline in the PVN, Arc and NTS) and generally increased after 24 hours (P<0.001 vs. saline in the PVN, Arc and NTS). Table 2 shows that the maximum increase of FosB/ΔFosB immunoreactivity at 24 h post LPS reached +3089% in the PVN (P<0.001), +558% in the Arc (P<0.001) and +2298% in the NTS (P<0.001). The magnitude of this increase differed according to the structure analyzed. The density of FosB/ΔFosB positive nuclei increased by 198% in the PVN, whereas changes in FosB/ΔFosB expression were rather moderate in the Arc and NTS (7 and 26% respectively).
Statistical analysis revealed that FosB/ΔFosB immunoreactivity was not significantly altered by 6 hours after LPS in the structures of the extended amygdala (AcbS, BNST and CeA), but increased by 24 hours (P<0.001 vs. saline in all cases). In the AcbS and CeA, which displayed a strong basal reactivity, induction of FosB/ΔFosB was quite moderate at 24 hours post-LPS (+182% and +232%, P<0.001 in both cases), in comparison with the huge effect observed in the BNSTd (+1099%, P<0.001) and BNSTv (+818%, P<0.001). In addition, LPS treatment induced an increase of FosB/ΔFosB labeling within other brain structures such as in the hippocampus (CA1, CA2, CA3 and DG; Table 1 and Fig. 7J–L) and PAG where there was no variation in c-Fos expression.
DISCUSSION
The results of the present study are in favor of a functional dissociation between the neurobiological mechanisms underlying cytokine-induced sickness behavior and those involved in cytokine-induced depressive-like behavior. These findings are consistent with clinical data showing the delayed development of symptoms of depression on an early background of signs of sickness (Capuron et al., 2000; Capuron et al., 2001). Neuroanatomical methods have already been used to identify the brain areas that are the targets of cytokine action (e.g., Elmquist et al., 1996; Konsman et al., 1999; Konsman et al., 2000). Most of these studies have been carried out at time intervals shorter than 24 h and in the Rat that is the species of choice for neuroanatomical studies. Using mice, we confirm in the present study that c-Fos immunoreactivity is strongly increased by 6 hours in the many brain areas already known to coordinate the behavioral, endocrine and autonomic responses to LPS. In particular, we show here that the NTS is the most LPS-responsive structure, and that several hypothalamic and preoptic areas along with a number of telencephalic structures (LS, AcbS, BNST and CeA) display intense c-Fos induction. However, the neural basis of LPS-induced depressive-like behavior had not yet been established. Inflammatory stimuli have already been shown to induce depressive-like behavior in rodent models of depression (Jain et al., 2001; Anisman & Merali, 2002; 2003; De La Garza, 2005; Dunn & Swiergiel, 2005). Unfortunately, most of these studies were carried out during the few hours that immediately follow LPS or cytokine treatment so that they did not allow discarding the possibility of a confounding effect of sickness. This explains why we took care in the present report to select a time point at which LPS-induced depressive-like behavior was not associated with decreased motor activity. At this time point, LPS-induced c-Fos protein expression tended to decrease and return to baseline in the majority of the brain sites analyzed. Despite this trend c-Fos was still significantly induced within specific brain sites (extended amygdala, preoptic areas, PVN, Arc, and NTS). Furthermore, the use of FosB/ΔFosB as a marker of chronic cellular reactivity revealed the presence of late occurring sustained activity changes in specific brain sites including structures of the extended amygdala and several hypothalamic areas. These structures constitute only a subset of the brain circuitry that displayed intense c-Fos expression 6 hours after LPS. In addition, subdivisions of the hippocampus, which were not recruited in terms of c-Fos immunoreactivity at any time following LPS challenge, displayed increased FosB/ΔFosB immunoreactivity during the depressive-like phase of the response to LPS.
LPS induces depressive-like symptoms in mice
Although the use of rodents model for depression could appear limiting in the present study (Dunn et al., 2005), the development of consistent and reliable behavioral tests modeling different core symptoms of major depression rather than the entire depressive syndrome has provided very useful tools to study the pathophysiology of depression and investigate the potential for new therapies (for review: Cryan et al., 2002). The tail suspension test and the forced swim test are widely used rodent models of depression because of their predictive validity, that is, their ability to identify new antidepressant drugs, based on the reduction of the time mice spent immobile in a helplessness or resignated-like state (Steru et al., 1985; Porsolt, 2000). In the present study, we confirmed that LPS increased the duration of immobility in these two tests. Similar effects had already been reported shortly after treatment with LPS or IL-1 (Jain et al., 2001; Dunn & Swiergiel, 2005), although there are also negative reports (Del Cerro & Borrell, 1990; Deak et al., 2005), probably because of differences in the experimental procedures.
In addition to its ability to increase the duration of immobility in the tail suspension test and the forced swim test, LPS also depressed sucrose consumption in the sucrose preference test. This test models anhedonia, a core symptom of major depressive disorders (Monleon et al., 1995; Shen et al., 1999). The finding that LPS reduced the intake of a palatable solution agrees with previously published data (for review: De La Garza, 2005). Nevertheless, it could still be argued that the appetite suppressing effect of LPS accounts for the decrease in sucrose consumption independently of any anhedonia. However, several data, including ours, argue against this interpretation. Firstly, we observed here that LPS-treated mice displayed blunted sucrose intake up to 48 hours post-treatment, at a time at which food and water consumption was back to normal. Such a dissociation between relatively short-term depressing effects of cytokines on food intake and more sustained anhedonic effects had already been reported in response to chronic IL-2 treatment (Anisman & Merali, 2003) and in mice chronically infected with an IFN-γ adenovector (Kwant & Sakic, 2004). Secondly, our experimental paradigm allowed mice to have free access to food and water before and during the test, which increased the probability that intake of the highly palatable sucrose solution was mostly based on its rewarding properties (Shen et al., 1999; Merali et al., 2003; De La Garza, 2005). Thirdly, the hypothesis that cytokines induce anhedonic-like changes is supported by the fact that chronic antidepressant treatment has already been shown to reverse these effects (Yirmiya, 1996; Sammut et al., 2002). Fourthly, LPS treatment also abolished the reinforcing effect of cocaine in a conditioned place preference paradigm (Suzuki et al., 1994), increased intracranial self-stimulation thresholds, indicating a reduction in the reward produced by the electric stimulation of the lateral hypothalamic area (Borowski et al., 1998), and reduced sexual behavior (Avitsur & Yirmiya, 1999). These results also argue against the possibility of a reduced gustatory discrimination in LPS-treated animals as an explanation for reduced sucrose preference.
All these data point to the ability of LPS to induce depressive-like behavior independently of its sickness inducing properties.
LPS induces delayed cellular activities in the extended amygdala, hippocampus and hypothalamus which parallel the development of depressive-like behavior
Functional significance of c-Fos and FosB/ΔFosB protein expression
The analysis of immediate-early genes (IEGs) is commonly used for assessing neuronal reactivity. IEGs are inducible transcription factors which tightly control the expression of other genes coding for essential proteins involved in the neuronal response to several stimuli. Until now, members of the c-fos family have largely been studied to map in situ the cerebral structures recruited following various types of stimulation (for reviews: Morgan & Curran, 1995; Herdegen & Leah, 1998; Kovacs, 1998). Among the members of this family, the protein c-Fos (55 kDa), coded by the c-fos gene, is induced between 1 and 3 hours after an acute stimulation, and it has a half-life of 2 hours. The FosB protein (46/48 kDa) is a product of the fosB gene and its half-life is of approximately 9 hours. The expression of c-Fos and FosB desensitizes across time (Nestler et al., 1999; Perrotti et al., 2004). The fosB gene also codes for various splice variants, among which the stable protein ΔFosB (33 kDa) that is generally induced by 6 hours following stimulation (Nestler et al., 2001). ΔFosB also possesses a half-life much longer than the other members of the c-fos family and accumulates in cells up to one month. The ΔFosB protein is induced by several chronic experimental conditions (Chen et al., 1997; McClung et al., 2004) such as prolonged exposure to drugs of abuse (Nestler et al., 1999; Nestler et al., 2001), stressors (Perrotti et al., 2004), or antipsychotic drugs (Atkins et al., 1999; Rodriguez et al., 2001). Although seemingly paradoxical, the observation in saline-treated mice of a relatively high expression of FosB/ΔFosB within a few specific brain areas (Acb, amygdala and hippocampus), especially when compared with the very low basal levels of c-Fos expression had already been made in other studies. High levels of ΔFosB expression were for instance observed under basal conditions within the Acb as well as in cortical areas (Rodriguez et al., 2001; Perrotti et al., 2004). Given the fundamental role of ΔFosB in mediating long-term adaptations in the brain (Nestler et al., 1999), this phenomenon can be easily explained since these telencephalic brain areas continuously integrate multimodal interoceptive and exteroceptive sensory information.
There is no one-to-one relationship between IEGs expression and the firing rate of neurons even though there may be a good correlation in some brain areas in response to different types of stimuli including cytokines. For instance, the electrophysiological activity of LC neurons is increased following an acute immune challenge (Borsody & Weiss, 2002; 2004; 2005). Accordingly, we show in the present study that the LC displays intense c-Fos labeling 6 hours following LPS injection. The absence of c-Fos immunoreactivity in a given brain area does not exclude a particular cell or group of cell nuclei participation in the physiological response of interest since inhibitory responses are normally not associated with c-Fos induction (Chan et al., 1993; Kovacs & Sawchenko, 1993; Kovacs, 1998). Also, a decrease in the number of neurons displaying c-fos gene expression in a given structure does not necessarily mean that the neuronal population is inhibited since this decrease can be accounted for by the activation of only a few neurons in this population (Frenois et al., 2005b). Despite these limitations, the analysis of IEGs expression remains an useful tool for extensively mapping the neural pathways whose activity is acutely and chronically modified during LPS challenge.
Potential mechanisms for LPS-induced transient and sustained brain reactivity
LPS-induced sickness behavior is triggered by central actions of proinflammatory cytokines which are transiently expressed within the brain in response to peripherally released cytokines (for reviews: Konsman et al., 2002; Dantzer, 2004). Subdiaphragmatic section of the vagus nerves (Hansen et al., 2000a; Konsman et al., 2000) together with extensive c-Fos imaging (Konsman et al., 2000) have revealed that the vagal sensory pathway along with its primary (NTS) and secondary (extended amygdala and some hypothalamic structures) projection areas are strongly involved in the behavioral responses to cytokines. The transient pattern of c-Fos protein induction that was observed in the present study is in total agreement with the already available data on the mechanisms of action of cytokines in the brain and in particular the normalization of the LPS-induced expression of brain cytokines within a few hours (Laye et al., 1994; Castanon et al., 2004). Since LPS-induced depressive-like behavior occurred much later and lasted much longer than these early events, it is probably not caused directly by proinflammatory cytokines. LPS-induced depressive-like behavior is more likely to be mediated by other neurobiological processes that are recruited as a consequence of the increased expression of proinflammatory cytokines. This hypothesis is strengthened by the present set of neuroanatomical results that show that despite some spatial overlap, distinct temporal patterns of brain reactivity are associated with LPS-induced sickness behavior at 6 h and depressive-like behavior at 24 h post-LPS respectively.
Correlation with behavioral data and functional outcomes
The extended amygdala, which showed LPS-induced sustained cellular reactivity, as assessed by increases in c-Fos and FosB/ΔFosB expression, is a clearly-defined anatomical and functional entity which includes a set of interconnected subcortical limbic brain areas (for review: Alheid, 2003). Dysfunction of the extended amygdala has been proposed to be responsible for the pathophysiology of several neuropsychiatric disorders such as addiction and depression, that are both characterized by cognitive, emotional and motivational alterations (Liotti & Mayberg, 2001; Cardinal et al., 2002; Nestler et al., 2002; Frenois et al., 2005a). Typically, the central division of the extended amygdala encompasses the central nucleus of the amygdala (CeA), the dorsolateral part of the BNST (BNSTd) and the medial shell part of the nucleus accumbens (AcbS), which is considered as an anterior extension of the central extended amygdala (Alheid & Heimer, 1988; 1996; Heimer et al., 1997a; Heimer et al., 1997b). All of these limbic basal forebrain areas exhibit significant accumulation of FosB/ΔFosB 24 hours post-LPS which means that these structures could mediate LPS-induced depressive-like behavior.
A delayed and sustained increase of FosB/ΔFosB immunoreacitvity also took place in all the subdivisions of the hippocampus (CA1, CA2, CA3 and DG) in response to LPS. These original results are in accordance with the observation that cytokines impair normal hippocampus functioning. LPS triggers an increase of IL-1 β within the hippocampus (Laye et al., 1994; Hansen et al., 2000b) which is independent of the vagal pathway (Hansen et al., 2000b). This LPS-induced IL1-β expression is responsible for a sustained increase in GABAergic inhibition in hippocampal CA1 pyramidal neurons (Hellstrom et al., 2005). Cytokines also decrease the number of functional NMDA receptors in the hippocampus (Rosi et al., 2004) and the expression of Arc, an IEG involved in synaptic plasticity (Rosi et al., 2005). In addition, neurotoxic processes within the hippocampus have been linked to depression (Sheline et al., 1999; Bremner et al., 2000) and the activation of glial cells that produce proinflammatory cytokines and neurotoxic factors such as free radicals and nitric oxide during inflammation is known to promote alterations in synaptic plasticity and neuronal cell death (for review: Allan & Rothwell, 2001). Altogether, these data favor a possible role of the hippocampus in LPS-induced depressive-like behavior.
Although not considered in the present study, LPS-induced depressive-like behavior is probably related to the profound effects of peripheral immune activation on brain neurotransmission (e.g., Dunn et al., 1999) and HPA axis activity (for review: Besedovsky & Del Rey, 1996). A possible pathophysiological mechanism for the delayed LPS-induced depressive-like behavior is the activation of the indoleamine 2,3 dioxygenase (IDO) enzyme. This tryptophan catabolizing enzyme is potently induced by cytokines in primary cultures of monocytes, macrophages and brain microglia, leading to a decrease of the bioavailability of tryptophan for serotonin synthesis (Capuron et al., 2002b; Capuron & Dantzer, 2003; Wichers & Maes, 2004) and the generation of potentially neurotoxic tryptophan metabolites such as 3-hydroxykynurenine and quinolinic acid (Stone, 2001; Wichers et al., 2005). In accordance with this hypothesis, we have already shown that LPS-induced IDO activation is a late event that peaks at 24 h post-LPS (Lestage et al., 2002). The impact of this enzymatic activation on brain serotoninergic activity, and its potential implication in the enhanced depressive-like behavior displayed by LPS-treated mice, are currently under study.
Conclusion
In the present report, we demonstrate that LPS can induce depressive-like behavior independently of any change in motor activity. This depressive-like behavior is associated with a sustained cellular reactivity in the extended amygdala, hippocampus and hypothalamus. Although only correlative, these findings are highly suggestive of a dissociation in the neurobiological mechanisms that underlie LPS-induced sickness from those involved in the depressive-like behavioral response to activation of the innate immune system.
Acknowledgments
M. Moreau was supported by a predoctoral fellowship from the FRM (Fondation pour la Recherche Médicale). This study was funded by NIMH (R01 MH-71349 and MH-079829 to RD), INRA, CNRS, Région Aquitaine, and the French Ministry of Research (ACI “Neurosciences Intégratives et Computationnelles” to NC).
ABBREVIATIONS
- FST
forced swim test
- IDO
indoleamine 2,3 dioxygenase
- IEGs
immediate-early genes
- LPS
lipopolysaccharide
- PBS
phosphate buffer saline
- PFA
paraformaldehydeFor the abbreviations of the brain structures, see Table 1
Footnotes
Publisher's Disclaimer: This is a PDF file of an unedited manuscript that has been accepted for publication. As a service to our customers we are providing this early version of the manuscript. The manuscript will undergo copyediting, typesetting, and review of the resulting proof before it is published in its final citable form. Please note that during the production process errors may be discovered which could affect the content, and all legal disclaimers that apply to the journal pertain.
References
- Alheid GF. Extended amygdala and basal forebrain. Ann NY Acad Sci. 2003;985:185–205. doi: 10.1111/j.1749-6632.2003.tb07082.x. [DOI] [PubMed] [Google Scholar]
- Alheid GF, Heimer L. New perspectives in basal forebrain organization of special relevance for neuropsychiatric disorders: the striatopallidal, amygdaloid, and corticopetal components of substantia innominata. Neuroscience. 1988;27:1–39. doi: 10.1016/0306-4522(88)90217-5. [DOI] [PubMed] [Google Scholar]
- Alheid GF, Heimer L. Theories of basal forebrain organization and the “emotional motor system”. Prog Brain Res. 1996;107:461–484. [PubMed] [Google Scholar]
- Allan SM, Rothwell NJ. Cytokines and acute neurodegeneration. Nat Rev Neurosci. 2001;2:734–744. doi: 10.1038/35094583. [DOI] [PubMed] [Google Scholar]
- Anisman H, Kokkinidis L, Merali Z. Further evidence for the depressive effects of cytokines: anhedonia and neurochemical changes. Brain Behav Immun. 2002;16:544–556. doi: 10.1016/s0889-1591(02)00011-9. [DOI] [PubMed] [Google Scholar]
- Anisman H, Merali Z. Cytokines, stress, and depressive illness. Brain Behav Immun. 2002;16:513–524. doi: 10.1016/s0889-1591(02)00009-0. [DOI] [PubMed] [Google Scholar]
- Anisman H, Merali Z. Cytokines, stress and depressive illness: brain-immune interactions. Ann Med. 2003;35:2–11. doi: 10.1080/07853890310004075. [DOI] [PubMed] [Google Scholar]
- Atkins JB, Chlan-Fourney J, Nye HE, Hiroi N, Carlezon WA, Jr, Nestler EJ. Region-specific induction of deltaFosB by repeated administration of typical versus atypical antipsychotic drugs. Synapse. 1999;33:118–128. doi: 10.1002/(SICI)1098-2396(199908)33:2<118::AID-SYN2>3.0.CO;2-L. [DOI] [PubMed] [Google Scholar]
- Avitsur R, Yirmiya R. The immunobiology of sexual behavior: gender differences in the suppression of sexual activity during illness. Pharmacol Biochem Behav. 1999;64:787–796. doi: 10.1016/s0091-3057(99)00165-3. [DOI] [PubMed] [Google Scholar]
- Besedovsky HO, Del Rey A. Immune-neuro-endocrine interactions: facts and hypotheses. Endocr Rev. 1996;17:64–102. doi: 10.1210/edrv-17-1-64. [DOI] [PubMed] [Google Scholar]
- Borowski T, Kokkinidis L, Merali Z, Anisman H. Lipopolysaccharide, central in vivo biogenic amine variations, and anhedonia. Neuroreport. 1998;9:3797–3802. doi: 10.1097/00001756-199812010-00006. [DOI] [PubMed] [Google Scholar]
- Borsody MK, Weiss JM. Alteration of locus coeruleus neuronal activity by interleukin-1 and the involvement of endogenous corticotropin-releasing hormone. Neuroimmunomodulation. 2002;10:101–121. doi: 10.1159/000065186. [DOI] [PubMed] [Google Scholar]
- Borsody MK, Weiss JM. The effects of endogenous interleukin-1 bioactivity on locus coeruleus neurons in response to bacterial and viral substances. Brain Res. 2004;1007:39–56. doi: 10.1016/j.brainres.2004.02.011. [DOI] [PubMed] [Google Scholar]
- Borsody MK, Weiss JM. The subdiaphragmatic vagus nerves mediate activation of locus coeruleus neurons by peripherally administered microbial substances. Neuroscience. 2005;131:235–245. doi: 10.1016/j.neuroscience.2004.09.061. [DOI] [PubMed] [Google Scholar]
- Bremner JD, Narayan M, Anderson ER, Staib LH, Miller HL, Charney DS. Hippocampal volume reduction in major depression. Am J Psychiatry. 2000;157:115–118. doi: 10.1176/ajp.157.1.115. [DOI] [PubMed] [Google Scholar]
- Capuron L, Dantzer R. Cytokines and depression: the need for a new paradigm. Brain Behav Immun. 2003;17(Suppl 1):S119–124. doi: 10.1016/s0889-1591(02)00078-8. [DOI] [PubMed] [Google Scholar]
- Capuron L, Gumnick JF, Musselman DL, Lawson DH, Reemsnyder A, Nemeroff CB, Miller AH. Neurobehavioral effects of interferon-alpha in cancer patients: phenomenology and paroxetine responsiveness of symptom dimensions. Neuropsychopharmacology. 2002a;26:643–652. doi: 10.1016/S0893-133X(01)00407-9. [DOI] [PubMed] [Google Scholar]
- Capuron L, Ravaud A, Dantzer R. Early depressive symptoms in cancer patients receiving interleukin 2 and/or interferon alfa-2b therapy. J Clin Oncol. 2000;18:2143–2151. doi: 10.1200/JCO.2000.18.10.2143. [DOI] [PubMed] [Google Scholar]
- Capuron L, Ravaud A, Gualde N, Bosmans E, Dantzer R, Maes M, Neveu PJ. Association between immune activation and early depressive symptoms in cancer patients treated with interleukin-2-based therapy. Psychoneuroendocrinology. 2001;26:797–808. doi: 10.1016/s0306-4530(01)00030-0. [DOI] [PubMed] [Google Scholar]
- Capuron L, Ravaud A, Neveu PJ, Miller AH, Maes M, Dantzer R. Association between decreased serum tryptophan concentrations and depressive symptoms in cancer patients undergoing cytokine therapy. Mol Psychiatry. 2002b;7:468–473. doi: 10.1038/sj.mp.4000995. [DOI] [PubMed] [Google Scholar]
- Cardinal RN, Parkinson JA, Hall J, Everitt BJ. Emotion and motivation: the role of the amygdala, ventral striatum, and prefrontal cortex. Neurosci Biobehav Rev. 2002;26:321–352. doi: 10.1016/s0149-7634(02)00007-6. [DOI] [PubMed] [Google Scholar]
- Castanon N, Leonard BE, Neveu PJ, Yirmiya R. Effects of antidepressants on cytokine production and actions. Brain Behav Immun. 2002;16:569–574. doi: 10.1016/s0889-1591(02)00008-9. [DOI] [PubMed] [Google Scholar]
- Castanon N, Medina C, Mormede C, Dantzer R. Chronic administration of tianeptine balances lipopolysaccharide-induced expression of cytokines in the spleen and hypothalamus of rats. Psychoneuroendocrinology. 2004;29:778–790. doi: 10.1016/S0306-4530(03)00142-2. [DOI] [PubMed] [Google Scholar]
- Chan RK, Brown ER, Ericsson A, Kovacs KJ, Sawchenko PE. A comparison of two immediate-early genes, c-fos and NGFI-B, as markers for functional activation in stress-related neuroendocrine circuitry. J Neurosci. 1993;13:5126–5138. doi: 10.1523/JNEUROSCI.13-12-05126.1993. [DOI] [PMC free article] [PubMed] [Google Scholar]
- Checkley S. The neuroendocrinology of depression and chronic stress. Br Med Bull. 1996;52:597–617. doi: 10.1093/oxfordjournals.bmb.a011570. [DOI] [PubMed] [Google Scholar]
- Chen J, Kelz MB, Hope BT, Nakabeppu Y, Nestler EJ. Chronic Fos-related antigens: stable variants of deltaFosB induced in brain by chronic treatments. J Neurosci. 1997;17:4933–4941. doi: 10.1523/JNEUROSCI.17-13-04933.1997. [DOI] [PMC free article] [PubMed] [Google Scholar]
- Cryan JF, Markou A, Lucki I. Assessing antidepressant activity in rodents: recent developments and future needs. Trends Pharmacol Sci. 2002;23:238–245. doi: 10.1016/s0165-6147(02)02017-5. [DOI] [PubMed] [Google Scholar]
- Cryan JF, Mombereau C, Vassout A. The tail suspension test as a model for assessing antidepressant activity: Review of pharmacological and genetic studies in mice. Neurosci Biobehav Rev. 2005;29:571–625. doi: 10.1016/j.neubiorev.2005.03.009. [DOI] [PubMed] [Google Scholar]
- Dantzer R. Cytokine-induced sickness behavior: mechanisms and implications. Ann N Y Acad Sci. 2001;933:222–234. doi: 10.1111/j.1749-6632.2001.tb05827.x. [DOI] [PubMed] [Google Scholar]
- Dantzer R. Cytokine-induced sickness behaviour: a neuroimmune response to activation of innate immunity. Eur J Pharmacol. 2004;500:399–411. doi: 10.1016/j.ejphar.2004.07.040. [DOI] [PubMed] [Google Scholar]
- Dantzer R, Wollman E, Vitkovic L, Yirmiya R. Cytokines and depression: fortuitous or causative association? Mol Psychiatry. 1999;4:328–332. doi: 10.1038/sj.mp.4000572. [DOI] [PubMed] [Google Scholar]
- De La Garza R., 2nd Endotoxin- or pro-inflammatory cytokine-induced sickness behavior as an animal model of depression: focus on anhedonia. Neurosci Biobehav Rev. 2005;29:761–770. doi: 10.1016/j.neubiorev.2005.03.016. [DOI] [PubMed] [Google Scholar]
- Deak T, Bellamy C, D’Agostino LG, Rosanoff M, McElderry NK, Bordner KA. Behavioral responses during the forced swim test are not affected by anti-inflammatory agents or acute illness induced by lipopolysaccharide. Behav Brain Res. 2005;160:125–134. doi: 10.1016/j.bbr.2004.11.024. [DOI] [PubMed] [Google Scholar]
- Del Cerro S, Borrell J. Interleukin-1 affects the behavioral despair response in rats by an indirect mechanism which requires endogenous CRF. Brain Res. 1990;528:162–164. doi: 10.1016/0006-8993(90)90212-t. [DOI] [PubMed] [Google Scholar]
- Dobrazanski P, Noguchi T, Kovary K, Rizzo CA, Lazo PS, Bravo R. Both products of the fosB gene, FosB and its short form, FosB/SF, are transcriptional activators in fibroblasts. Mol Cell Biol. 1991;11:5470–5478. doi: 10.1128/mcb.11.11.5470. [DOI] [PMC free article] [PubMed] [Google Scholar]
- Dunn AJ, Swiergiel AH. Effects of interleukin-1 and endotoxin in the forced swim and tail suspension tests in mice. Pharmacol Biochem Behav. 2005;81:688–693. doi: 10.1016/j.pbb.2005.04.019. [DOI] [PMC free article] [PubMed] [Google Scholar]
- Dunn AJ, Swiergiel AH, de Beaurepaire R. Cytokines as mediators of depression: what can we learn from animal studies? Neurosci Biobehav Rev. 2005;29:891–909. doi: 10.1016/j.neubiorev.2005.03.023. [DOI] [PubMed] [Google Scholar]
- Dunn AJ, Wang J, Ando T. Effects of cytokines on cerebral neurotransmission. Comparison with the effects of stress. Adv Exp Med Biol. 1999;461:117–127. doi: 10.1007/978-0-585-37970-8_8. [DOI] [PubMed] [Google Scholar]
- Elmquist JK, Scammell TE, Jacobson CD, Saper CB. Distribution of Fos-like immunoreactivity in the rat brain following intravenous lipopolysaccharide administration. J Comp Neurol. 1996;371:85–103. doi: 10.1002/(SICI)1096-9861(19960715)371:1<85::AID-CNE5>3.0.CO;2-H. [DOI] [PubMed] [Google Scholar]
- Frenois F, Le Moine C, Cador M. The motivational component of withdrawal in opiate addiction: role of associative learning and aversive memory in opiate addiction from a behavioral, anatomical and functional perspective. Rev Neurosci. 2005a;16:255–276. doi: 10.1515/revneuro.2005.16.3.255. [DOI] [PubMed] [Google Scholar]
- Frenois F, Stinus L, Di Blasi F, Cador M, Le Moine C. A specific limbic circuit underlies opiate withdrawal memories. J Neurosci. 2005b;25:1366–1374. doi: 10.1523/JNEUROSCI.3090-04.2005. [DOI] [PMC free article] [PubMed] [Google Scholar]
- Hansen MK, Daniels S, Goehler LE, Gaykema RP, Maier SF, Watkins LR. Subdiaphragmatic vagotomy does not block intraperitoneal lipopolysaccharide-induced fever. Auton Neurosci. 2000a;85:83–87. doi: 10.1016/S1566-0702(00)00224-1. [DOI] [PubMed] [Google Scholar]
- Hansen MK, Nguyen KT, Goehler LE, Gaykema RP, Fleshner M, Maier SF, Watkins LR. Effects of vagotomy on lipopolysaccharide-induced brain interleukin-1beta protein in rats. Auton Neurosci. 2000b;85:119–126. doi: 10.1016/s1566-0702(00)00230-7. [DOI] [PubMed] [Google Scholar]
- Heimer L, Alheid GF, De Olmos JS, Groenewegen HJ, Haber SN, Harlan RE, Zahm DS. The accumbens: beyond the core-shell dichotomy. J Neuropsychiatry Clin Neurosci. 1997a;9:354–381. doi: 10.1176/jnp.9.3.354. [DOI] [PubMed] [Google Scholar]
- Heimer L, Harlan RE, Alheid GF, Garcia MM, De Olmos J. Substantia innominata: a notion which impedes clinical-anatomical correlations in neuropsychiatric disorders. Neuroscience. 1997b;76:957–1006. doi: 10.1016/s0306-4522(96)00405-8. [DOI] [PubMed] [Google Scholar]
- Hellstrom IC, Danik M, Luheshi GN, Williams S. Chronic LPS exposure produces changes in intrinsic membrane properties and a sustained IL-beta-dependent increase in GABAergic inhibition in hippocampal CA1 pyramidal neurons. Hippocampus. 2005;15:656–664. doi: 10.1002/hipo.20086. [DOI] [PubMed] [Google Scholar]
- Herdegen T, Leah JD. Inducible and constitutive transcription factors in the mammalian nervous system: control of gene expression by Jun, Fos and Krox, and CREB/ATF proteins. Brain Res Rev. 1998;28:370–490. doi: 10.1016/s0165-0173(98)00018-6. [DOI] [PubMed] [Google Scholar]
- Hirschfeld RM. History and evolution of the monoamine hypothesis of depression. J Clin, Psychiatry. 2000;61(Suppl 6):4–6. [PubMed] [Google Scholar]
- Jain NK, Kulkarni SK, Singh A. Lipopolysaccharide-mediated immobility in mice: reversal by cyclooxygenase enzyme inhibitors. Methods Find Exp Clin Pharmacol. 2001;23:441–444. doi: 10.1358/mf.2001.23.8.662131. [DOI] [PubMed] [Google Scholar]
- Konsman JP, Kelley K, Dantzer R. Temporal and spatial relationships between lipopolysaccharide-induced expression of Fos, interleukin-1beta and inducible nitric oxide synthase in rat brain. Neuroscience. 1999;89:535–548. doi: 10.1016/s0306-4522(98)00368-6. [DOI] [PubMed] [Google Scholar]
- Konsman JP, Luheshi GN, Bluthe RM, Dantzer R. The vagus nerve mediates behavioural depression, but not fever, in response to peripheral immune signals; a functional anatomical analysis. Eur J Neurosci. 2000;12:4434–4446. doi: 10.1046/j.0953-816x.2000.01319.x. [DOI] [PubMed] [Google Scholar]
- Konsman JP, Parnet P, Dantzer R. Cytokine-induced sickness behaviour: mechanisms and implications. Trends Neurosci. 2002;25:154–159. doi: 10.1016/s0166-2236(00)02088-9. [DOI] [PubMed] [Google Scholar]
- Kovacs KJ. C-Fos as a transcription factor: a stressful (re)view from a functional map. Neurochem Int. 1998;33:287–297. doi: 10.1016/s0197-0186(98)00023-0. [DOI] [PubMed] [Google Scholar]
- Kovacs KJ, Sawchenko PE. Mediation of osmoregulatory influences on neuroendocrine corticotropin-releasing factor expression by the ventral lamina terminalis. Proc Natl Acad Sci USA. 1993;90:7681–7685. doi: 10.1073/pnas.90.16.7681. [DOI] [PMC free article] [PubMed] [Google Scholar]
- Kwant A, Sakic B. Behavioral effects of infection with interferon-gamma adenovector. Behav Brain Res. 2004;151:73–82. doi: 10.1016/j.bbr.2003.08.008. [DOI] [PubMed] [Google Scholar]
- Laye S, Parnet P, Goujon E, Dantzer R. Peripheral administration of lipopolysaccharide induces the expression of cytokine transcripts in the brain and pituitary of mice. Brain Res Mol Brain Res. 1994;27:157–162. doi: 10.1016/0169-328x(94)90197-x. [DOI] [PubMed] [Google Scholar]
- Leonard BE. The immune system, depression and the action of antidepressants. Prog Neuropsychopharmacol Biol Psychiatry. 2001;25:767–780. doi: 10.1016/s0278-5846(01)00155-5. [DOI] [PubMed] [Google Scholar]
- Lestage J, Verrier D, Palin K, Dantzer R. The enzyme indoleamine 2,3-dioxygenase is induced in the mouse brain in response to peripheral administration of lipopolysaccharide and superantigen. Brain Behav Immun. 2002;16:596–601. doi: 10.1016/s0889-1591(02)00014-4. [DOI] [PubMed] [Google Scholar]
- Liotti M, Mayberg HS. The role of functional neuroimaging in the neuropsychology of depression. J Clin Exp Neuropsychol. 2001;23:121–136. doi: 10.1076/jcen.23.1.121.1223. [DOI] [PubMed] [Google Scholar]
- Makino M, Kitano Y, Komiyama C, Takasuna K. Human interferon-alpha increases immobility in the forced swimming test in rats. Psychopharmacology (Berl) 2000;148:106–110. doi: 10.1007/s002130050031. [DOI] [PubMed] [Google Scholar]
- Matthews SC, Paulus MP, Dimsdale JE. Contribution of functional neuroimaging to understanding neuropsychiatric side effects of interferon in hepatitis C. Psychosomatics. 2004;45:281–286. doi: 10.1176/appi.psy.45.4.281. [DOI] [PubMed] [Google Scholar]
- McClung CA, Ulery PG, Perrotti LI, Zachariou V, Berton O, Nestler EJ. DeltaFosB: a molecular switch for long-term adaptation in the brain. Mol Brain Res. 2004;132:146–154. doi: 10.1016/j.molbrainres.2004.05.014. [DOI] [PubMed] [Google Scholar]
- Merali Z, Brennan K, Brau P, Anisman H. Dissociating anorexia and anhedonia elicited by interleukin-1beta: antidepressant and gender effects on responding for “free chow” and “earned” sucrose intake. Psychopharmacology (Berl) 2003;165:413–418. doi: 10.1007/s00213-002-1273-1. [DOI] [PubMed] [Google Scholar]
- Monleon S, D’Aquila P, Parra A, Simon VM, Brain PF, Willner P. Attenuation of sucrose consumption in mice by chronic mild stress and its restoration by imipramine. Psychopharmacology (Berl) 1995;117:453–457. doi: 10.1007/BF02246218. [DOI] [PubMed] [Google Scholar]
- Morgan JI, Curran T. Immediate-early genes: ten years on. Trends Neurosci. 1995;18:66–67. [PubMed] [Google Scholar]
- Mormede C, Palin K, Kelley KW, Castanon N, Dantzer R. Conditioned taste aversion with lipopolysaccharide and peptidoglycan does not activate cytokine gene expression in the spleen and hypothalamus of mice. Brain Behav Immun. 2004;18:186–200. doi: 10.1016/S0889-1591(03)00133-8. [DOI] [PubMed] [Google Scholar]
- Nestler EJ, Barrot M, DiLeone RJ, Eisch AJ, Gold SJ, Monteggia LM. Neurobiology of depression. Neuron. 2002;34:13–25. doi: 10.1016/s0896-6273(02)00653-0. [DOI] [PubMed] [Google Scholar]
- Nestler EJ, Barrot M, Self DW. Delta FosB: A sustained molecular switch for addiction. Proc Natl Acad Sci USA. 2001;98:11042–11046. doi: 10.1073/pnas.191352698. [DOI] [PMC free article] [PubMed] [Google Scholar]
- Nestler EJ, Kelz MB, Chen J. DeltaFosB: a molecular mediator of long-term neural and behavioral plasticity. Brain Res. 1999;835:10–17. doi: 10.1016/s0006-8993(98)01191-3. [DOI] [PubMed] [Google Scholar]
- Paxinos G, Franklin KBJ. The mouse brain in stereotaxic coordinates. Academic Press; San Diego: 2001. [Google Scholar]
- Perrotti LI, Hadeishi Y, Ulery PG, Barrot M, Monteggia L, Duman RS, Nestler EJ. Induction of DeltaFosB in reward-related brain structures after chronic stress. J Neurosci. 2004;24:10594–10602. doi: 10.1523/JNEUROSCI.2542-04.2004. [DOI] [PMC free article] [PubMed] [Google Scholar]
- Porsolt RD. Animal models of depression: utility for transgenic research. Rev Neurosci. 2000;11:53–58. doi: 10.1515/revneuro.2000.11.1.53. [DOI] [PubMed] [Google Scholar]
- Rodriguez JJ, Garcia DR, Nakabeppu Y, Pickel VM. Enhancement of laminar FosB expression in frontal cortex of rats receiving long chronic clozapine administration. Exp Neurol. 2001;168:392–401. doi: 10.1006/exnr.2000.7612. [DOI] [PubMed] [Google Scholar]
- Rosi S, Ramirez-Amaya V, Hauss-Wegrzyniak B, Wenk GL. Chronic brain inflammation leads to a decline in hippocampal NMDA-R1 receptors. J Neuroinflammation. 2004;1:12. doi: 10.1186/1742-2094-1-12. [DOI] [PMC free article] [PubMed] [Google Scholar]
- Rosi S, Ramirez-Amaya V, Vazdarjanova A, Worley PF, Barnes CA, Wenk GL. Neuroinflammation alters the hippocampal pattern of behaviorally induced Arc expression. J Neurosci. 2005;25:723–731. doi: 10.1523/JNEUROSCI.4469-04.2005. [DOI] [PMC free article] [PubMed] [Google Scholar]
- Sammut S, Bethus I, Goodall G, Muscat R. Antidepressant reversal of interferon-alpha-induced anhedonia. Physiol Behav. 2002;75:765–772. doi: 10.1016/s0031-9384(02)00677-7. [DOI] [PubMed] [Google Scholar]
- Sheline YI, Sanghavi M, Mintun MA, Gado MH. Depression duration but not age predicts hippocampal volume loss in medically healthy women with recurrent major depression. J Neurosci. 1999;19:5034–5043. doi: 10.1523/JNEUROSCI.19-12-05034.1999. [DOI] [PMC free article] [PubMed] [Google Scholar]
- Shen Y, Connor TJ, Nolan Y, Kelly JP, Leonard BE. Differential effect of chronic antidepressant treatments on lipopolysaccharide-induced depressive-like behavioural symptoms in the rat. Life Sci. 1999;65:1773–1786. doi: 10.1016/s0024-3205(99)00430-0. [DOI] [PubMed] [Google Scholar]
- Steru L, Chermat R, Thierry B, Simon P. The tail suspension test: A new method for screening antidepressants in mice. Psychopharmacology. 1985;85:367–370. doi: 10.1007/BF00428203. [DOI] [PubMed] [Google Scholar]
- Stone TW. Endogenous neurotoxins from tryptophan. Toxicon. 2001;39:61–73. doi: 10.1016/s0041-0101(00)00156-2. [DOI] [PubMed] [Google Scholar]
- Suzuki T, Funada M, Sugano Y, Misawa M, Okutomi T, Soma G, Mizuno D. Effects of a lipopolysaccharide from Pantoea agglomerans on the cocaine-induced place preference. Life Sci. 1994;54:PL75–80. doi: 10.1016/0024-3205(94)00704-7. [DOI] [PubMed] [Google Scholar]
- Wichers MC, Koek GH, Robaeys G, Verkerk R, Scharpe S, Maes M. IDO and interferon-alpha-induced depressive symptoms: a shift in hypothesis from tryptophan depletion to neurotoxicity. Mol Psychiatry. 2005;10:538–544. doi: 10.1038/sj.mp.4001600. [DOI] [PubMed] [Google Scholar]
- Wichers MC, Maes M. The role of indoleamine 2,3-dioxygenase (IDO) in the pathophysiology of interferon-alpha-induced depression. J Psychiatry Neurosci. 2004;29:11–17. [PMC free article] [PubMed] [Google Scholar]
- Yamano M, Yuki H, Yasuda S, Miyata K. Corticotropin-releasing hormone receptors mediate consensus interferon-alpha YM643-induced depression-like behavior in mice. J Pharmacol Exp Ther. 2000;292:181–187. [PubMed] [Google Scholar]
- Yirmiya R. Endotoxin produces a depressive-like episode in rats. Brain Res. 1996;711:163–174. doi: 10.1016/0006-8993(95)01415-2. [DOI] [PubMed] [Google Scholar]
- Yirmiya R. Depression in medical illness: the role of the immune system. West J Med. 2000;173:333–336. doi: 10.1136/ewjm.173.5.333. [DOI] [PMC free article] [PubMed] [Google Scholar]