

Abstract
The impact of alcohol-induced suppression on hepatic gluconeogenesis (HGN) after chronic ethanol consumption between males and females is unknown. To determine the effects of chronic alcohol consumption (8 weeks) on HGN, the isolated hepatocyte technique was employed on 24 hr fasted male and female Wistar rats. Livers were initially perfused with collagenase and the hepatocytes were isolated. Aliquots of the cell suspension were placed in Krebs-Henseleit buffer and incubated for 30 minutes with lactate, [U-14C]lactate, and nine different concentrations of ethanol (EtOH). Dose-effect curves were generated for the determination of maximal and half-maximal alcohol-induced inhibition on HGN. There was no significant difference in HGN (lactate only and no EtOH) between males and females fed the control diet (88.5 ± 5.1 nmol/mg protein/30 min). Similarly, the HGN (lactate only and no EtOH) in males fed the ethanol diet (ME) were not significantly different (82.8 ± 3.5 nmol/mg protein/30 min) compared to controls. In contrast, the females chronically fed the ethanol diet (FE) had significantly (P < 0.05) lower HGN (67.8 ± 4.6 nmol/mg protein/30 min) compared to both ME and controls. With alcohol in the incubation medium the HGN significantly (P < 0.05) declined in all groups. While alcohol suppressed HGN to a larger (P < 0.05) extent in ME (45.8 ± 3.7 nmol/mg protein/ 30 min) compared to controls (64.0 ± 3.8 nmol/mg protein/30 min), the inhibition was even greater (P < 0.05) in FE (32.7 ± 3.2 nmol/mg protein/30 min). The more pronounced effect of chronic alcohol consumption on HGN in the presence of ethanol in female hepatocytes was supported by the concomitant decreases (P < 0.05) in 14C-lactate incorporation into 14C-glucose, lactate uptake, and 14C-lactate uptake. The results suggest that chronic alcohol consumption elicits a greater reduction on HGN in the presence of ethanol in the hepatocytes of females compared to males.
Keywords: [U-14C]lactate, 14C-glucose, Wistar rats
1. Introduction
Evidence has been accumulating in support of sex differences within the liver that result in contrasting responses to both an acute and chronic consumption of ethanol (hereafter and perhaps inappropriately also referred to as “alcohol”). Reports in humans suggest that there are sex differences in the location and quantity of hepatic alcohol dehydrogenase (Maly & Sasse, 1991) and sex differences in the first-pass metabolism of ethanol, the latter of which can give rise to higher blood alcohol levels in women compared to men despite an equivalent consumption of ethanol (Baraona et al., 2001). Further, there are sex differences in fatty acid accumulation within the liver resulting from chronic alcohol consumption that can elevate the likelihood of alcohol-induced liver disease in women after consuming less alcohol and within a shorter time period compared to men (Becker et al., 1996).
Recent studies from our laboratory have also revealed sex differences following chronic alcohol consumption (Sumida et al., 2004; Sumida et al., 2005a). We employed the use of dual labeled glucose infusions to measure in vivo rates of whole body glucose production and apparent glucose carbon recycling (an indicator of gluconeogenesis) in fasted male and female Wistar rats that were chronically fed ethanol (Sumida et al., 2004). Following the injection of alcohol, rats chronically fed an ethanol diet demonstrated earlier declines in whole body glucose production capacity and apparent glucose carbon recycling compared to male and female controls (Sumida et al., 2004). Further, the reduction in glucose production in female animals chronically fed the ethanol diet resulted in lower blood glucose levels compared to male counterparts (Sumida et al., 2004). Given the significant role of the liver for glucose production, this in vivo study implicated sex specific alterations on hepatic gluconeogenesis following chronic alcohol consumption. This was supported by our recent report using the liver perfusion technique with lactate as the sole precursor where hepatic gluconeogenesis was significantly lower in females chronically fed alcohol compared to male rats (Sumida et al., 2005a). However, this recent liver perfusion study did not examine the impact of alcohol in the perfusate.
The purpose of the current study was to elucidate the effect of chronic alcohol consumption (8 weeks) on hepatic gluconeogenic capacity in the presence of ethanol between fasted male and female animals. Specifically, using the isolated hepatocyte preparation, lactate as the sole precursor and various concentrations of alcohol, we measured hepatic gluconeogenic and lactate uptake rates in male and female rats chronically fed an ethanol diet as well as male and female animals fed an appropriate control diet. Based upon our previous observations, we hypothesized that alcohol would inhibit hepatic gluconeogenic capacity in ethanol fed female animals to a greater extent compared to all groups, including the ethanol fed males. While we employed a 24 hour fast to minimize hepatic glycogenolysis, we also incorporated 14C-lactate and measured 14C-glucose production to substantiate any alteration in hepatic gluconeogenesis.
2. Materials and Methods
2.1 Animals
The experimental protocol for this study was pre-approved by the Chapman University Institutional Review Board and complied with the Public Health Service policy on the use of experimental animals for research. Thirty-two age-matched male and female Wistar rats (initially 100-150 grams), obtained from Charles River Laboratories (Wilmington, MA), were housed individually and maintained on a 12/12 hour light/dark cycle. Male animals were randomly assigned to either a control group (MC, n=8) fed a control liquid diet or an experimental group (ME, n=8) fed a low-fat ethanol liquid diet. Female animals were also randomly assigned to a control group (FC, n=8) fed the control liquid diet or an experimental group (FE, n=8) fed the low-fat ethanol liquid diet. All male and female control animals were pair fed with the animals given the ethanol diet. The alcohol diet (Lieber and DeCarli, 1986) contained 36% of the caloric intake as ethanol whereas the control diet contained a dextrin-maltose substitute for alcohol to ensure an isocaloric consumption (Dyets, Inc., Bethlehem, PA). Body weights were monitored weekly and all animals were within 10% of their gender matched counterpart throughout the feeding period. The feeding period on the liquid diets lasted for 8 weeks. Prior to the experiment, the animals were fasted for 24 hours whereas water continued to be provided ad libitum. The fast was employed to deplete liver glycogen stores and minimize the glucose output derived from glycogenolysis. In addition, a 24 hour fast also lowered the potential for any residual alcohol remaining in the ethanol fed animals in order to distinguish the chronic effects on hepatic gluconeogenic capacity (Kelly et al., 1987).
2.2 Isolation of Hepatocytes and Experiments
The in situ isolation of the liver was accomplished as previously reported by our laboratory (Sumida et al., 1993). Briefly, after the surgical isolation of the liver, the animal was placed in a humidified and temperature controlled (37°C) Plexiglas perfusion chamber (Exton & Park, 1967). Before entering the liver, the perfusate was sequentially filtered through a nylon mesh, oxygenated (95%:5%, O2:CO2), and then passed through a bubble trap. Hepatocytes were isolated as previously reported by our laboratory (Sumida et al., 2005b) where calcium-free Krebs-Hensleit bicarbonate buffer and fresh thoroughly washed bovine red blood cells (hematocrit of 13-15%) perfused the liver (single-pass) for 10 minutes at a rate of 35 ml/min. Collagenase was added to the perfusate and the system was switched to a recirculation mode with the flow rate adjusted to ∼2 ml/min × g liver−1. The liver was perfused for 20-30 minutes to allow for the degradation of connective tissue and visually monitored. The liver was carefully removed from the animal and placed in a Petri dish containing an incubation buffer similar to the perfusate (i.e., Krebs-Hensleit), but with the addition of calcium (2.4 mM) and the absence of collagenase. Scissors were used to open any remaining intact liver capsules and gently stirred until there was a concentrated homogenate of cells. The cells were then funneled into a 250 ml plastic flask, aerated, and rapidly shaken in a 37°C water bath for 10 minutes. The cells were filtered through two layers of a nylon mesh and centrifuged. The supernatant was aspirated and the cells were washed 3 more times using an incubation buffer now containing 1% (w/v) gelatin (Difco, Detroit, MI). The viability of the hepatocytes following the washing procedure was assessed via a trypan blue exclusion test. A small aliquot of cell suspension was removed to determine the endogenous glucose concentration (prior to the addition of any substrate) and the initial glycogen content. Following the last centrifugation, the cell volume was measured and the cells were reconstituted (14 ml buffer/1 ml cells) in an incubation buffer now containing 1.5% (w/v) gelatin (Difco), 5 mM neutralized lactate, and [U-14C]lactate (25,000 dpm/ml). The cell suspensions of a given liver were then separated into 50 ml plastic flasks and attached to a 10 lane manifold that allowed for continual gassing with water saturated O2:CO2 (95%:5%) while being gently shaken in a 37°C water bath.
A 10 minute pre-incubation period, to allow for equilibration of lactate and the re-establishment of basal metabolism and ion gradients was employed prior to the addition of various concentrations of ethanol (in mM: 0, 0.5, 1.0, 1.5, 2.0, 2.5, 3.0, 4.0, 5.0, 15.0) to the cell suspension. After the ethanol was added, gassing was immediately restored and the hepatocytes were incubated for a total of 30 minutes. It should be noted that a separate set of experiments (n=4) were conducted to determine the amount of ethanol evaporation that occurred after 30 minutes. Using the same incubation buffer, water bath temperature, and water saturated gassing procedure, but in the absence of hepatocytes, there was minimal alcohol evaporation (i.e., 12.4 ± 1.6% loss of ethanol after 30 minutes). We attribute the minimal loss of alcohol to the water saturated gassing protocol and short incubation period.
2.3 Analyses
Following the 30 minute incubation with hepatocytes, reactions were terminated by placing aliquots of the cell suspension into tubes containing either: potassium hydroxide or sodium hydroxide for the subsequent determination of: glycogen (Dubois et al., 1956) and protein (Lowry et al., 1951), respectively. Bovine serum albumin was used as the standard for the determination of protein concentration. Similarly, after the 30 minute incubation aliquots of the cell suspension were spun and the supernatant placed in perchloric acid for the subsequent determination of glucose (Raabo & Terkildsen, 1960) and lactate (Hohorst, 1963). Samples from the glucose/lactate supernatants were prepared for ion-exchange chromatography for the determination of glucose and lactate specific radioactivity (LSA) as previously described (Sumida et al., 1993). The pH of the cell suspension after the 30 minute incubation was 7.43 ± 0.02.
2.4 Calculations and Statistics
Hepatic gluconeogenesis (HGN) was calculated as the difference between exogenous glucose production (from lactate) and endogenous glucose synthesis (no substrate). The HGN, 14C-glucose production, lactate uptake, 14C-lactate uptake, and glycogen content (i.e., glucose equivalents) were divided by the cell viability for all groups and expressed as the concentration, or disintegrations per min (dpm), per mg of protein for the 30 minute incubation period. 14C-glucose production (dpm/ml) was the radioactive glucose in the incubation medium normalized to a LSA of 5,000 dpm/μmol and expressed as dpm/mg of protein. Dose-response curves were generated from nonlinear regression equations via software (Prism, GraphPad Software, Inc., San Diego, CA) to determine the maximal inhibitory response (Max Inhibition) and half-maximal inhibitory effect (EC50). Correlation coefficients using the least squares method were determined for each group. A 3-factor ANOVA was used to examine main the effects of sex (Male vs. Female), diet (Control fed vs. Ethanol fed), and ethanol (EtOH) concentration in the incubation medium at the two extremes (i.e. No EtOH vs. Max EtOH). Interaction effects (i.e. sex × diet, diet × EtOH, sex × EtOH, and sex × diet × EtOH) were also analyzed. Student-Newman-Keuls tests were employed with the level of significance for all comparisons set at P < 0.05. All values are expressed as the Mean ± SE.
Finally, it should be noted that the radioactive measurements (i.e. 14C-glucose production and 14C-lactate uptake) were used to substantiate hepatic gluconeogenesis (HGN) and lactate uptake (LA Up) by the hepatocytes. In all cases these radioactive measurements mirrored the observed difference between groups. For brevity and focus, the radioactive data will only be displayed for the interaction effects.
3. Results
The body weights of males fed the ethanol diet (318.8 ± 12.4 g) were not significantly different from male controls (323.8 ± 7.3 g) after the 8 weeks of liquid diet ingestion. Similarly, the body weights of females fed the ethanol diet (219.6 ± 9.7 g) were not significantly different from female controls (218.6 ± 4.5 g) following 8 weeks of the liquid diet ingestion. In addition, there were no significant main or interaction effects in pH and initial lactate concentration in the incubation medium, or cell viability and protein content of the hepatocytes (Table 1). Further, there was no significant main or interaction effects in the initial liver glycogen content prior to the addition of lactate as well as the post-glycogen content, i.e., after the addition of alcohol and the 30 minute incubation with lactate (Table 1).
Table 1.
Characteristics of Incubation Medium and Isolated Hepatocytes
| Viability | Initial [Lactate] | Pre-[Gly] | Post-[Gly] | Protein | |||
|---|---|---|---|---|---|---|---|
| pH | (%) | (mM) | (nmol/mg protein) | (mg/ml) | |||
| Males: | MC: (n=8) | 7.43 ± .02 | 86.3 ± 1.9 | 5.1 ± 0.2 | 5.3 ± 0.3 | 5.2 ± 0.4 | 4.9 ± 0.6 |
| ME: (n=8) | 7.43 ± .02 | 88.7 ± 2.4 | 5.0 ± 0.2 | 4.6 ± 0.3 | 4.5 ± 0.3 | 5.1 ± 0.4 | |
| Females: | FC: (n=8) | 7.45 ± .02 | 85.2 ± 2.6 | 5.3 ± 0.3 | 5.4 ± 0.4 | 5.6 ± 0.5 | 4.4 ± 0.4 |
| FE: (n=8) | 7.43 ± .02 | 84.6 ± 1.5 | 5.1 ± 0.2 | 4.8 ± 0.6 | 5.2 ± 0.7 | 4.2 ± 0.5 | |
Values are the Mean ± SE where MC = Males fed the Control diet, ME = Males fed the Ethanol diet, FC = Females fed the Control diet, and FE = Females fed the Ethanol diet. The Viability (%) above reflects the results from the trypan blue exclusion test (see Methods). The initial glycogen concentration (Pre-[Gly]) is the content prior to the addition of ethanol and expressed as nmol of glucose equivalents. The final glycogen concentration (Post-[Gly]) is the content following maximal ethanol inhibition and similarly expressed as nmol of glucose equivalents. All glycogen concentrations are divided by the protein content and reflect 100% cell viability (see Methods section). No significant differences in main or interaction effects. For brevity, individual groups are displayed.
Each group (i.e. MC, ME, FC, and FE) demonstrated a dose-effect relationship with a plateau (i.e. no continuation of alcohol-induced inhibition) between 5 and 15 mM (Figure 1). Further examination of the dose-effect curve from each group revealed no difference in the EC50 between male and female controls (Table 2) whereas the male and female animals fed the ethanol diet demonstrated a decline in the EC50 (Table 2). Of greater import in the kinetic analyses resulting from the dose-effect curve was the confirmation that the highest ethanol dose we used in the incubation medium resulted in maximal inhibition of hepatic gluconeogenesis.
Figure 1.

Effect of various concentrations of alcohol on hepatic gluconeogenesis (HGN) in hepatocytes of males fed the control diet (MC, n=8), males fed the ethanol diet (ME, n=8), females fed the control diet (FC, n=8), and females fed the ethanol diet (FE, n=8). The correlation coefficients were greater than 0.9 for all groups.
Table 2.
Kinetic Results from Dose-Effect Curves
| Basal HGN – Lactate Only | Effects of Ethanol: | ||
|---|---|---|---|
| Group | (nmol/mg protein/30 min) | EC50 (mM) | Max Inhibition (nmol/mg protein/30 min) |
| MC (n=8) | 89.1 ± 4.2 | 2.4 ± 0.2 | 64.6 ± 3.9 |
| ME (n=8) | 82.8 ± 3.5 | 1.5 ±0.1 | 45.8 ± 3.7 |
| FC (n=8) | 87.9 ± 5.9 | 2.3 ± 0.3 | 63.5 ± 4.2 |
| FE (n=8) | 67.8 ± 4.6 | 1.0 ± 0.1 | 32.7 ± 3.2 |
Values are the Mean ± SE where MC = Males fed the Control diet, ME = Males fed the Ethanol diet, FC = Females fed the Control diet, and FE = Females fed the Ethanol diet.
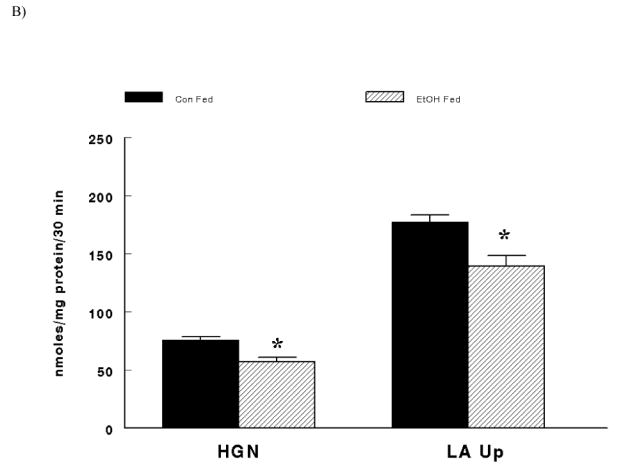
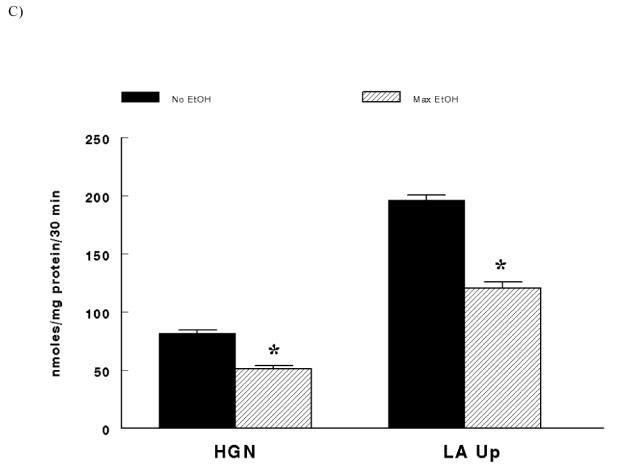
Males demonstrated significantly higher hepatic gluconeogenesis and lactate uptake after the 30 minute incubation period compared to females (Figure 2A - main effect of sex; P < 0.0001). In like manner, animals fed the control diet had significantly greater hepatic glucose production and lactate uptake compared to animals fed the alcohol diet after the 30 minute incubation period (Figure 2B – main effect of diet; P < 0.0001). Finally, in the absence of ethanol in the incubation medium (i.e. No EtOH) hepatic gluconeogenesis and lactate uptake were significantly higher compared to hepatocytes exposed to the maximal ethanol dose in the incubation medium after 30 minutes (Figure 2C – main effect of EtOH; P < 0.0001). In all comparisons, hepatic gluconeogenesis was confirmed by the minimal glycogenolysis following the 30 minute incubation period (Table 1).
Figure 2.

(A) Main Effect of Sex (Males vs. Females) on hepatic gluconeogenesis (HGN) and lactate uptake (LA Up). *Significant difference between Males vs. Females (P < 0.0001).
(B) Main Effect of Diet (Control Fed animals = Con Fed vs. Ethanol Fed animals = EtOH Fed) on hepatic gluconeogenesis (HGN) and lactate uptake (LA Up). *Significant difference between Con Fed vs. EtOH Fed (P < 0.0001).
(C) Main Effect of EtOH (No ethanol in the incubation medium = No EtOH vs. the maximal ethanol dose in the incubation medium = Max EtOH) on hepatic gluconeogenesis (HGN) and lactate uptake (LA Up). *Significant difference between No EtOH vs. Max EtOH (P < 0.0001).
There was a significant interaction effect between sex and diet where ethanol fed male and female animals demonstrated significantly lower hepatic gluconeogenesis (P < 0.02) and lactate uptake (P = 0.0002) compared to corresponding control fed males and females (Figure 3). As previously stated, hepatic gluconeogenesis was substantiated by the minimal glycogenolysis (Table 1). It is now confirmed by 14C-glucose production and supported by the 14C-lactate uptake where both were significantly reduced (P < 0.001) in ethanol fed animals (Figure 4). Hepatic gluconeogenesis and lactate uptake as well as 14C- glucose production and 14C-lactate uptake were significantly lower (P < 0.05) in hepatocytes from females fed the ethanol diet compared to males fed the ethanol diet (Figure 3 and Figure 4).
Figure 3.
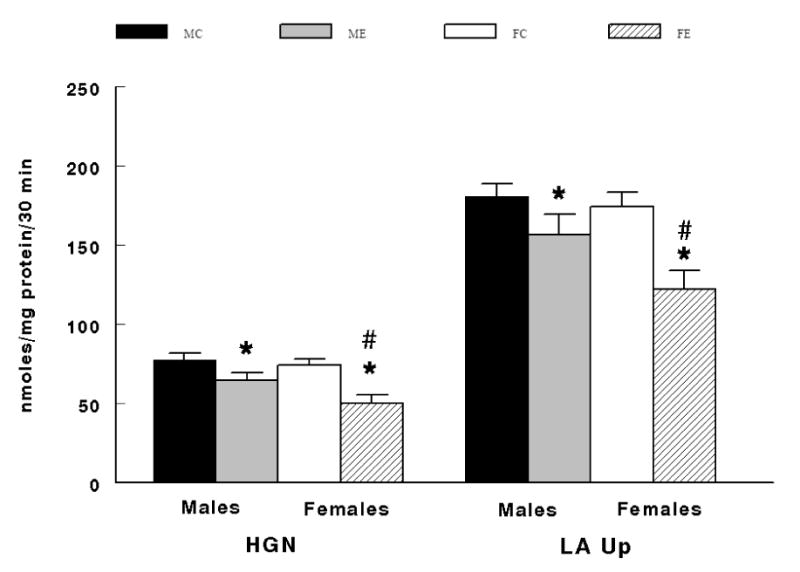
Interaction between Sex and Diet on hepatic gluconeogenesis (HGN) and lactate uptake (LA Up). MC = males fed the control diet before the addition of ethanol and at max ethanol inhibition, ME = males fed the ethanol diet before the addition of ethanol and at max ethanol inhibition, FC = females fed the control diet before the addition of ethanol and at max ethanol inhibition, FE = males fed the ethanol diet before the addition of ethanol and at max ethanol inhibition. *Significant difference (P < 0.05) between MC vs. ME and between FC vs. FE. #Significant difference (P < 0.05) between ME vs. FE.
Figure 4.
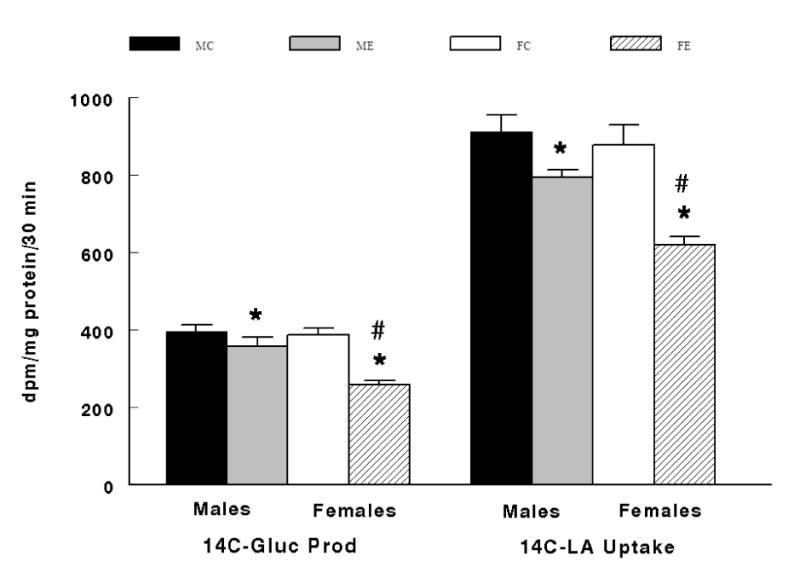
Interaction between Sex and Diet on 14C-Glucose Production (14C-Gluc Prod) and 14C-Lactate Uptake (14C-LA Uptake). MC = males fed the control diet before the addition of ethanol and at max ethanol inhibition, ME = males fed the ethanol diet before the addition of ethanol and at max ethanol inhibition, FC = females fed the control diet before the addition of ethanol and at max ethanol inhibition, FE = males fed the ethanol diet before the addition of ethanol and at max ethanol inhibition. *Significant difference (P < 0.05) between MC vs. ME and between FC vs. FE. #Significant difference (P < 0.05) between ME vs. FE.
A significant interaction effect between diet and ethanol in the incubation medium (i.e. No EtOH vs. Max EtOH) was also observed. There were significantly lower hepatic gluconeogenesis (P < 0.001) and concomitant lactate uptake (P < 0.0001) at the max ethanol dose compared to the absence of ethanol in the incubation medium in both control and ethanol fed animals (Figure 5). Radioactive measurements supported the observations of significantly greater inhibition (P < 0.001) on glucose production and lactate uptake at the highest ethanol dose (Figure 6). Futher, all alcohol fed animals demonstrated significantly lower (P < 0.01) hepatic gluconeogenesis and lactate uptake compared to control fed animals in the absence (i.e. No EtOH) and presence of the maximal ethanol dose (i.e. Max EtOH). In like manner, 14C-glucose production and 14C-lactate uptake were significantly reduced (P < 0.001) in alcohol fed animals in the absence and presence of the maximal ethanol dose in the incubation medium (Figure 5 and Figure 6).
Figure 5.
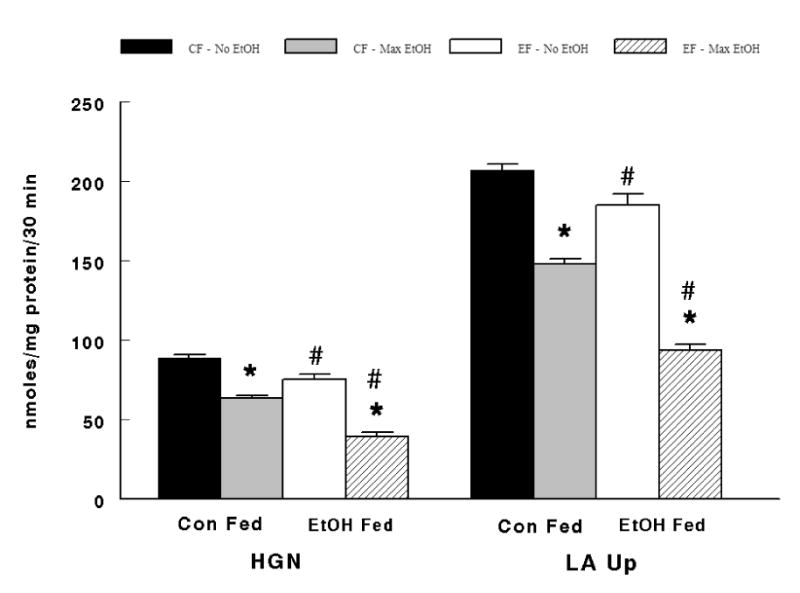
Interaction between Diet and EtOH in the incubation medium (i.e. No EtOH vs. Max EtOH) on hepatic gluconeogenesis (HGN) and lactate uptake (LA Up). CF – No EtOH = animals fed the control diet before the addition of ethanol, CF – Max EtOH = animals fed the control diet at max ethanol inhibition, EF = animals fed the alcohol diet before the addition of ethanol, EF = animals fed the alcohol diet at max ethanol inhibition. *Significant difference (P < 0.05) between CF – No EtOH vs. CF – Max EtOH and between EF – No EtOH vs. EF – Max EtOH. #Significant difference (P < 0.05) between CF – No EtOH vs. EF – No EtOH and between CF- Max EtOH vs. EF – Max EtOH.
Figure 6.

Interaction between Diet and EtOH in the incubation medium (i.e. No EtOH vs. Max EtOH) on 14C-Glucose Production (14C-Gluc Prod) and 14C-Lactate Uptake (14C-LA Uptake). CF – No EtOH = animals fed the control diet before the addition of ethanol, CF – Max EtOH = animals fed the control diet at max ethanol inhibition, EF = animals fed the alcohol diet before the addition of ethanol, EF = animals fed the alcohol diet at max ethanol inhibition. *Significant difference (P < 0.05) between CF – No EtOH vs. CF – Max EtOH and between EF – No EtOH vs. EF – Max EtOH. #Significant difference (P < 0.05) between CF – No EtOH vs. EF – No EtOH and between CF- Max EtOH vs. EF – Max EtOH.
4. Discussion
The current results support previous studies demonstrating the suppression of HGN from lactate attributable to alcohol (Crow et al., 1978; Krebs, 1968, Krebs et al., 1969). Our observation of an alcohol-induced inhibition of gluconeogenesis is supported by the 24-hour fast and minimal glycogenolysis as well as the corresponding alterations in lactate uptake, 14C-glucose production, and 14C-lactate uptake (Table 1, Figure 5, and Figure 6). There are also two new major findings of this study. The first is the more dramatic effect of alcohol on HGN due to chronic ethanol consumption resulting in a greater decline in glucose synthesis (Table 2, Figure 1, Figure 3, and Figure 4). The second major observation is that the decline in HGN and apparent shift in the EC50 were more prominent in the hepatocytes of females chronically fed an ethanol diet compared to male counterparts. To our knowledge, this is the first study to report sex differences on the alcohol-induced suppression of HGN following chronic ethanol consumption.
The evidence for sex differences in the liver following acute alcohol consumption that could contribute to an effect on glucose homeostasis is not new. Earlier studies using animal models demonstrated differences between males and females in the β-adrenergic response to hepatic glycogenolysis (Yamagi et al., 1990) and in alcohol metabolizing enzymes (Teschke & Wiese, 1982). Further, sex differences have also been observed in the liver as a result of chronic alcohol consumption related to: glycogen metabolism (Winston and Reitz, 1984), the cytosolic capacity to bind fatty acids (Shevchuk et al., 1991), and the activation of Kupffer cells that can lead to increased endotoxin levels giving rise to a more rapid and severe alcohol-induced liver injury in females vs. males (Kono et al., 2000). The current study now reports another sex difference whereby chronic alcohol consumption exacerbates the ethanol-induced suppression of hepatic gluconeogenic capacity in alcohol fed animals compared to controls and in female animals more than males. While the absolute decline is greater in FE compared to ME, we note the similar relative (i.e., % decline from baseline) alcohol-induced suppression of HGN between FE (i.e., 52%) and ME (i.e., 45%). Therefore, while the absolute EC50 was lower for FE vs. ME, we recognize that this value does not reflect classic dose-response relationships and may simply be attributable to the difference in the initial baseline between ethanol fed females and males.
Collectively, the results of the current study support a general pattern of observations from our laboratory. In a previous in vivo study using dual labeled glucose infusions, we demonstrated that female Wistar rats chronically fed an ethanol diet had lower whole-body glucose production in the absence of alcohol exposure (Sumida et al., 2004). After the administration of ethanol the in vivo glucose appearance rate declined much earlier in alcohol fed females compared to all other groups, as did the apparent glucose carbon recycling, attributable to reductions in glucose production (Sumida et al., 2004). The location for the decline in glucose production, i.e. the kidneys or the liver, was beyond the scope of our prior in vivo study. However, these observations led to a recent study using the liver perfusion technique where we reported that some of the decline in whole-body glucose production is due to a distinct reduction in hepatic gluconeogenic capacity in alcohol fed female Wistar rats (Sumida et al., 2005a). Using lactate as the sole precursor, we demonstrated a reduction in the gluconeogenic capacity of the liver that was only observed in females chronically fed an ethanol diet compared to male counterparts fed the same alcohol diet (Sumida et al., 2005a). Our current results where we similarly demonstrate lower HGN in the hepatocytes of females fed the ethanol diet in the absence of alcohol (i.e., no addition of alcohol to the incubation medium) confirm both these prior observations. The results of the current study also support our previous in vivo report indicating a greater alcohol-induced suppression of hepatic gluconeogenic capacity in females fed the ethanol diet.
The mechanism(s) for the greater alcohol-induced suppression of hepatic gluconeogenesis in ethanol fed animals was beyond the scope of the current study. However, we recognize that various factors can impact hepatic gluconeogenesis. For example, the liver possesses important characteristics such as metabolic zonation and the ability to adapt in response to various physiologic circumstances. In this regard, several studies have observed differential changes in the perivenous region of the liver compared to the periportal area following chronic alcohol consumption (Garcia-Ruiz et al., 1994; Ivester et al., 1995; Baio et al., 1998; Schaffert et al., 2001). We also note that in situations where elevations in liver glucose production are warranted, e.g., chronic exposure to cold or acute exercise, the gluconeogenic capacity was selectively higher from the perivenous compared to the periportal zone making the entire liver more homogenous as it pertains to its glucose production potential (Shiota et al., 1993; Désy et al., 2001). As such, it is conceivable that the differential gender effects could be attributable to sex differences in the perivenous zone after chronic alcohol consumption that would detrimentally impact the gluconeogenic capacity within this region, the area previously observed to elevate its glucose production capability. Alternatively, it is possible that chronic alcohol consumption (where blood alcohol levels tend to be higher in females) might differentially alter the hepatic plasma membrane which might affect monocarboxylate transporter number and/or impact the activity of enzymes indirectly involved with the gluconeogenic pathway that is exacerbated in the presence of ethanol. In partial support, we previously observed a decline in lactate dehydrogenase (LDH) activity in FE compared to all other groups (Sumida et al., 2005a). Given the import of LDH in converting lactate to pyruvate in the gluconeogenic pathway, this could help explain the lower baseline HGN (i.e., in the absence of alcohol) observed in FE. Nevertheless, the specific mechanism(s) for the greater alcohol-induced suppression of HGN in FE remains to be determined.
Finally, we recognize some limitations in the interpretation of our results. While the use of isolated hepatocytes can maximize the amount of data obtained in a single liver, it does not appropriately mimic in vivo conditions where other variables such as precursor supply, hormonal milieu, and nutritional status are factors in the development of alcohol-induced hypoglycemia. In addition, we chose a relatively short incubation time (i.e. 30 min) to help minimize any alcohol evaporation during our constant gassing procedure as confirmed in a separate set of experiments. However, the short incubation time (to limit evaporation) may have also prevented a full effect from the ethanol induced suppression on HGN at the higher alcohol concentrations. Lastly, we employed a 24 hour fast to deplete hepatic glycogen levels to help differentiate the impact of chronic alcohol consumption upon gluconeogenesis. This length of time results in a substantial depletion of hepatic glycogen for rats that cannot be extrapolated to humans for the same time period. However, inadequate nutritional intake is common in alcoholics which could lead to compromised glycogen levels comparable to our condition in animals.
In summary, the major findings of the current study indicate that at the highest ethanol dose, gluconeogenesis from lactate was inhibited to a greater extent from the hepatocytes of ethanol fed animals compared to controls. Further, the alcohol-induced suppression of HGN was greater in FE. Taken together, these results indicate that chronic alcohol consumption in females elicits a detrimental impact on hepatic gluconeogenic capacity that is exacerbated in the presence of ethanol which would limit the ability to mount a counter-regulatory response. Thus, if these current observations in animals were to occur in humans, the incidence of alcohol-induced hypoglycemia would conceivably be greater for alcoholic women compared to men.
Acknowledgments
This study was supported by grant number AA 11259-02 from the National Institute on Alcohol Abuse and Alcoholism.
The authors would like to thank Puja Chadha, Decie Boone, and Dr. Frank Frisch for their valuable assistance in the collection and/or analysis of data.
References
- Baio DL, Czyz CN, Van Horn CG, Ivester P, Cunningham CC. Effect of chronic ethanol consumption on respiratory and glycolytic activities of rat periportal and perivenous hepatocytes. Arch Biochem Biophy. 1998;350:193–200. doi: 10.1006/abbi.1997.0514. [DOI] [PubMed] [Google Scholar]
- Baraona E, Chaim SA, Dohmen K, Moretti M, Pozzato G, Chayes ZW, Schaefer C, Lieber CS. Gender differences in pharmokinetics of alcohol. Alcohol Clin Exp Res. 2001;25:502–507. [PubMed] [Google Scholar]
- Becker U, Deis A, Sorensen TI. Prediction of risk of liver disease by alcohol intake, sex, and age: a prospective population study. Hepatology. 1996;23:1025–1029. doi: 10.1002/hep.510230513. [DOI] [PubMed] [Google Scholar]
- Crow KE, Cornell NW, Veech RL. Lactate-stimulated ethanol oxidation in isolated rat hepatocytes. Biochem J. 1978;172:29–36. doi: 10.1042/bj1720029. [DOI] [PMC free article] [PubMed] [Google Scholar]
- Désy F, Burelle Y, Bélanger P, Gascon-Barré M, Lavoie JM. Effects of acute exercise on the gluconeogenic capacity of periportal and perivenous hepatocytes. J Appl Physiol. 2001;91:1099–1104. doi: 10.1152/jappl.2001.91.3.1099. [DOI] [PubMed] [Google Scholar]
- Dubois M, Giles KA, Hamilton JK, Rebers PA, Smith F. Colorimetric method for determination of sugars and related substances. Anal Chem. 1956;28:350–356. [Google Scholar]
- Exton JH, Park CR. Control of gluconeogenesis in liver. I. General features of gluconeogenesis in the perfused liver of rats. J Biol Chem. 1967;242:2622–2636. [PubMed] [Google Scholar]
- Garcia-Ruiz C, Morales BA, Rodes J, Kaplowitz N, Fernandez-Checa JC. Effect of chronic ethanol feeding on glutathione and functional integrity of mitochondria in periportal and perivenous rat hepatocytes. J Clin Inv. 1994;94:193–201. doi: 10.1172/JCI117306. [DOI] [PMC free article] [PubMed] [Google Scholar]
- Hohorst HJ. L-(+)-Lactate determination with lactic dehydrogenase and DPN. In: Bergmeyer HU, editor. Methods of Enzymatic Analysis. New York: Academic; 1963. pp. 266–270. [Google Scholar]
- Ivester P, Lide MJ, Cunningham CC. Effect of chronic ethanol consumption on the energy state and structural stability of periportal and perivenous hepatocytes. Arch Biochem Biophy. 1995;322:14–21. doi: 10.1006/abbi.1995.1430. [DOI] [PubMed] [Google Scholar]
- Kelly SJ, Bonthius DJ, West JR. Developmental changes in alcohol pharmokinetics in rats. Alcohol Clin Exp Res. 1987;11:281–286. doi: 10.1111/j.1530-0277.1987.tb01308.x. [DOI] [PubMed] [Google Scholar]
- Kono H, Wheeler MD, Rusyn I, Lin M, Seabra V, Rivera CA, Bradford BU, Forman DT, Thurman RG. Gender differences in early alcohol-induced liver injury: role of CD14, NF- κB, and TNF-α. Am J Physiol. 2000;278:G652–G661. doi: 10.1152/ajpgi.2000.278.4.G652. [DOI] [PubMed] [Google Scholar]
- Krebs HA. The effects of ethanol on the metabolic activities of the liver. Adv Enzyme Regul. 1968;6:467–480. doi: 10.1016/0065-2571(68)90029-0. [DOI] [PubMed] [Google Scholar]
- Krebs HA, Freedland RA, Hems R, Stubbs M. Inhibition of hepatic gluconeogenesis by ethanol. Biochem J. 1969;112:117–124. doi: 10.1042/bj1120117. [DOI] [PMC free article] [PubMed] [Google Scholar]
- Lieber CS, DeCarli LM. The feeding of ethanol in liquid diets. Alcohol Clin Exp Res. 1986;10:550–553. doi: 10.1111/j.1530-0277.1986.tb05140.x. [DOI] [PubMed] [Google Scholar]
- Lowry OH, Rosebrough NJ, Farr AL, Randall RJ. Protein measurement with the folin phenol reagent. J Biol Chem. 1951;193:265–275. [PubMed] [Google Scholar]
- Maly IP, Sasse D. Intraacinar profiles of alcohol dehydrogenase and aldehyde dehydrogeanse activities in human liver. Gastroenterology. 1991;101:1716–1723. doi: 10.1016/0016-5085(91)90412-e. [DOI] [PubMed] [Google Scholar]
- Raabo E, Terkildsen TC. On the enzymatic determination of blood glucose. Scand J Clin Lab Invest. 1960;12:402–407. doi: 10.3109/00365516009065404. [DOI] [PubMed] [Google Scholar]
- Schaffert CS, Sorrell MF, Tuma DJ. Expression and cytoskeletal association of integrin subunits is selectively increased in rat perivenous hepatocytes after chronic ethanol administration. Alcohol Clin Exp Res. 2001;25:1749–1757. [PubMed] [Google Scholar]
- Shevchuk O, Baraona E, Ma XL, Pignon JP, Lieber CS. Gender differences in the response of hepatic fatty acids and cytosolic fatty acid-binding capacity to alcohol consumption in rats. Proc Soc Exp Biol Med. 1991;198:584–590. doi: 10.3181/00379727-198-43293. [DOI] [PubMed] [Google Scholar]
- Shiota M, Fujimoto Y, Inagami M, Hiramatsu M, Moriyama M, Kimura K, Ohta M, Sugano T. Adaptive changes in zonation for gluconeogenic capacity in liver lobules of coldexposed rats. Am J Physiol. 1993;265:E559–E564. doi: 10.1152/ajpendo.1993.265.4.E559. [DOI] [PubMed] [Google Scholar]
- Sumida KD, Urdiales JH, Donovan CM. Enhanced gluconeogenesis from lactate in perfused livers after endurance training. J Appl Physiol. 1993;74:782–787. doi: 10.1152/jappl.1993.74.2.782. [DOI] [PubMed] [Google Scholar]
- Sumida KD, Qureshi T, Catanzaro MJ, Arimoto SM, Hill JM. Chronic alcohol consumption yields sex differences in whole body glucose production in rats. Alcohol Alcohol. 2004;39:418–426. doi: 10.1093/alcalc/agh082. [DOI] [PubMed] [Google Scholar]
- Sumida KD, Cogger AA, Arimoto SM, Matveyenko AV. Opposing effects of chronic alcohol consumption on hepatic gluconeogenesis from female versus male rats. Alcohol Clin Exp Res. 2005a;29:1899–1905. doi: 10.1097/01.alc.0000183025.76105.38. [DOI] [PubMed] [Google Scholar]
- Sumida KD, Crandall SC, Chadha PL, Qureshi T. Differential effects of alcohol upon gluconeogenesis from lactate in young and old hepatocytes. Exp Gerontol. 2005b;40:324–329. doi: 10.1016/j.exger.2005.01.005. [DOI] [PubMed] [Google Scholar]
- Teschke R, Wiese B. Sex-dependency of hepatic alcohol metabolizing enzymes. J Endocrinol Invest. 1982;5:243–250. doi: 10.1007/BF03348330. [DOI] [PubMed] [Google Scholar]
- Winston GW, Reitz RC. Effects of chronic ethanol ingestion on male and female rat liver glycogen phosphorylase phosphatase. Alcohol Clin Exp Res. 1984;8:277–282. doi: 10.1111/j.1530-0277.1984.tb05511.x. [DOI] [PubMed] [Google Scholar]
- Yagami T, Tohkin M, Matsubara T. Sex difference in adrenergic receptor-mediated glycogenolysis in rat livers. Jpn J Pharmacol. 1990;54:365–374. doi: 10.1254/jjp.54.365. [DOI] [PubMed] [Google Scholar]