

Abstract
Study Objectives:
Screening for sleep apnea may be useful in a number of settings, such as preoperative testing, clinical research, and evaluation for referral to a sleep center. The purpose of the study was to validate the ApneaLink™ device (ResMed Corporation, Poway, Calif) for use as a screening tool for sleep apnea in clinical practice.
Methods:
The ApneaLink device is a single-channel screening tool for sleep apnea that measures airflow through a nasal cannula connected to a pressure transducer, providing an apnea-hypopnea index (AHI) based on recording time. We compared the AHI from the ApneaLink device to that obtained during simultaneously conducted attended sleep-laboratory polysomnography to assess the sensitivity and specificity of the device in consecutive subjects with type 2 diabetes mellitus referred from a diabetes clinic. We also compared the AHI obtained from the ApneaLink device during a study in the subjects' homes to that obtained during the in-laboratory study. The laboratory study was performed within 2 weeks of the home study.
Results:
Fifty-nine subjects completed the study. Mean age of subjects was 57 years; mean body mass index was 33 kg/m2. The results demonstrate a high sensitivity and specificity of the at-home ApneaLink AHI compared with the AHI from the simultaneous polysomnographic study at all AHI levels, with the best results at an AHI of ≥ 15 events per hour (sensitivity 91%, specificity 95%). The AHI comparison from the home and laboratory studies also demonstrates good sensitivity and specificity at AHI levels of ≥ 15 and ≥ 20 events per hour (sensitivity 76%, specificity 94%, for both).
Conclusions:
Given the prevalence of sleep apnea in the adult population and in specific comorbid conditions, a screening tool may be useful in many diagnostic settings. This study demonstrates that the ApneaLink device provides reliable information, is a simple, easy-to-use device, and is highly sensitive and specific in calculating AHI, when compared with the AHI obtained from full polysomnography.
Citation:
Erman MK; Stewart D; Einhorn D et al. Validation of the ApneaLink™ for the screening of sleep apnea: a novel and simple single-channel recording device. J Clin Sleep Med 2007;3(4):387–392.
Keywords: Apnea, hypopnea, polysomnography, instrumentation, sleep apnea, screening, ApneaLink, validation
Sleep apnea is a common disorder that affects more than 20 million adult Americans.1 It is associated with poor sleep quality, excessive daytime sleepiness,2 and decreased quality of life.3 Sleep apnea has been shown to have an increased prevalence in, or association with, morbid conditions such as heart failure,4,5 hypertension,6,7 cardiovascular disease,8,9 cerebrovascular disease,10 and insulin resistance.11,12 Studies have also demonstrated that sleep apnea is associated with increased rates of traffic accidents13 and has been identified as a major public health concern.14 Although effective treatment for sleep apnea is available, referral for diagnosis and treatment of sleep apnea may be difficult in some settings due to limited access to or availability of sleep specialists and sleep laboratories for diagnostic evaluation.15 In areas in which access is not an issue, some patients may be unwilling to undergo a sleep-laboratory study, even when recommended by their physician. Current estimates reveal that 93% of women and 82% of men with moderate to severe sleep apnea remain undiagnosed.16
Given the prevalence of the disorder in the general population, and the increased prevalence in populations with certain comorbid conditions, screening studies for sleep apnea may play an important role. Although full polysomnography (PSG) is the standard diagnostic test for sleep apnea,17 the use of a screening device may allow physicians to screen for sleep apnea in a variety of settings, such as patients' homes, hospitals, or extended-care facilities, allowing more effective triaging for sleep center diagnostic testing.
A number of devices are now commercially available to screen patients for sleep apnea outside the traditional sleep-laboratory setting. These devices include single-channel and multi-channel recorders; however, there are limited data available regarding their efficacy as screening or diagnostic tools for sleep apnea, compared with PSG.18, 19 The aim of this study was to examine the accuracy of the apnea-hypopnea index (AHI) provided by the ApneaLink™ (ResMed Corporation, Poway, Calif), a single-channel recording device, against that obtained during simultaneous PSG, and to validate the ApneaLink device as a screening tool for sleep apnea in clinical practice.
METHODS
Subjects
Sixty-eight consecutive adults with a diagnosis of type 2 diabetes mellitus were approached from a diabetes-clinic population, having volunteered to participate in a companion study examining the prevalence of sleep apnea among adults with type 2 diabetes mellitus. Five withdrew consent prior to undergoing PSG (reasons not provided). Four subjects were withdrawn due to an ApneaLink test of less than 2 hours. Fifty-nine subjects completed the PSG and ApneaLink test. Exclusion criteria for participation in the study included a history of sleep apnea, use of positive pressure therapy, use of oxygen therapy, use of medications that could affect sleep, or presence of any serious respiratory or cardiac medical condition that the investigator determined could affect the subject's ability to participate in the study. An institutional review board approved the study protocol, and subjects provided informed consent prior to participation in the study. The recruitment center was a general diabetes clinic that is part of a diabetes institute in San Diego, and staff involved had no formal training in sleep medicine.
Design
Subjects were evaluated for sleep apnea during an overnight sleep study in a sleep center, and equipment setup was performed by sleep-center staff. Full PSG was performed using the Grass Telefactor system (Grass Telefactor, West Warwick, RI). Channels monitored and recorded with surface electrodes included electroencephalogram, electrooculogram, and submental electromyogram. Arterial oxygen saturation was recorded by digital pulse oximetry. Chest and abdominal effort were recorded using impedance plethysmography. Nasal airflow was recorded with nasal cannula and a pressure transducer. During the night of laboratory evaluation, subjects also wore an ApneaLink device. The nasal cannula worn by the patient during the study was attached to a “Y” connector leading to a pressure transducer, allowing simultaneous recording of the flow signal by the ApneaLink device and the PSG system.
The PSG data were manually scored using the Rechtschaffen and Kales criteria20 by registered polysomnographic technologists who were blind to both ApneaLink results and subject information. Apneas and hypopneas were defined using criteria established by the American Academy of Sleep Medicine.17 Utilizing these definitions, an apnea-hypopnea index (AHI) was calculated by dividing the total number of apneas and hypopneas by the total hours of sleep time recorded over the night.
Subjects also agreed to use the ApneaLink device at home for 1 night. Subjects were instructed on the use of the ApneaLink device by staff at the Diabetes Center and were provided further written instructions to take home. Subjects returned the ApneaLink device to the diabetes clinic the following morning, and the data were downloaded and saved. The confirmatory sleep-laboratory PSG evaluation and simultaneous ApneaLink recording was done within 2 weeks after the home ApneaLink study.
Device Description
The ApneaLink device is a single-channel screening tool for sleep apnea. The device consists of a nasal cannula attached to a small case that houses a pressure transducer. The device is held in place by a belt worn around the user's chest (Figure 1).
Figure 1.
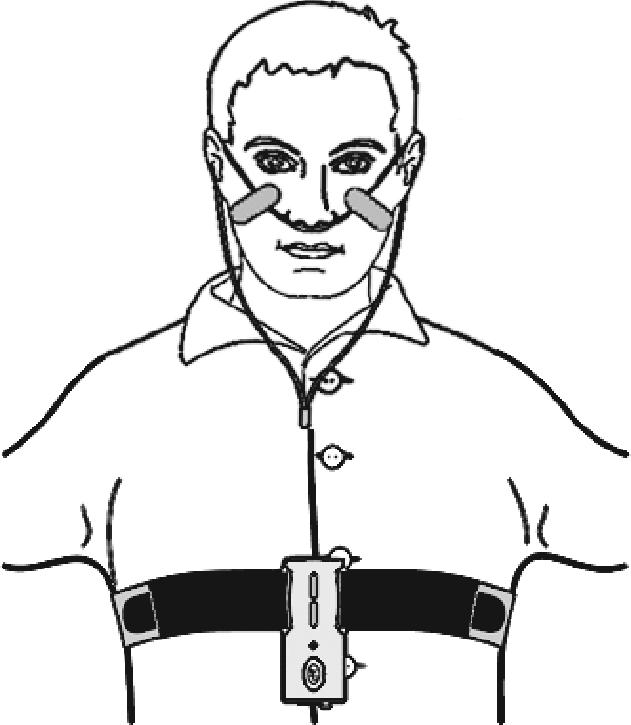
Illustration of the ApneaLink Device
The ApneaLink device operates on battery power, has a sampling rate of 100 Hz, and has a 16-bit signal processor. The internal memory storage is 15 MB, which allows for approximately 10 hours of data collection.
The ApneaLink software analyzes data generated by the flow signal, producing a 1-page report. Full disclosure of data is available for review and rescoring by the clinician. Although the device can provide information regarding snoring and inspiratory flow limitation, only the AHI information was used for this study. The ApneaLink does not discriminate obstructive from central events because the signal is based only on airflow, and there is no recording of respiratory effort. When utilized, flow limitation is analyzed by comparing the flow/time curve with a “library” of samples of possible flow-limited breaths, but this information was not assessed as part of the current protocol. The ApneaLink default settings for apneas and hypopneas were used in this study. An apnea was defined as a decrease in airflow by 80% of baseline for at least 10 seconds. The ApneaLink default maximum apnea duration was set at 80 seconds. An hypopnea was defined as a decrease in airflow by 50% to 80% of baseline for at least 10 seconds. The ApneaLink default maximum hypopnea duration was set at 100 seconds. The ApneaLink AHI used for analysis was automatically analyzed by the ApneaLink software. The ApneaLink firmware version 2.97 and the scoring software version 5.13 were used. The AHI derived from PSG was based on sleep time, whereas the AHI from the ApneaLink device was based on total study time.
Analysis
Sleep-Laboratory Study
Data were included in the analysis if an ApneaLink total recorded evaluation time of 2 hours or longer was obtained during the study.
Home Study
The AHI provided by the ApneaLink home study was compared with the AHI obtained from the ApneaLink device during the in-laboratory study. We compared the AHI values from the home study for both 2- and 4-hour recording times.
Statistical Analysis
The ApneaLink was validated against PSG, the standard clinical and research technique used to diagnose sleep apnea. This validation included measurements of sensitivity and specificity and correlation analysis. The statistical analysis plan defined a priori the endpoint criteria level required to demonstrate validity of the ApneaLink device. Determination of device validity was based on achieving a sensitivity result of at least 80% for AHI values of 5 or more events per hour and a correlation coefficient of r = 0.75, indicating a strong correlation between the AHI of PSG and that of the ApneaLink device.
Sensitivity and specificity comparisons were plotted graphically using receiver operating characteristic (ROC) curve analysis. The ROC curve plots sensitivity against 1 – specificity for various AHI values, yielding a graphic representation of the trade-off between false-negative and false-positive rates; the greater the area under the curve, the better the instrument. To quantify how quickly the ROC curve rises to the upper left hand corner, the area under the curve (AUC) is measured. The more steeply the curve moves up and then (only later) across, the better the test. An area of 1 represents a perfect instrument, and an area of 0.5 represents an instrument of no value. Bland-Altman analysis was another statistical method used to validate the results. The Bland-Altman plot is a graphic representation of the observed differences between paired measurements. The differences between the 2 techniques (PSG and ApneaLink) are plotted against the averages of the 2 techniques. The mean difference provides an estimate of whether the 2 techniques, on average, return similar results. Results showing a mean difference close to 0 indicate little systematic bias.
Correlation analysis was performed using Pearson correlation coefficients. A result of greater than r = 0.75 is considered to be indicative of good correlation between 2 techniques.
RESULTS
Sixty-three subjects completed the PSG study; 59 (29 men) had evaluable data suitable for analysis. Due to technical problems, 4 of the initial 63 subjects generated ApneaLink recording times of less than 2 hours; these data are excluded from analyses. The mean age of the 59 subjects included for analysis was 57 years (range 36–79), and their body mass index was 32.6 kg/m2 (range 20–53). Of the 59 subjects who completed the study, 69% had an AHI of 5 or more, 47% had an AHI of 10 or more, 37% had an AHI of 15 or more, and 31% had an AHI of 20 or more, based on the AHI obtained from the PSG study. Information on demographic characteristics and comorbidities of subjects is presented in Table 1, as are prevalence rates at all AHI levels.
Table 1.
Demographic Characteristics, Prevalence, and Comorbidities of 59 Participants in the Study
| Demographic Characteristic | Results |
|---|---|
| Age, y | 57.3 ± 12.0 (36 − 79) |
| BMI, kg/m2 | 32.6 ± 6.8 (19.8 − 52.9) |
| Sex | |
| Men | 29 (49) |
| Women | 30 (51) |
| Prevalence of AHI at various levels | |
| ≥ 5 | 41 (69) |
| ≥ 10 | 28 (47) |
| ≥ 15 | 22 (37) |
| ≥ 20 | 18 (31) |
| Comorbidities | |
| History of Angina | 10 (17) |
| Heart failure | 2 (3) |
| Valvular Disease | 2 (3) |
| Hypertension | 32 (54) |
| Asthma | 7 (12) |
| Bronchitis | 7 (12) |
| Allergies | 22 (37) |
Data are presented as number (%) except age and BMI, which are mean ± SD (range). Apnea-hypopnea index (AHI) values are based on polysomnography data.
ApneaLink(Lab) vs PSG
The mean overall total sleep time for PSG studies was 326 minutes, and the mean total recording time for the ApneaLink studies was 365 minutes. The sensitivity and specificity values of the ApneaLink device compared with PSG are shown in Table 2. The table shows the sensitivity, specificity, positive predictive value, negative predictive value, and AUC of the ApneaLink device, when compared with simultaneous PSG at the same cut-off for both devices (e.g., if sleep apnea is diagnosed on the basis of an AHI ≥ 5 events/hour when measured by PSG, this is compared to a cut-off of an AHI ≥ 5 events/hour for sleep apnea when measured by the ApneaLink device). The sensitivity for the ApneaLink was greater than 80% at all AHI values, achieving our predefined endpoint criterion. The ApneaLink device had the highest sensitivity and specificity at an AHI value of 15 or more events per hour (91% and 95%, respectively). It also showed high sensitivity and specificity (> 80%) at AHI values of 10 or more events per hour and 20 or more events per hour. At lower AHI levels, the device had good sensitivity but a lower specificity, leading to a greater number of false-positive results.
Table 2.
Sensitivity and Specificity of the ApneaLink AHI Against Polysomnography AHI During Simultaneous Testing (In-Laboratory) Subjects With 2 Hours or More of ApneaLink Data Recording
| AHI | Sensitivity | Specificity | PPV | NPV | AUC |
|---|---|---|---|---|---|
| ≥ 5 | 85.4 | 50.0 | 79.6 | 60.0 | 0.863 |
| ≥ 10 | 82.1 | 83.9 | 82.1 | 83.9 | 0.862 |
| ≥ 15 | 90.9 | 94.6 | 90.9 | 94.6 | 0.977 |
| ≥ 20 | 83.3 | 92.7 | 83.3 | 92.7 | 0.967 |
AHI refers to AHI; PPV, positive predictive value; NPV, negative predictive value; AUC, area under the curve.
Given the results showing that the sensitivity was slightly higher at an AHI of 15 than 20 events per hour, ROC curves were constructed. Although the ROC-curve comparison confirmed an AHI cut-off value of 15 or more events per hour provided the best results (Figure 2), AUC analysis demonstrated that the results for 15 or more and 20 or more events per hour were almost identical, with AUC values of 0.977 and 0.967, respectively. The AUC results for all AHI values are shown in Table 2 and demonstrate very good to excellent agreement between ApneaLink and PSG.
Figure 2.

Receiver-operator characteristic curves ApneaLink(lab)apnea-hypopnea index (AHI) and polysomnography (PSG) AHI. PSG 5: area under the curve (AUC) = 0.863; PSG 10: AUC = 0.862; PSG 15: AUC = 0.977; PSG 20: AUC = 0.967.
A Bland-Altman plot of the data shows a reasonably tight distribution of the differences between the AHI from PSG and ApneaLink (Figure 3). For AHI values of 30 or less per hour, the ApneaLink does not demonstrate any systematic bias. For AHI values more than 30, the absolute discrepancy between ApneaLink and PSG widens, and there is a tendency for the ApneaLink to understate the AHI score. When used as a screening tool in this high-AHI range, the systematic bias is not problematic because subjects rated in this category are highly likely to have sleep apnea. The downward bias of the ApneaLink at higher values does not appear so large that a practitioner would make the wrong decision and fail to refer a patient for more-extensive testing.
Figure 3.

Bland-Altman plot of ApneaLink apnea-hypopnea index (AHI) and polysomnography (PSG) AHI data during in-laboratory study.
The ApneaLink AHI results showed a strong correlation (Pearson correlation coefficients) to AHI results from PSG; the correlation coefficient was r = 0.89.
ApneaLink(home) vs ApneaLink(lab)
The results comparing the AHI gained from the ApneaLink device in the home against the AHI from the attended laboratory-based ApneaLink study are shown in Table 3 for both 2-and 4-hour recording times. The table shows the sensitivity, specificity, positive predictive value, negative predictive value, and AUC of the ApneaLink device at home when compared with the ApneaLink device in the laboratory at the same cut-off for both devices (e.g., if sleep apnea is diagnosed on the basis of an AHI ≥ 5 events/hour when measured by ALlab, this is compared to a cut-off of an AHI ≥ 5 events/hour for sleep apnea when measured by AL-home). These results demonstrate good sensitivity and specificity using an AHI of 15 or more and 20 or more with recording times of at least 4 hours. There were 52 subjects in the 2-hour group and 39 subjects in the 4-hour group.
Table 3.
Sensitivity and Specificity Analysis: ApneaLink(home) vs ApneaLink (lab)
| AHI | Sensitivity |
Specificity |
PPV |
NPV |
AUC |
|||||
|---|---|---|---|---|---|---|---|---|---|---|
| 2 h | 4 h | 2 h | 4 h | 2 h | 4 h | 2 h | 4 h | 2 h | 4 h | |
| ≥ 5 | 90.0 | 90.0 | 75.0 | 66.7 | 92.3 | 90.0 | 69.2 | 66.7 | 0.881 | 0.878 |
| ≥ 10 | 83.3 | 81.3 | 78.6 | 73.9 | 76.9 | 68.4 | 84.6 | 85.0 | 0.874 | 0.842 |
| ≥ 15 | 76.2 | 84.6 | 93.6 | 92.3 | 88.9 | 84.6 | 85.3 | 92.3 | 0.922 | 0.923 |
| ≥ 20 | 76.5 | 81.8 | 94.3 | 96.4 | 86.7 | 90.0 | 89.2 | 93.1 | 0.931 | 0.971 |
The apnea-hypopnea index (AHI) obtained from ApneaLink study in the home versus the ApneaLink AHI obtained during the sleep laboratory study. 2 hours (at-home and in-lab) = 52 subjects. 4 hours (at-home and in-lab) = 39 subjects. PPV refers to positive predictive value; NPV, negative predictive value; AUC, area under the curve.
ROC analysis showed that AHI cut-off values of 15 or more and 20 or more events per hour provided the same results for the at least 2 hours group (Figure 4), whereas the 20 or more events per hour provided the best results for the longer than 4 hours group (Figure 5). The AUC data for these results are shown in Table 3 and demonstrate values of 0.84 or above for all AHI values, showing high agreement.
Figure 4.

Receiver-operator characteristic curves from the ApneaLink apnea-hypopnea index (AHI) at home versus the ApneaLink AHI from the in-laboratory study (2-hour data). PSG 5: area under the curve (AUC) = 0.881, PSG 10: AUC = 0.874, PSG 15: AUC = 0.922, PSG 20: AUC = 0.931
Figure 5.

Receiver-operator characteristic curves from the ApneaLink apnea-hypopnea index (AHI) at home versus the ApneaLink AHI from the in-laboratory study (4-hour data). PSG 5: area under the curve (AUC) = 0.878, PSG 10: AUC = 0.842, PSG 15: AUC = 0.923, PSG 20: AUC = 0.971.
DISCUSSION
These results show that the ApneaLink device demonstrated clinical utility as a screening device for sleep apnea in a group of adults with type 2 diabetes mellitus. In comparison with PSG data obtained in the sleep laboratory, the ApneaLink device demonstrated a high level of sensitivity (>80%) at all AHI levels, confirming the capacity of the device to recognize significant levels of sleep apnea, when present. From the perspective of specificity, which reflects the capacity to avoid excessive false-negative findings, the device provided best agreement with laboratory-based PSG data at levels of AHI of 15 or more. This result is consistent with the results of a previous validation study that demonstrated good sensitivity and specificity for the ApneaLink device at an AHI of 10 or more, when compared with an AHI from PSG in a population referred to a sleep center for the assessment of sleep apnea.21
These data support the use of the ApneaLink for screening studies for sleep apnea in subjects with a high probability of having or in populations with a high prevalence of sleep-disordered breathing. Although laboratory-based PSG is the standard diagnostic test for sleep apnea, various populations of patients suspected of having sleep apnea may not be willing or able to obtain a PSG study in a sleep center; laboratory facilities may be distant from the patient, the referring physician may not be certain that enough clinical evidence is present to support a sleep-laboratory referral, or the patient may be unwilling to proceed with an overnight laboratory-based PSG without data confirming the presence of sleep apnea. These results would suggest the ApneaLink is a useful adjunctive technology for clarification of the presence or absence of sleep apnea in these types of settings.
As a screening device, it is preferable to have technology that “screens in” (ie, provides a high level of sensitivity with acceptable specificity) rather than one that “screens out” (ie, provides a high number of false negatives). From a “case finding” and public health perspective, it is acceptable for patients to be identified with possible sleep apnea based on a screening test that is not confirmed by PSG; however, it is not acceptable to have patients with sleep apnea to be misidentified as “normal,” thus never receiving PSG evaluation that would have confirmed the presence of sleep apnea and increased the probability that appropriate therapy for sleep apnea would be initiated. The data from this study demonstrate that the ApneaLink device provides both a high sensitivity and specificity at AHI levels of 10 or more.
The accuracy of the ApneaLink device depends on how well it can identify those with and without sleep apnea. ROC curves were constructed, and the AUC measured. In general, AUC values for a particular screening instrument such as ApneaLink can be interpreted as follows: 0.9 to 1 is Excellent, 0.8 to 0.9 is Very Good, and 0.7 to 0.8 is Good. At all AHI cut-off levels, the high AUC values indicate very good agreement between methodologies.
Comparison of AHI from home- and sleep laboratory-based nights demonstrated that 4 or more hours of recording time is optimal, providing the greatest accuracy. The data suggest that a recording time of less than 4 hours leads to more-frequent false-negative results at AHI levels of 15 or more. A longer recording period minimized this trend and is presumably related to a longer and more representative sleep duration. Given that the costs for recordings are minimal (batteries and cannula), it can be recommended that a second night of recording should be obtained when the initial study time is found to have been less than 4 hours.
It would be useful to validate further this type of device in a general population. Given that the prevalence of sleep apnea is high in adults with type 2 diabetes mellitus,22–24 these results may not apply to other populations in which the prevalence of sleep apnea is low or unknown. The only other published validation study of this device was performed in a population that was referred to a sleep center for investigation of possible sleep-related breathing disorders.21
Given the sensitivity and specificity of the device, as well as the ease of use and low study cost, the ApneaLink device may be useful in situations in which PSG is initially impractical or in populations with comorbidities that suggest a high prevalence of sleep apnea to help define further diagnostic and treatment options. The positive predictive value of greater than 80% at AHI levels of 10 or more supports the utility of the device. Further experience with the ApneaLink device in 207 subjects suggests that the device may be readily used in unattended settings.25
Due to the prevalence of sleep apnea in the general population and the increased prevalence in certain disease states, screening devices may aid in identifying and triaging patients with the disorder. This may lead to more-timely evaluation of sleep apnea in those with moderate to severe disease, ultimately providing improved access, better patient care, and improved health and lifestyle outcomes.
ACKNOWLEDGEMENTS
The authors would like to thank the staff at Pacific Sleep Medicine Services, San Diego, Calif, and The Whittier Institute for Diabetes, La Jolla, Calif.
Footnotes
Disclosure Statement
This study was supported by a research grant from ResMed Corporation. Dr. Stewart is a paid consultant to ResMed Corporation. Ms. Gordon is owner/operator of Gordon & Associates which was under contract to ResMed Corporation for this study. Ms. Casal is the Director of Clinical Affairs for ResMed Corporation. Drs. Erman and Einhorn have indicated no other conflicts of interest.
REFERENCES
- 1.Young T, Peppard PE, Gottlieb DJ. Epidemiology of obstructive sleep apnea: a population health perspective. Am J Respir Crit Care Med. 2002;165:1217–39. doi: 10.1164/rccm.2109080. [DOI] [PubMed] [Google Scholar]
- 2.Gottlieb DJ, Whitney CW, Bonekat WH, et al. Relation of sleepiness to respiratory disturbance index: the Sleep Heart Health Study. Am J Respir Crit Care Med. 1999;159:502–7. doi: 10.1164/ajrccm.159.2.9804051. [DOI] [PubMed] [Google Scholar]
- 3.Baldwin CM, Griffith KA, Nieto FJ, O'Connor GT, Walsleben JA, Redline S. The association of sleep-disordered breathing and sleep symptoms with quality of life in the Sleep Heart Health Study. Sleep. 2001;24:96–105. doi: 10.1093/sleep/24.1.96. [DOI] [PubMed] [Google Scholar]
- 4.Javaheri S, Parker TJ, Liming JD, et al. Sleep apnea in 81 ambulatory male patients with stable heart failure. Types and their prevalences, consequences, and presentations. Circulation. 1998;97:2154–9. doi: 10.1161/01.cir.97.21.2154. [DOI] [PubMed] [Google Scholar]
- 5.Sin DD, Fitzgerald F, Parker JD, Newton G, Floras JS, Bradley TD. Risk factors for central and obstructive sleep apnea in 450 men and women with congestive heart failure. Am J Respir Crit Care Med. 1999;160:1101–6. doi: 10.1164/ajrccm.160.4.9903020. [DOI] [PubMed] [Google Scholar]
- 6.Robinson GV, Stradling JR, Davies RJ. Sleep 6: obstructive sleep apnoea/hypopnoea syndrome and hypertension. Thorax. 2004;59:1089–94. doi: 10.1136/thx.2003.015875. [DOI] [PMC free article] [PubMed] [Google Scholar]
- 7.Peppard PE, Young T, Palta M, Skatrud J. Prospective study of the association between sleep-disordered breathing and hypertension. N Engl J Med. 2000;342:1378–84. doi: 10.1056/NEJM200005113421901. [DOI] [PubMed] [Google Scholar]
- 8.Shahar E, Whitney CW, Redline S, et al. Sleep-disordered breathing and cardiovascular disease: cross-sectional results of the Sleep Heart Health Study. Am J Respir Crit Care Med. 2001;163:19–25. doi: 10.1164/ajrccm.163.1.2001008. [DOI] [PubMed] [Google Scholar]
- 9.Hamilton GS, Solin P, Naughton MT. Obstructive sleep apnoea and cardiovascular disease. Intern Med J. 2004;34:420–6. doi: 10.1111/j.1445-5994.2004.00596.x. [DOI] [PubMed] [Google Scholar]
- 10.Bassetti C, Aldrich MS. Sleep apnea in acute cerebrovascular diseases: final report on 128 patients. Sleep. 1999;22:217–23. doi: 10.1093/sleep/22.2.217. [DOI] [PubMed] [Google Scholar]
- 11.Ip MS, Lam B, Ng MM, Lam WK, Tsang KW, Lam KS. Obstructive sleep apnea is independently associated with insulin resistance. Am J Respir Crit Care Med. 2002;165:670–6. doi: 10.1164/ajrccm.165.5.2103001. [DOI] [PubMed] [Google Scholar]
- 12.Punjabi NM, Sorkin JD, Katzel LI, Goldberg AP, Schwartz AR, Smith PL. Sleep-disordered breathing and insulin resistance in middle-aged and overweight men. Am J Respir Crit Care Med. 2002;165:677–82. doi: 10.1164/ajrccm.165.5.2104087. [DOI] [PubMed] [Google Scholar]
- 13.Young T, Blustein J, Finn L, Palta M. Sleep-disordered breathing and motor vehicle accidents in a population-based sample of employed adults. Sleep. 1997;20:608–13. doi: 10.1093/sleep/20.8.608. [DOI] [PubMed] [Google Scholar]
- 14.Phillipson EA. Sleep apnea-a major public health problem. N Engl J Med. 1993;328:1271–3. doi: 10.1056/NEJM199304293281712. [DOI] [PubMed] [Google Scholar]
- 15.Flemons WW, Douglas NJ, Kuna ST, Rodenstein DO, Wheatley J. Access to diagnosis and treatment of patients with suspected sleep apnea. Am J Respir Crit Care Med. 2004;169:668–72. doi: 10.1164/rccm.200308-1124PP. [DOI] [PubMed] [Google Scholar]
- 16.Young T, Evans L, Finn L, Palta M. Estimation of the clinically diagnosed proportion of sleep apnea syndrome in middle-aged men and women. Sleep. 1997;20:705–6. doi: 10.1093/sleep/20.9.705. [DOI] [PubMed] [Google Scholar]
- 17.Sleep-related breathing disorders in adults: recommendations for syndrome definition and measurement techniques in clinical research. The Report of an American Academy of Sleep Medicine Task Force. Sleep. 1999;22:667–89. [PubMed] [Google Scholar]
- 18.Chesson AL, Jr, Berry RB, Pack A. Practice parameters for the use of portable monitoring devices in the investigation of suspected obstructive sleep apnea in adults. Sleep. 2003;26:907–13. doi: 10.1093/sleep/26.7.907. [DOI] [PubMed] [Google Scholar]
- 19.Flemons WW, Littner MR, Rowley JA, et al. Home diagnosis of sleep apnea: a systematic review of the literature. An evidence review cosponsored by the American Academy of Sleep Medicine, the American College of Chest Physicians, and the American Thoracic Society. Chest. 2003;124:1543–79. doi: 10.1378/chest.124.4.1543. [DOI] [PubMed] [Google Scholar]
- 20.Rechtschaffen A, Kales A, editors. A Manual of Standardized Terminology and Scoring System for Sleep Stages of Human Subjects. Los Angeles: Brain Information Service/Brain Research Institute, University of California at Los Angeles; 1998. [Google Scholar]
- 21.Wang Y, Teschler T, Weinreich G, Hess S, Wessendorf TE, Teschler H. Validation of microMESAM as screening device for sleep disordered breathing. Pneumologie. 2003;57:734–40. doi: 10.1055/s-2003-812423. [DOI] [PubMed] [Google Scholar]
- 22.Brooks B, Cistulli PA, Borkman M, et al. Obstructive sleep apnea in obese noninsulin-dependent diabetic patients: effect of continuous positive airway pressure treatment on insulin responsiveness. J Clin Endocrinol Metab. 1994;79:1681–5. doi: 10.1210/jcem.79.6.7989475. [DOI] [PubMed] [Google Scholar]
- 23.Katsumata K, Okada T, Miyao M, Katsumata Y. High incidence of sleep apnea syndrome in a male diabetic population. Diabetes Res Clin Pract. 1991;13:45–51. doi: 10.1016/0168-8227(91)90032-9. [DOI] [PubMed] [Google Scholar]
- 24.Resnick HE, Redline S, Shahar E, et al. Diabetes and sleep disturbances: findings from the Sleep Heart Health Study. Diabetes Care. 2003;26:702–9. doi: 10.2337/diacare.26.3.702. [DOI] [PubMed] [Google Scholar]
- 25.Einhorn D, Erman M, Philis-Tsimikas A, Gordon G. Prevalence and association of sleep apnea in a population of adults with type 2 diabetes mellitus. Diabetes. 2005;54(Suppl 1):A582. doi: 10.4158/EP.13.4.355. [DOI] [PubMed] [Google Scholar]