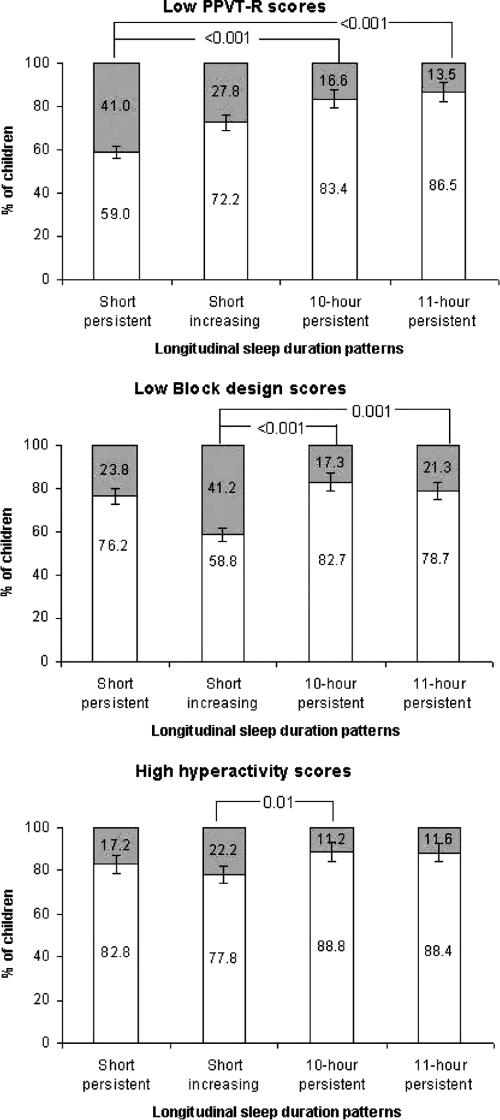
Figure 2.
Grey areas indicate percentage of children who had low performances on the PPVT-R, on the Block design or high hyperactivity ratings as a function of sleep duration patterns. Chi-square tests (4 X 2) were used to measure the distribution of low performance on the PPVT-R (P<0.001) and on the Block design subtest (P=0.001) and high hyperactivity ratings (P=0.04) with different sleep duration patterns. Data courtesy of the Quebec Institute of Statistics.

