Abstract
Disruptions of the melanocortin signaling system have been linked to obesity. We investigated a possible role of the central nervous melanocortin system (CNS-Mcr) in the control of adiposity through effects on nutrient partitioning and cellular lipid metabolism independent of nutrient intake. We report that pharmacological inhibition of melanocortin receptors (Mcr) in rats and genetic disruption of Mc4r in mice directly and potently promoted lipid uptake, triglyceride synthesis, and fat accumulation in white adipose tissue (WAT), while increased CNS-Mcr signaling triggered lipid mobilization. These effects were independent of food intake and preceded changes in adiposity. In addition, decreased CNS-Mcr signaling promoted increased insulin sensitivity and glucose uptake in WAT while decreasing glucose utilization in muscle and brown adipose tissue. Such CNS control of peripheral nutrient partitioning depended on sympathetic nervous system function and was enhanced by synergistic effects on liver triglyceride synthesis. Our findings offer an explanation for enhanced adiposity resulting from decreased melanocortin signaling, even in the absence of hyperphagia, and are consistent with feeding-independent changes in substrate utilization as reflected by respiratory quotient, which is increased with chronic Mcr blockade in rodents and in humans with loss-of-function mutations in MC4R. We also reveal molecular underpinnings for direct control of the CNS-Mcr over lipid metabolism. These results suggest ways to design more efficient pharmacological methods for controlling adiposity.
Introduction
Energy homeostasis, the balance of caloric intake and energy expenditure, is regulated by closely interconnected neuroendocrine and autonomic pathways emanating from and controlled by the CNS. Specific neurocircuitry, which is mainly located in hypothalamic and brain stem areas, continuously monitors signals reflecting energy status and initiates appropriate behavioral and metabolic responses to fluctuations in nutrient availability (1–4). Melanocortin neurons expressing genes encoding the endogenous ligands for melanocortin receptors (Mcr) are essential components of the system within the CNS that controls nutrient intake and energy metabolism (5–10). The central nervous melanocortin system (CNS-Mcr) is also the direct central target of crucial afferent vagal and endocrine signals indicating acute and chronic energy availability, including leptin, insulin, cholecystokinin, and ghrelin (11–18).
Endogenous Mcr agonists result from posttranslational processing of proopiomelanocortin (POMC) into melanocyte-stimulating hormones (αMSH, βMSH, γMSH) in the hypothalamic arcuate nucleus and elsewhere. The endogenous antagonist (inverse Mcr agonist), agouti-related protein (Agrp), is coexpressed with neuropeptide Y (Npy), both neuropeptides being potent orexigenic and anabolic factors, in a distinct subset of neurons in the mediobasal hypothalamus. Melanocortin ligands bind with varying affinity at 5 subtypes of G protein–coupled Mcr. In the CNS, Mc3rs and Mc4rs have been demonstrated to be most relevant to the regulation of energy homeostasis (19). In rodent models, activation of CNS-Mcr (20) or ablation of Agrp/Npy-coexpressing neurons (21–23) results in anorexia and weight loss, whereas blockade or targeted gene disruption of CNS-Mcr or removal of agonist-producing neurons leads to hyperphagia and obesity (24, 25). In humans, loss-of-function mutations in MC4R are associated with hyperphagia, severe early-onset obesity, hyperinsulinemia, and increased lean mass (26–30), a phenotype that closely mirrors that seen in the Mc4r-KO mouse (25), supporting an essential role for the melanocortin system in energy homeostasis across mammalian species.
It has recently been reported that the CNS-Mcr also directly controls hepatic glucose metabolism (31) and cellular thermogenesis in brown adipose tissue (BAT) (32). These findings confirmed the existence of a direct neuroendocrine control over peripheral cell metabolism as an important part of the central nervous control of body adiposity (7, 33, 34). Furthermore, a study by Rahmouni and colleagues suggested a possible role of the sympathetic nervous system (SNS) as a mediator of the Mcr-induced changes in peripheral metabolism (35).
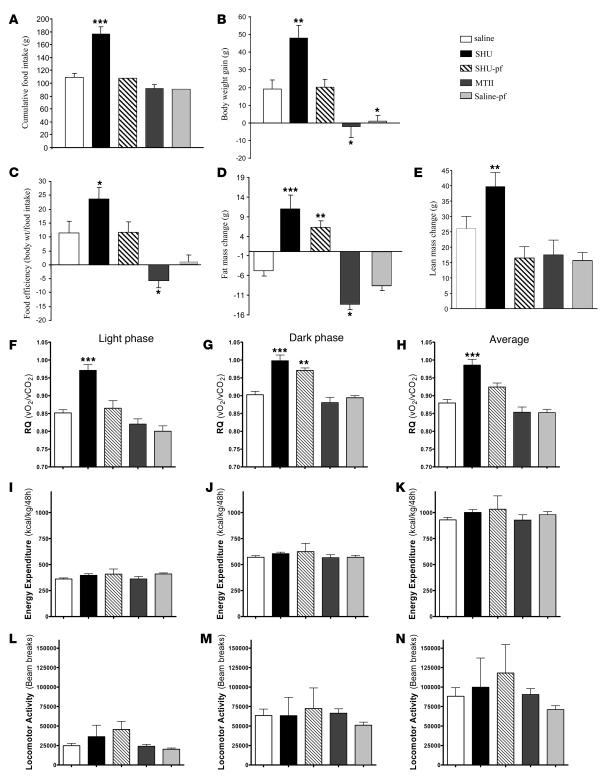
Previous observations in other laboratories (36, 37) indicate that pharmacological or genetic blockade of CNS-Mcr increases fat mass in the absence of hyperphagia, whereas stimulation of CNS-Mcr reduces adiposity (38). Our current study supports those findings (Figure 1). We therefore hypothesized that the CNS-Mcr may directly regulate peripheral lipid metabolism and nutrient partitioning, as suggested in previous studies (39–42). In the present work, we demonstrate for the first time to our knowledge that the level of CNS-Mcr activity potently and rapidly determines the balance among cellular glucose uptake, triglyceride (TAG) synthesis, lipid deposition, and lipid mobilization in liver, muscle, and adipose tissue. These effects precede changes in adiposity and are independent of changes in food intake, consistent with the hypothesis that the CNS-Mcr controls adiposity levels rapidly and perhaps more efficiently than other known CNS pathways.
Figure 1. Effect of a 7-day i.c.v. SHU9119 (24 nmol/d) and MTII (1 nmol/d) infusion on cumulative food intake (A), body weight gain (B), food efficiency (C), fat mass change (D), lean mass change (E), RQ (F–H), energy expenditure (I–K), and locomotor activity (L–N).
Food efficiency was calculated as the ratio between body weight gain over the 7-day experimental period and cumulative food intake and was expressed as a percentage. Body fat was determined by NMR imaging. RQ, energy expenditure, and locomotor activity were measured over the last 3 days of the experiment during the light and dark phases. Values are mean ± SEM of 7–8 animals per group. *P < 0.05; **P < 0.01; ***P < 0.001 versus controls.
Results
CNS-Mcr activity controls adiposity independent of food intake.
Blockade of CNS-Mcr via chronic intracerebroventricular (i.c.v.) infusion of the Agrp-like Mcr antagonist (inverse-agonist) SHU9119 (24 nmol/d for 7 days) increased food intake in ad libitum–fed rats (SHU9119-ad lib) compared with i.c.v. saline–infused controls (Figure 1A). A second control group of i.c.v. SHU9119–infused animals was pair-fed to match the intake of saline-infused controls (SHU9119-pf). Activation of CNS-Mcr via chronic i.c.v. infusion of the Mcr agonist MTII (1 nmol/d for 7 days) only transiently modified feeding behavior and did not change total food intake over the 72 hours before euthanasia. In addition, a pair-fed saline-infused control group was also included that was limited to the daily amount of calories ingested by the i.c.v. MTII-treated animals. Weight gain of i.c.v. SHU9119-ad lib rats was significantly higher than that of controls or SHU9119-pf rats, whereas the i.c.v. MTII–treated group exhibited an expected net loss of body weight, the body weight of these animals remained comparable to that of the saline pair-fed group (Figure 1B). SHU9119 treatment potently increased metabolic efficiency, calculated as the ratio of body weight gain per amount of food consumed during the 7-day experimental period (Figure 1C). In rats with ad libitum access to food, body weight increase following CNS-Mcr blockade correlated with a net gain of fat mass as determined by nuclear magnetic resonance (Figure 1D). Interestingly, rats with CNS-Mcr blockade that were pair-fed with saline-infused controls also had a substantial increase in fat mass that was consistent with their increased metabolic efficiency, even in the absence of hyperphagia (Figure 1D), whereas no differences in lean mass were observed between rats with CNS-Mcr blockade and saline pair-fed (Figure 1E). On the other hand and as expected, activation of the CNS-Mcr significantly decreased fat mass.
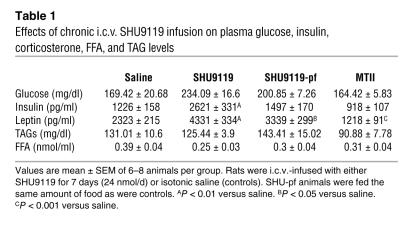
Chronic CNS-Mcr blockade did not change plasma levels of glucose, FFA, or TAG (Table 1). Plasma insulin levels were significantly increased by CNS-Mcr blockade in rats with ad libitum access to food (SHU9119-ad lib), but the increase failed to reach significance under pair-feeding conditions (Table 1). These findings indicate that blockade of CNS-Mcr might promote insulin resistance but that this process appears to require excess nutrients driven by Mcr-induced hyperphagia. Chronic activation of CNS-Mcr was associated with a negative energy balance, without any significant effects on fasting plasma glucose, insulin, FFA, or TAG levels (Table 1).
Table 1 .
Effects of chronic i.c.v. SHU9119 infusion on plasma glucose, insulin, corticosterone, FFA, and TAG levels
Centrally triggered changes in energy expenditure may result from BAT resting thermogenesis or non-exercise activity thermogenesis. To determine whether those changes could fully explain the CNS-Mcr blockade–induced and food intake–independent increase in adiposity, we measured total energy expenditure using indirect calorimetry. Chronic blockade of CNS-Mcr did not significantly alter total energy expenditure or spontaneous physical activity (Figure 1, I and N). However, we detected decreased gene levels of uncoupling proteins (UCPs) in BAT (UCP1, UCP3; Supplemental Figure 1, A and B; supplemental material available online with this article; doi:10.1172/JCI31743DS1) that are consistent with reduced SNS outflow and lower thermogenic activity in BAT. This discordance between the molecular and physiological findings might result from a limited sensitivity of the indirect calorimetry method. Interestingly however, blockade of CNS-Mcr resulted in a significant increase in the respiratory quotient (RQ) (Figure 1, F–H) and a decreased percentage of fat utilization of total energy consumption that was independent of hyperphagia (Supplemental Table 1). Therefore, these results indirectly implied altered nutrient partitioning as an alternative explanation for feeding-independent changes in adiposity: a shift toward decreased metabolic use of lipids leading to elevated fat deposition rates.
CNS-Mcr activity levels determine white adipose tissue TAG metabolism.
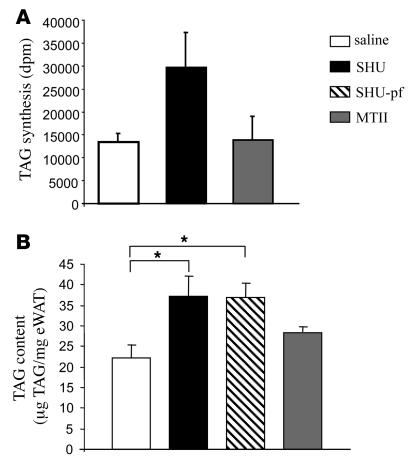
Both the feeding-independent increase in the RQ and the similar increase in fat mass in i.c.v. SHU9119-ad lib and i.c.v. SHU9119-pf rats relative to controls suggest that SHU9119 infusion could directly stimulate TAG uptake, synthesis, and/or storage in white adipose tissue (WAT). To test that hypothesis, we first measured WAT lipid production and found that during chronic pharmacological blockade of CNS-Mcr, rats had a 100% increase in adipocyte TAG synthesis rate (Figure 2A). The observed increase in TAG synthesis by WAT was consistent with an increase in the total TAG content in WAT of both SHU9119-ad lib and SHU9119-pf rats (saline 22.2 ± 3.2 μg TAG/mg WAT; SHU9119-ad lib 37.1 ± 4.9; SHU9119-pf 36.8 ± 3.6) (Figure 2B), whereas there were no differences between the saline-ad lib and the MTII-infused rats. Although the overall food intake and the amount of fat mass were lower in the MTII group in comparison with the saline-ad lib controls (Figure 1D), food intake was the same in those 2 groups during the last 72 hours of the treatment.
Figure 2. Effect of a 7-day i.c.v. SHU9119 (24 nmol/d) and MTII (1 nmol/d) infusion on synthesis of TAG (A) and TAG content in epididymal WAT (eWAT) (B).
*P < 0.05 versus controls.
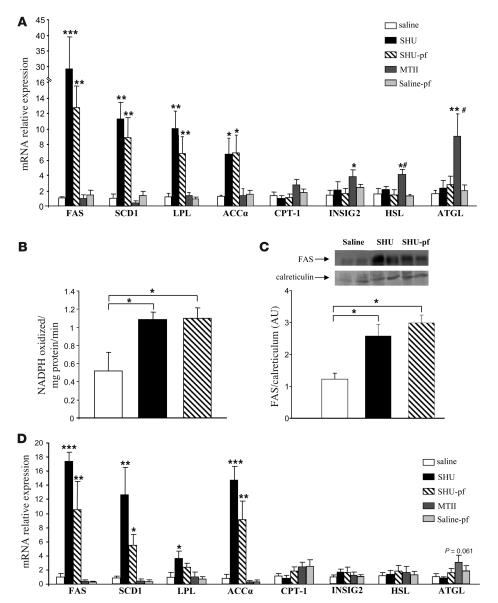
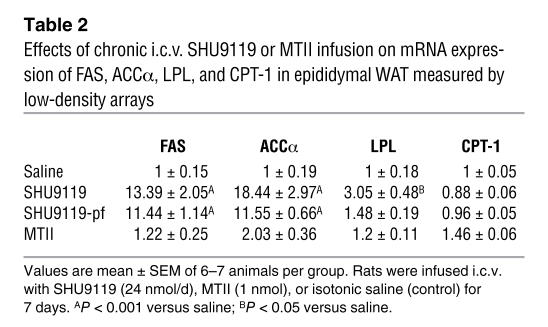
To further dissect the molecular underpinnings responsible for the increased synthesis and content of TAG in WAT, we analyzed the expression profile of key enzymes involved in lipid metabolism. Independent of hyperphagia, i.c.v. SHU9119 markedly increased mRNA levels of genes promoting lipogenesis and TAG storage in adipocytes, including stearoyl-CoA desaturase–1 (SCD1) (SHU9119-ad lib: 11.2-fold increase; SHU9119-pf: 8.8-fold increase), lipoprotein lipase (LPL) (SHU9119-ad lib: 10.7-fold increase; SHU9119-pf: 7-fold increase), acetyl-CoA carboxylase α (ACCα) (SHU9119-ad lib: 7.1-fold increase; SHU9119-pf: 7.7-fold increase), and fatty acid synthase (FAS) (SHU9119-ad lib: 28-fold increase; SHU9119-pf: 11.5-fold increase) (Figure 3). mRNA levels of fat-oxidizing enzymes including carnitine palmitoyl transferase–1a (CPT-1a) were not modified in i.c.v. SHU–treated rats but were slightly increased in rats after i.c.v. infusion of the Mcr agonist MTII. In addition, i.c.v. MTII infusion resulted in higher WAT mRNA expression (2.69-fold increase) of insulin-induced gene 2 (INSIG2), an inhibitor for the activation of cholesterol synthesis, and in higher mRNA levels (2.59-fold increase) of hormone-sensitive lipase (HSL) (the phosphorylated form of HSL is a marker of lipid mobilization in WAT). Chronic i.c.v. MTII infusion also increased mRNA expression of adipose TAG lipase (ATGL), which was recently identified as an important triacylglycerol hydrolase promoting the catabolism of stored fat (43) (Figure 3A). Low-density RNA microarrays were performed as an additional mRNA quantification method and confirmed the results generated by real-time PCR (Table 2). The findings on a transcriptional level were further confirmed by enzyme activity and functional assays. Increased FAS mRNA levels in WAT were consistent with increased functional FAS activity in both SHU9119-ad lib and SHU9119-pf animals (saline: 0.5 ± 0.2 NADPH oxidized/mg protein/min; SHU9119-ad lib: 1.08 ± 0.08; SHU9119-pf: 1.1 ± 0.1) (Figure 3B) and with a higher FAS protein expression in the epididymal WAT of both SHU9119-ad lib and SHU9119-pf animals (Figure 3C).
Figure 3. Effects of CNS-Mcr on WAT.
(A) Effect of a 7-day i.c.v. SHU9119 (24 nmol/d) and MTII (1 nmol/d) infusion on epididymal WAT mRNA expression of FAS, SCD-1, LPL, ACCα, CPT-1a, INSIG2, hormone-sensitive lipase (HSL), and adipose TAG lipase (ATGL). Effect of a 7-day i.c.v. SHU9119 (24 nmol/d) and MTII (1 nmol/d) infusion on epididymal WAT FAS activity (B) and FAS protein expression (C). (D) Effect of a 48-hour i.c.v. SHU9119 (24 nmol/d) and MTII (1 nmol/d) infusion on epididymal WAT mRNA expression of FAS, SCD1, LPL, ACCα, CPT-1a, INSIG2, HSL, and ATGL. Data are presented as values normalized to the housekeeping gene RPS29. mRNA levels are relative to controls. Values are mean ± SEM of 7–8 animals per group. ***P < 0.001, **P < 0.01 versus controls; #P < 0.05 MTII versus saline-pf; *P < 0.05.
Table 2 .
Effects of chronic i.c.v. SHU9119 or MTII infusion on mRNA expression of FAS, ACCα, LPL, and CPT-1 in epididymal WAT measured by low-density arrays
Rapid effects of CNS-Mcr blockade on WAT metabolism.
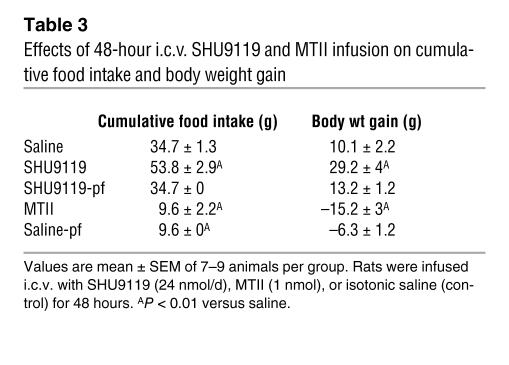
In order to determine whether the observed effects of CNS-Mcr blockade could simply be a consequence of increased adiposity, we assessed whether a short-term i.c.v. infusion would cause rapid changes in adipocyte metabolism similar to those observed over 7 days of treatment. After only 48 hours of SHU9119 infusion, mRNA levels of FAS (19.7-fold increase), ACCα (14.1-fold increase), SCD1 (8.1-fold increase), and LPL (2.7-fold increase) increased in WAT compared with levels in the saline group (Figure 3D), indicating that CNS-Mcr–induced changes in WAT TAG metabolism may precede massive changes in adiposity rather than occurring as a consequence of them (Table 3). The increased expression of these lipogenic enzymes was also observed in the SHU9119-pf group. Acute activation of central Mcr using this experimental design revealed a slight increase in ATGL levels only (Figure 3D).
Table 3 .
Effects of 48-hour i.c.v. SHU9119 and MTII infusion on cumulative food intake and body weight gain
Interference of peripheral Mcr activity.
To rule out the possibility that centrally infused SHU9119 or MTII leaks out of the CNS into the circulation and elicits a response by directly acting at peripheral Mcr, we chronically administered both ligands peripherally (7 days, via s.c. minipumps). Using the same doses as those infused centrally, we were unable to detect changes in body weight, body fat, thermogenesis, or lipid metabolism following peripheral infusion of Mcr ligands (data not shown). We therefore conclude that the effects observed during i.c.v. administration were due entirely to CNS-Mcr.
Role of the SNS.
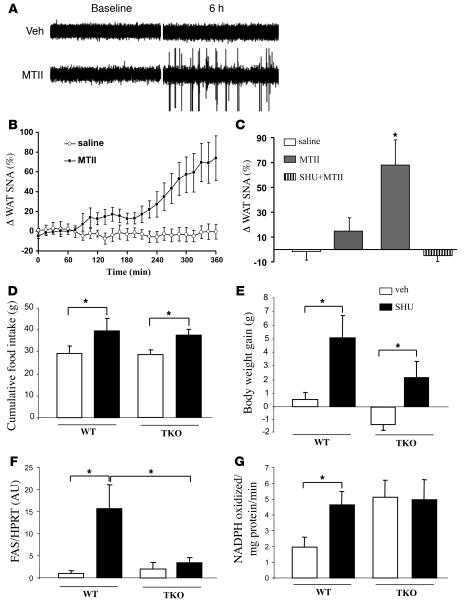
White adipocytes are directly connected with hypothalamic areas controlling energy balance via the autonomic nervous system, in particular the SNS. We therefore asked whether modulation of central melanocortin action would affect sympathetic nervous activity in WAT. i.c.v. administration of MTII increased sympathetic nerve activity (SNA) in WAT, with a 68% ± 20% increase 6 hours after a dose of 5 nmol (Figure 4A). This effect was slow in onset, requiring approximately 5 hours to reach maximum (Figure 4B). Lower doses of MTII produced more modest increases in WAT SNA (Figure 4C). Interestingly, pretreatment with SHU9119 (30 pM) completely abolished the increase in WAT SNA induced by 5 nmol of MTII (Figure 4C). In contrast, i.c.v. injection of SHU9119 alone did not alter baseline WAT SNA (–5% ± 5% 6 hours after the ICV injection), presumably due to very low basal SNA in WAT.
Figure 4. Effects of CNS-Mcr on WAT SNA in rats and in TKO mice.
Effect of i.c.v. administration of MTII on SNA to visceral WAT in anesthetized Sprague-Dawley rats. (A) Original records of WAT SNA at baseline and 6 hours after i.c.v. injection of vehicle (Veh) or MTII (5 nmol). (B) Time course of WAT SNA response to MTII (5 nM). There was a significant difference (P < 0.001 by 2-way repeated-measures ANOVA) between the effects of MTII and vehicle on WAT SNA. (C) Dose-response effect of MTII on WAT SNA and blockade of sympathoactivation to MTII in the presence of SHU9119. SNA represent the percent change from baseline (A and B). Data represent mean ± SEM of 5–6 rats per group. *P < 0.05 versus other groups. Effect of a 7-day i.c.v. SHU9119 infusion (5 nmol/day) on cumulative food intake (D) and body weight change (E) in WT and TKO. Controls were infused i.c.v. with saline. Effect of a 7-day i.c.v. SHU9119 infusion on epididymal WAT FAS mRNA expression (F) and FAS activity (G). Data are presented as values normalized to the housekeeping gene HPRT. Values are mean ± SEM of 5–7 animals per group. *P < 0.05 versus controls.
We also asked whether modulation of central melanocortin action in the absence of SNS signaling would affect WAT TAG metabolism. For this purpose, we treated WT and triple (β1-, β2-, and β3-) adrenoceptor-deficient mice (TKO) by chronic i.c.v. SHU9119 infusion using the treatment paradigm described earlier (5 nmol/d, 7 days) (44). Mcr blockade with SHU9119 increased cumulative food intake in WT mice (39.8 ± 5.2 g versus 29.2 ± 3.4 g) (Figure 4D), as well as in TKO mice (37.6 ± 2.3 g versus 28.5 ± 2.1 g). However, CNS-Mcr blockade in TKO mice did not induce the same increase of body weight than in WT mice (Figure 4E). WAT TAG synthesis pathways were markedly upregulated by CNS-Mcr blockade in WT mice, as reflected by increased mRNA levels of FAS (15.7-fold increase), as well as increased FAS activity (2.5-fold increase), while this effect was not observed in TKO mice (Figure 4, F and G), indicating an important mediating role for the SNS in the CNS control of lipid metabolism.
Physiological relevance of CNS-Mcr activity for the control of WAT TAG metabolism.
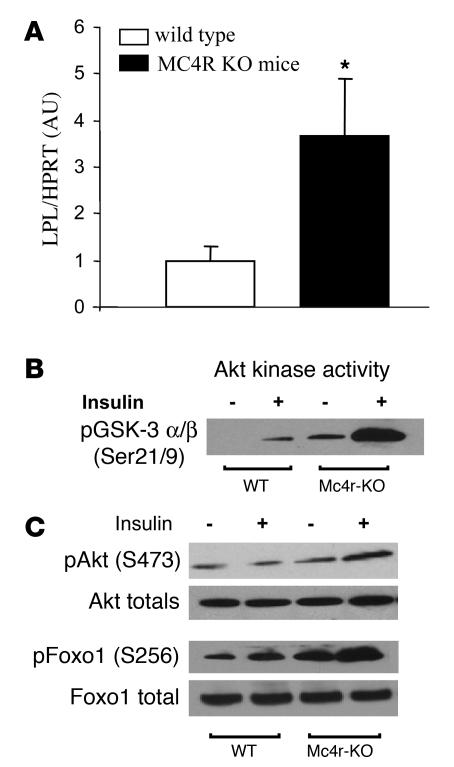
To determine whether the modulation of adipocyte metabolism via CNS-Mcr is a physiological function of endogenous Mcr, we analyzed key steps of WAT TAG metabolism in Mc4r-KO mice, which are morbidly obese and hyperphagic. In comparison to levels in lean littermate controls, LPL mRNA levels in Mc4r-KO mice were increased 3.65-fold (Figure 5A), consistent with an increased lipid uptake into WAT. However, there was no increase in FAS, ACC, or other key enzymes of WAT lipid metabolism (data not shown).
Figure 5. Lack of endogenous Mc4r affects WAT metabolism.
(A) Relative abundance of LPL mRNA in WAT of Mc4r-KO and WT mice. FAS, SCD-1, and ACC were also analyzed but did not show statistical difference (data not shown). Data are presented as values normalized to the housekeeping gene HPRT. Values are mean ± SEM of 6–8 animals per group. *P < 0.05. (B and C) Basal and insulin-stimulated PKB activity as assessed by Western blot analysis of Ser473 phosphorylation of PKB (B) and measurement of PKB kinase activity (C) was increased in WAT of Mc4r-KO mice compared with WT littermates. Phosphorylation of FoxO1 on Ser256, an important transcription factor target of PKB, was also increases in the basal and insulin-stimulated state in Mc4r-KO mice. For the experiments represented in B and C, 6-week-old pre-obese Mc4r-KO mice and WT B6 controls were fasted overnight and then administered saline or 1 U/kg insulin, and PKB and FoxO1 phosphorylation and/or activity were measured as described previously (42).
CNS-Mcr activity determines liver TAG metabolism.
While we found greatly increased TAG uptake, synthesis, and content in WAT after blocking CNS-Mcr activity, we failed to observe a respective decrease in circulating plasma TAG levels; and in spite of an increased fecal excretion in the hyperphagic SHU9119-ad lib group, the content of TAG in 1 g of feces was the same in all groups (Supplemental Figure 4).
Blockade of CNS-Mcr increased hepatic mRNA levels of FAS (5.3-fold), ACCα (SHU9119-ad lib: 7.3-fold), SCD1 (6.5-fold), and SREBP1c (3.4-fold). Blockade of CNS-Mcr also tended to increase hepatic mRNA levels of microsomal TAG transfer protein (MTP) (2.7-fold) (Supplemental Figure 2F), which is essential for hepatic lipoprotein assembly and secretion. Although the MTP increase was not significant, the tendency for an increased expression is consistent with the significantly increased liver TAG content observed after blockade of CNS-Mcr (SHU9119-ad lib 11.1 ± 1.8 TAG/mg liver; saline 7.3 ± 0.93 μg TAG/mg liver) (Supplemental Figure 2D).
Modulation of CNS-Mcr activity changes peripheral glucose uptake.
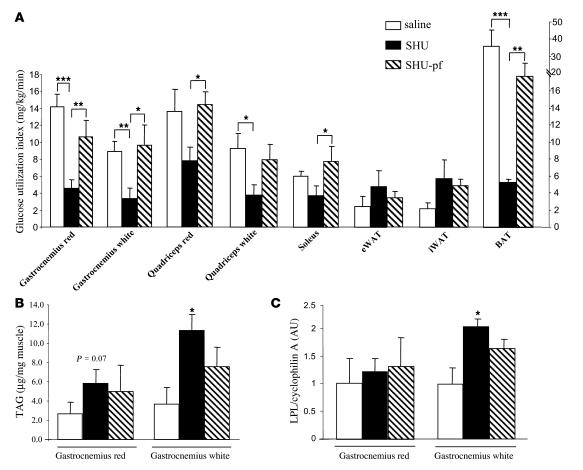
To determine whether the observed CNS-Mcr–induced shifts in peripheral lipid metabolism may be associated with altered insulin sensitivity, we used euglycemic-hyperinsulinemic clamps in association with the labeled 2-deoxyglucose technique in rats during pharmacological blockade of CNS-Mcr and first determined overall and tissue-specific insulin sensitivity. We did not detect any change in overall insulin sensitivity; i.e., in spite of the increase in fat mass in the animals with blocked CNS-Mcr, glucose infusion rate and hepatic glucose production were identical in saline- and SHU-treated animals (data not shown). However, rats with blocked CNS-Mcr and ad libitum access to food were hyperinsulinemic (Table 1). Consistent with that observation, we also found that tissue-specific insulin sensitivity of skeletal muscles, responsible for 70%–80% of glucose disposal in lean animals, decreased when CNS-Mcr was blocked (Figure 6A). Consistent with increased nutrient storage and decreased energy consumption, we also found decreased glucose utilization by BAT but increased glucose uptake in epididymal and inguinal WAT during blockade of CNS-Mcr (Figure 6A) (this difference was not statistically significant). To assess whether the decreased glucose utilization in muscles was associated with an increase in TAG content or uptake, we measured TAG content and LPL gene expression in the 2 types of muscle in which SHU9119 induced the most powerful effects. During blockade of the CNS-Mcr, TAG content was increased in red and white gastrocnemius muscle of SHU-treated rats in comparison with controls (Figure 6, B and C), whereas LPL mRNA levels were upregulated in the white gastrocnemius muscle only. These results indicate that decreased glucose uptake into muscle tissue was associated with increased TAG content in the same muscle tissue. We conclude that CNS-Mcr blockade promotes insulin resistance in muscle and BAT but not in WAT, where glucose uptake is even enhanced.
Figure 6. Effect of a 7-day i.c.v. SHU9119 infusion (24 nmol/d) in the regulation of insulin action on peripheral glucose uptake and production.
(A) Insulin-stimulated glucose utilization measured during euglycemic-hyperinsulinemic clamps in several types of muscle: gastrocnemius red, gastrocnemius white, quadriceps red, quadriceps white, soleus, epididymal WAT, inguinal WAT (iWAT), and BAT. (B) TAG content in gastrocnemius red and gastrocnemius white. (C) LPL mRNA expression in gastrocnemius red and gastrocnemius white. During euglycemic-hyperinsulinemic clamps, the rates of glucose infusion and hepatic glucose production were unchanged in SHU9119- compared with vehicle-treated rats. Glucose infusion rates (in mg/kg/min): vehicle 19.6 ± 1.1; SHU9119-ad lib 18.4 ± 1.2; SHU9119-pf 18.5 ± 0.6. Hepatic glucose production (in mg/kg/min): vehicle –0.8 ± 1.7; SHU9119-ad lib –3.3 ± 2.2; SHU9119-pf –1.9 ± 1. Values are mean ± SEM of 6–7 animals per group. *P < 0.05; **P < 0.01; ***P < 0.001.
To further assess the hypothesis that the endogenous CNS-Mcr controls nutrient partitioning via tissue-specific changes in glucose uptake and insulin sensitivity, we analyzed insulin receptor signaling in pre-obese Mc4r-KO mice. The kinase Akt is an important insulin-dependent factor in the regulation of cellular glucose uptake. Basal and insulin-stimulated Akt activity in muscle and liver was not affected by genotype (data not shown). However, a marked increase in basal and insulin-stimulated Akt activity was observed in adipose tissue of Mc4r-KO compared with WT and Mc3r-KO mice (Figure 5B and data not shown), which is in accordance with increased lipogenic activity in WAT as evidenced by increased FAS activity. Further supporting a role for endogenous Mcr in the control of nutrient partitioning in WAT, we found an increase in Ser256 phosphorylation of FoxO1 in Mc4r-KO mice (Figure 5C), FoxO1 being a transcription factor implicated in the regulation of adipogenesis, glucose uptake, and lipid metabolism (45, 46).
RQ is increased in humans with MC4R deficiency.
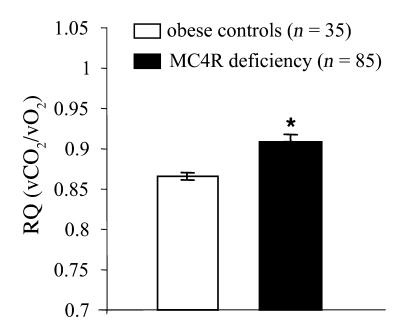
We measured basal metabolic rate and RQ by indirect calorimetry after an overnight fast in 85 subjects with MC4R deficiency and 35 age- and BMI-matched control subjects with a normal MC4R genotype. Basal metabolic rate was comparable to that predicted on the basis of age and body composition in both groups (data not shown). RQ was significantly increased in MC4R-deficient subjects compared with equally obese controls (Figure 7).
Figure 7. RQ measured by indirect calorimetry in MC4R-deficient humans (n = 85) compared with obese controls (n = 35).
Values are mean ± SEM: *P < 0.05.
Discussion
In spite of the increasing threat posed by obesity and the metabolic syndrome, sufficiently effective and safe drug treatment for the prevention or cure of these rapidly spreading disorders remains unavailable. Understanding how specific CNS circuits control fat storage and metabolism is essential in order to achieve a breakthrough in this important area of research.
Our current data demonstrate that the most potent brain circuit known to control food intake, the CNS-Mcr, also directly regulates peripheral lipid metabolism. Our central finding is that melanocortin neurons and Mcr in the CNS directly and potently affect cellular glucose utilization, lipid uptake, and TAG synthesis in the periphery. This most likely occurs through effects on autonomic outflow, thereby efficiently shifting substrate metabolism to modulate energy storage and adiposity. More specifically, we can conclude from our results that largely independent of changes in food intake, the CNS-Mcr directly and rapidly controls TAG synthesis, lipid deposition, and lipid mobilization in WAT. These findings provide a compelling explanation for how fat mass increases upon blockade of CNS-Mcr, even in the absence of hyperphagia or detectable changes in energy expenditure, and are consistent with earlier observations by Raposinho et al. (38). Our results also suggest a molecular basis for a CNS-Mcr–induced switch in nutrient partitioning and substrate utilization, which is indirectly reflected by changes in RQ (Figure 1, F–H). We also observed an increase in RQ in MC4R-deficient subjects, implicating melanocortin signaling in the regulation of substrate utilization in humans. In view of our findings in rodents, it is plausible that an impaired central control of nutrient partitioning, lipid deposition, and lipid mobilization may contribute to the obesity phenotype in human MC4R deficiency.
Pharmacologically (or genetically) decreased CNS-Mcr tone promotes WAT TAG uptake, synthesis, and deposition as well as WAT glucose uptake for energy storage. With increased CNS-Mcr tone, these processes are reversed and lipid mobilization is increased in WAT. These effects occur rapidly and are not a consequence of massive changes in food intake or adiposity. One recent study indicates that the hypothalamic melanocortin system may undergo activity changes shortly before expected meals (47), suggesting the possibility that in addition to regulating chronic energy balance control, one of the functional roles of the CNS-Mcr is to prepare glucose and lipid metabolism pathways in peripheral organs to be able to more efficiently store incoming nutrients, as discussed elsewhere (48).
We have confirmed that the CNS-Mcr system can function globally by regulating hepatic fat metabolism in addition to the control of TAG metabolism in WAT. Thus, modulation of CNS melanocortin tone also controls TAG synthesis and content in the liver, although these effects on hepatic metabolism were less independent of nutrient intake, perhaps because during blockade of CNS-Mcr, pair-fed rats may lack the necessary substrate abundance for increased metabolic TAG production, while pair-feeding is sufficient for the metabolically less “costly” WAT TAG synthesis. CNS-Mcr blockade increased hepatic levels of SCD1, and this also occurred in pair-fed rats, indicating partial independence from changes in food intake, but TAG content or changes in FAS mRNA levels did not reach significant levels in the absence of ad libitum access to dietary nutrients (Supplemental Figure 2).
Interestingly, rats with blocked CNS-Mcr displayed an increase in hepatic MTP gene expression, which appears to reflect increased hepatic lipoprotein assembly and secretion (49). In parallel, these rats had increased hepatic TAG storage along with upregulation of the respective hepatic TAG metabolism enzymes. These observations, together with the unchanged plasma levels of TAG and unchanged fecal TAG levels, suggest that blockade of CNS-Mcr stimulates synthesis of hepatic TAGs, which are rapidly transported to WAT, resulting in unchanged plasma TAG concentrations. Based on a series of elegant studies by Rossetti and colleagues, the vagus nerve appears to be the crucial communication link mediating such CNS control of hepatic metabolism (1, 50).
The SNS connects WAT cells directly with homeostatic control areas in the CNS, including Mcr-positive neurons in the hypothalamus as well as in other nonhypothalamic forebrain areas, midbrain, and brainstem areas (5, 34). We therefore tested the hypothesis that the SNS may be responsible for informing WAT cells about changes in CNS-Mcr tone by measuring SNA in the WAT after stimulation and blockade of the CNS-Mcr and using mice lacking β1,2,3-adrenergic receptors. Our results indicate that CNS-Mcr modulates SNA in WAT and that SNS signaling via functional β-adrenergic receptors is required for CNS-Mcr–induced changes in adipocyte metabolism, changes that failed to occur in TKO mice. Nevertheless, we acknowledge that complete disruption of SNS signaling in the TKO mice may create undesired tangential phenotypes. Further studies will be necessary to completely elucidate the likely participation of additional pathways in the observed CNS-WAT crosstalk. In vitro studies indicate that insulin upregulates LPL expression and activity in human WAT (51, 52) and increases LPL and FAS gene expression in brown adipocytes (53). In our experiments, insulin was increased upon blockade of CNS-Mcr. Therefore, it appeared to be possible that changes in plasma insulin levels could contribute to the CNS-WAT communication necessary for rapid and potent switching of metabolic substrate choice. However, we observed similar effects on lipogenic enzymes in chronically i.c.v. SHU9119–treated rats studied in the basal state or during hyperinsulinemia at the end of euglycemic-hyperinsulinemic clamps, suggesting that CNS-Mcr blockade does not need increased insulin to exert its effects (Supplemental Figure 3).
Although one previous report suggested that high concentrations of Mcr ligands may directly affect lipolysis in cultured adipocytes (54), we conclude that changes in the endogenous CNS-Mcr are sufficient to control TAG metabolism, since chronic subcutaneous infusion of the same doses of Mcr ligands had no effect on TAG metabolism.
Energy balance in Mcr-KO mice has been studied in detail. In addition to hyperphagia, these mice exhibit decreased locomotor activity and energy expenditure (24, 25, 37, 39, 42), factors that could indirectly contribute to, or be a consequence of, their increased adiposity. The central regulation of lipid metabolism appears to be a physiological function of the endogenous Mcr system, since TAG metabolism profiles of Mcr-KO mice are comparable to those of rats during pharmacological blockade of CNS-Mcr. For example, we detected an increase in WAT LPL mRNA levels in Mc4r-KO mice, reflecting increased lipid uptake in WAT. However, enzymes responsible for WAT lipogenesis were not significantly different from those of WT controls, likely indicating that the morbidly obese MC4r-KO mice were close to reaching their maximum WAT storage capacity and therefore prevented from further TAG synthesis. Those differences in the extent to which pharmacological and genetic manipulation of the CNS melanocortin tone affect WAT TAG metabolism might also be due to diverse counterregulatory processes in the mutated mice triggered by the massive early-onset obesity.
Specific populations of Mc4r-expressing neurons within distinct regions of the brain may differentially regulate food intake and energy expenditure (55). It remains unknown, however, which exact Mcr-expressing neurons in the CNS are responsible for the regulation of peripheral TAG and glucose metabolism. For example, the brain regions relevant for Mc4r-induced lipid mobilization activity are unclear. Sympathetic preganglionic neurons in the intermediolateral nucleus of the spinal cord, which mediate the SNS, abundantly express MC4rs and thereby represent an important candidate population (56). The possibility that MTII and SHU9119 reach the intermediolateral nucleus of the spinal cord after i.c.v. injection cannot be excluded, and therefore the effects seen in the present study may in part have resulted from changes in Mcr signaling in the intermediolateral nucleus.
Unexpectedly, overall insulin sensitivity and hepatic glucose production were not changed upon chronic blockade of CNS-Mcr. However, glucose utilization was specifically decreased in muscle and BAT, while being increased in WAT. Consistent with a WAT-specific enhancement of glucose uptake, we found enhanced basal and stimulated insulin signaling in WAT of Mc4r-KO mice. These results are also consistent with a switch in nutrient partitioning from substrate utilization toward substrate storage, which may in part be promoted by CNS-Mcr–induced tissue-specific changes in insulin sensitivity. We were unable to replicate results of earlier reports (31) indicating that chronic central infusion of SHU9119 impairs insulin sensitivity and decreases hepatic glucose production. Those differences may be explained by variations in methodologies, animal models, and ligand doses used. However, our findings on the divergent effects on glucose utilization by adipose tissue and skeletal muscle are consistent with effects following central infusion of ghrelin (44) or Npy (57, 58). In one report, Npy produced increased insulin-stimulated glucose uptake by adipose tissue and decreased glucose uptake by several muscle types. The increased fat mass of rats with blocked CNS-Mcr may result from increased TAG uptake and synthesis as well as higher glucose utilization by WAT. Energy storage commands from the brain may directly suppress muscle and BAT glucose utilization or simply create a WAT glucose sink, whereby glucose is rapidly cleared from plasma and stored as fat.
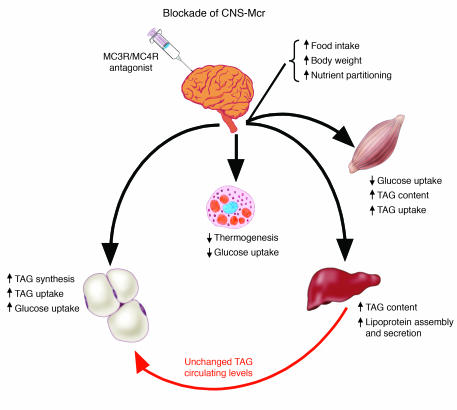
In summary, we provide a combination of pharmacological and genetic evidence to demonstrate that the CNS-Mcr system promotes fat storage via direct and rapid modulation of liver, muscle, and fat cell metabolism. Such synergistic CNS control of peripheral lipid and glucose metabolism appears to be mainly mediated by the SNS and is largely independent of parallel changes in food intake and adiposity. Specifically, when CNS melanocortin activity is reduced, a coordinated response is elicited that promotes fat deposition by: (a) increasing the synthesis of TAG in liver; (b) decreasing glucose utilization by BAT and muscle; (c) increasing insulin sensitivity as well as lipid and glucose uptake in WAT; and (d) promoting TAG synthesis in WAT (summarized in Figure 8). These simultaneous metabolic changes in multiple tissues appear to be relevant in rodents and humans and represent a synergistically regulated circuit that can potently shift substrate utilization and nutrient partitioning to ultimately alter energy storage.
Figure 8. Schematic overview summarizing the physiological effects of CNS-Mcr blockade on peripheral tissues.
Blockade of CNS-Mcr decreases thermogenesis and glucose utilization in BAT; decreases glucose utilization in muscle; increases TAG content, lipoprotein assembly, and secretion in liver; and increases TAG synthesis and uptake as well as glucose uptake and insulin sensitivity in fat tissue. Combined, these parallel metabolic changes in multiple tissues represent a synergistic shift in substrate choice and nutrient partitioning, resulting in increased energy storage.
Methods
All procedures were approved by the Institutional Animal Care and Use Committees at the University of Cincinnati, the Pennington Biomedical Research Center, the state government agencies of Brandenburg, Germany (for the German Institute of Human Nutrition), and the Vétérinaire Fédéral et Cantonal, Geneva, Switzerland, in accordance with the NIH guide for the care and use of laboratory animals.
Experiments.
All but the experiment designed to determine the effect of the melanocortin antagonist on glucose metabolism ended by euthanization of the animals by decapitation, collection of trunk blood, and sampling of various tissues, followed by storage at –80°C until further processing for the measurement of hormones, metabolites, and tissue-specific mRNA or protein expression of various enzymes.
To assess chronic central effects of melanocortin antagonists or agonists, SHU9119 or MTII, respectively, were delivered via i.c.v. infusion for 7 days. The study to determine overall and tissue-specific glucose utilization rates was performed using euglycemic-hyperinsulinemic clamps. Additional studies were designed to measure mRNA, protein expression, and enzymatic activity of enzymes involved in lipid metabolism and thermogenesis-related processes following the i.c.v. infusion of 24 nmol/d SHU9119 or 1 nmol/d MTII for 7 days (59, 60). Further chronic infusion studies of SH9119 (i.c.v., 24 nmol/d) and MTII (i.c.v., 1 nmol/d) analyzed food intake, energy expenditure, RQ, and locomotor activity of chow-fed rats using a novel, custom-made 32-cage calorimetry system (LabMaster multipurpose screening system; TSE Systems).
To determine whether the observed effects could be mediated by peripheral SHU9119 leaking from the i.c.v. infusion, we subcutaneously infused rats with saline, SHU9119 (24 nmol/d), or MTII (1 nmol/d) for a 7-day period using minipumps (model 2001D, ALZET Osmotic Pumps; DURECT) (44).
For investigating the impact of the SNS on SHU9119 effects on adipocyte metabolism, mice deficient for the adrenergic receptors β1, β2, and β3 as well as WT controls were infused i.c.v. with SHU9119 (5 nmol/d, 7 days).
Animals.
To determine the physiological relevance of endogenous Mc4r on adipocyte metabolism, analysis of mRNA expression of lipid metabolizing enzymes and insulin receptor signaling pathways affecting the balance of lipid synthesis and oxidation was carried out in adipose tissue of Mc4r-KO mice (42, 55). Mc4r-KO mice were maintained under conditions of controlled temperature (22.5°C) and illumination (12-hour light/12-hour dark cycle). For all experiments of i.c.v. and peripheral SHU9119 administration, 8- to 10-week-old, 300- to 400-g male Wistar rats purchased from Charles River Laboratories were housed in individual cages under conditions of controlled temperature (23°C) and illumination (12-hour light/12-hour dark cycle). They were allowed ad libitum access to water and standard laboratory chow (RMI, Special Diet Services; ssniff RM/H; ssniff Spezialdiäten GmbH; Harlan Teklad), unless otherwise stated. Food intake and body weight were measured daily during the experimental phase in all experiments.
Eight-week-old WT and TKO mice were generated as previously described (61). Briefly, β1+/–β2+/–β3+/– mice were crossed to generate β1+/+β2+/+β3+/+ and β1–/–β2–/–β3–/– mice. Several couples were then established from these homozygous mice at the University of Geneva, and experiments were performed on β1+/+β2+/+β3+/+ and β1–/–β2–/–β3–/– offspring.
i.c.v. infusions.
For experiments involving acute and chronic i.c.v. Mcr agonist and antagonist treatment, animals were anesthetized with intramuscular ketamine and xylazine used at 50–80 and 9–13 mg/kg, respectively (Pfizer and Bayer), and equipped with a cannula positioned in the right lateral cerebral ventricle (i.c.v.) fixed on the skull with dental cement, as previously described (44, 57). Following surgery, the animals received a single dose of 0.28 mg/kg buprenorphine (Buprenex; Reckitt Benckiser Healthcare). Chronic i.c.v. treatment during 1 week of saline, SHU9119, or MTII was performed using ALZET Brain Infusion Kit 3 (ALZET Osmotic Pumps; DURECT).
SHU9119 was infused i.c.v. at a concentration of 24 nmol and MTII at a concentration of 1 nmol per day for 2 or 7 days. To differentiate between SHU9119 effects per se from those related to increased food intake, we prevented overeating in a group of SHU9119-treated rats by pair-feeding, so that they were given the same amount of food as consumed by a control group (SHU9119-pf). The pair-feeding regimen consisted in giving one-third of the daily food amount in the morning and the remaining two-thirds just before onset of darkness. Thus, most of the experiments included 5 groups of animals: an ad libitum–fed control group infused with i.c.v. saline; 2 i.c.v. SHU9119-infused groups: SHU9119–ad lib and SHU9119-pf; an MTII-infused group; and a saline-pf group.
Energy expenditure, locomotor activity, RQ, and lipid utilization.
During the i.c.v. treatment for the period of 7 days, rats were analyzed for energy expenditure, RQ, and locomotor activity using a custom-made 32-cage calorimetry system (LabMaster; TSE Systems). The instrument consists of a combination of highly sensitive feeding and drinking sensors for automated online measurement. The calorimetry system is an open-circuit system that determines O2 consumption, CO2 production, and RQ (RQ = VCO2 / VO2, where V is volume). A photobeam-based activity monitoring system detects and records every ambulatory movement, including rearing and climbing movements in every cage. Detection of animal location is performed with infrared sensor pairs arranged in strips for horizontal and vertical (rearing) activity. The sensors for detection of movement operate efficiently in both light and dark phases, allowing continuous recording. All of the parameters can be measured continuously and simultaneously in up to 32 animals. The rats (7–8 per group) were placed in the calorimetric system cages on day 1 of treatment. After 48 hours of adaptation, data were collected over the subsequent days.
Body composition was measured in rats infused i.c.v. with SHU9119 or MTII for 7 days using NMR imaging (Whole Body Composition Analyzer; EchoMRI). Measurements were performed before surgery and prior to sacrifice following the treatment period.
Recording of WAT SNA.
Male Sprague-Dawley rats equipped with i.c.v. cannula 1 week before the study (62) were anesthetized using ketamine (91 mg/kg) and xylazine (9.1 mg/kg, i.p.), and a catheter was inserted into the jugular vein for maintenance of anesthesia with α-chloralose (50 mg/kg/h). The trachea was cannulated, and each rat was allowed to spontaneously breathe oxygen-enriched air. Rectal temperature was maintained at 37.5°C using a temperature-controlled surgical table and a lamp. Hemodynamic parameters (arterial pressure and heart rate) were monitored through a pressure transducer connected to the catheter inserted in the femoral artery using a pressure transducer connected to MacLab (model 8S; AD Instruments) data acquisition system and a Macintosh computer (data not shown).
SNA to WAT was measured by multifiber recording. Using a dissecting microscope, a nerve fascicle subserving epididymal fat pad was isolated. A bipolar platinum-iridium electrode (Cooner Wire) was suspended under the nerve and secured with silicone gel (Kwik-Cast; WPI). The nerve signal was amplified and filtered as described previously (62).
Baseline WAT SNA was recorded for 10 minutes, followed by i.c.v. injections (vehicle, SHU9119, and MTII). Vehicle and SHU9119 were administered 10 minutes before MTII. WAT SNA response to different treatments was recorded continuously for 240 minutes. At the end of the study, rats were euthanized with a lethal dose of ketamine/xylazine. The integrated voltage after death (background noise) was subtracted from the total integrated voltage to calculate real WAT SNA.
Euglycemic-hyperinsulinemic clamps.
After 7 days of i.c.v. SHU9119, MTII, or saline treatment, rats were fasted for 12 hours, anesthetized with intraperitoneal sodium pentobarbital (55 mg/kg), and subjected to a euglycemic-hyperinsulinemic clamp as previously described (44, 58). The rates of total glucose utilization (rate of glucose disappearance) and of hepatic glucose production (rate of glucose appearance) were determined via an infusion of d-[U-14C] glucose (0.407 MBq per rat; Amersham Biosciences), according to a method previously described (44, 58). At the end of these euglycemic-hyperinsulinemic clamps, a bolus of 2-deoxy- d-[1-3H] glucose (1.11 MBq per rat; Amersham Biosciences) was injected i.v. to determine the in vivo insulin-stimulated glucose utilization indices of various muscle types, WAT, and BAT (44, 58). The tissues were stored at –80°C until further analysis.
Analytical procedures related to the clamp studies.
We determined 2-deoxy- d-[1-3H] glucose– and d-[U-14C] glucose–specific activities in deproteinized blood samples as previously reported (63). Measurement of tissue concentrations of 2-deoxy- d-[1-3H] glucose–6–phosphate allowed us to calculate the in vivo glucose utilization index by individual tissues as nanograms per minute per milligram tissue (44, 63).
Tissue TAG content.
The extraction procedure for tissue TAG was adapted from methods described previously (64, 65). TAG content of each sample was measured in duplicate after evaporation of the organic solvent using an enzymatic method (Randox).
TAG synthesis in adipocytes.
To quantify the lipogenic activity of epididymal WAT enzymes after treatment with SHU9119 in rats, we performed an ex vivo [14C]acetate loading assay that measures the incorporation of radioactively labeled acetate into TAG. Briefly, rat adipocytes were isolated and purified from epididymal fat pads immediately after sacrifice, as described previously (66). Isolated cells were normalized for cell volume and seeded in 96-well plates in a 37°C, 5% CO2 incubator in the presence of 10 μM [14C]acetate. After 4 hours of incubation, the cells were disrupted by addition of Triton X-100 and lysis buffer. The lipid-soluble TAG was extracted by addition of 200 μl heptane and 14C incorporation measured by liquid scintillation counting.
Quantitative RT-PCR procedure.
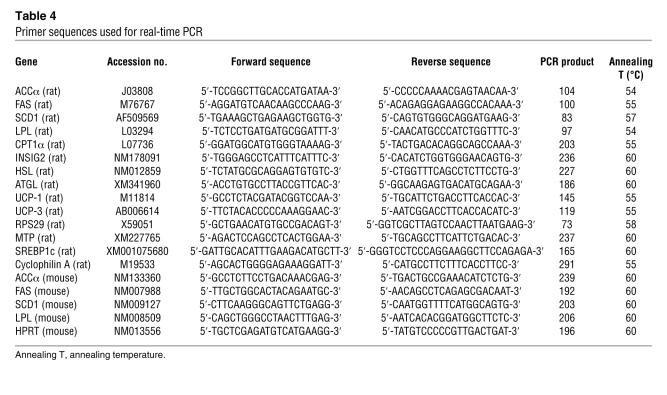
Animals were killed by decapitation in the fed state (1 hour after morning feeding), and various tissues were sampled, freeze clamped, and stored at –80°C for subsequent measurement of mRNA expression of LPL, ACCα, FAS, SCD1, CPT-1a, UCP1, UCP3, cyclophilin A, and ribosomal protein S29 (RPS29) by quantitative real-time PCR (Applied Biosystems). For primer sequences, see Table 4. Total RNA was extracted from frozen tissue samples using TRI zol Reagent (Invitrogen). RNA integrity was assessed by performing 1% agarose gel electrophoresis in 1× Tris-borate-EDTA, and its concentration was determined by spectrophotometry. cDNA templates for RT-PCR were synthesized using 2 μg of total RNA random hexamers (Microsynth), dNTPs, RNAse inhibitor, Rnasin (Catalys; Promega), and Superscript III (Invitrogen). Quantitative real-time PCR was performed using SYBR Green I DNA master mixture (Applied Biosystems) according to the standard protocol using approximately 70 ng template cDNA. All primers were used at a final concentration of 0.5 μM. A standard curve was used to obtain the relative concentration of each experimental gene; values were normalized to the concentration of cyclophilin A or RPS29 in each sample.
Table 4 .
Primer sequences used for real-time PCR
Low-density array.
Gene expression levels in rat WAT were also assessed by 2-step quantitative real-time RT-PCR using the TaqMan Low Density Arrays (Applied Biosystems). The cDNA from rat WAT was obtained as described above. The relative expression of ACCα, FAS, LPL, and CPT-1a in our tissue samples was measured in duplicate using specific sets or primers and fluorescent TAMRA probes (Acac Rn00573474 m1, Fasn Rn00569117 m1, Lpl Rn00561482 m1, and Cpt1a Rn00580702 m1, respectively; Applied Biosystems) during the log-linear phase of a PCR reaction with the 7600HT TaqMan Fast Real-Time PCR System (Applied Biosystems) using Sequence Detection Software, version 2.2. The PCR reactions took place within 2-μl wells previously loaded with the specific primers and probes by the manufacturer into each of the 384 wells of the reaction card. The reaction was performed using a final cDNA sample concentration of 0.8 ng/μl with the TaqMan Universal PCR Master Mix (Applied Biosystems) containing the AmpliTaq Gold DNA Polymerase enzymes (Applied Biosystems), the nucleotides, and the ROX fluorescent dye used as a passive load reference. The sequences of primers and probes used were designed and validated by Applied Biosystems and were taken from the Assay-on-Demand rat library. The relative expression levels of each gene were normalized by the geometric average of 2 control genes: RPS29 and 18S. These genes were statistically reported as the most stable genes measured in our experimental conditions by the statistical software geNorm (version 3.3; http://medgen.ugent.be/~jvdesomp/genorm/).
FAS activity assay.
FAS activity assay was performed as described previously (67). In short, WAT samples were homogenized in ice-cold, sucrose-based buffer (0.25 M sucrose, 1 mM DTT, 1 mM EDTA, plus protease inhibitor cocktail). The homogenate was then centrifuged at 105,000 g at 0°C for 1 hour. The infranatant was quantified for protein content. In a 96-well plate, 300 μg of protein was prepared in a volume of 100 μl homogenization buffer, added to 200 μl of NADPH/acetyl-CoA solution (33 mM K2HPO4, 67 mM KH2PO4, 200 μM NADPH, 100 μM acetyl-CoA) and incubated for 10 minutes at 37°C. To start the reaction, 30 μl of malonyl-CoA solution (33 mM K2HPO4, 67 mM KH2PO4, 600 μM malonyl-CoA) was added. Absorbance was measured at 340 nM over 20 minutes, and the gradient for A340nm was calculated. The conversion to NADPH (in M) was A340nm/(6,22 × 103) × 0.857, where 0.857 is the path length of the reaction in centimeters.
Western blot analysis.
Samples (~100 mg) of epididymal WAT tissue were homogenized as previously described (44) in ice-cold RIPA buffer (100 mM Tris HCl; 300 mM NaCl; 0.2% SDS; 1% deoxycholate; 2% NP-40; complete EDTA-free, 1 tablet/50 ml, pH 7.4) using a plastic-glass tissue grinder. Protein concentrations were determined by the bicinchoninic acid (BCA) method using a commercial kit (Pierce). Fifteen micrograms protein from each sample was fractionated by 10% SDS-PAGE and transferred onto nitrocellulose membranes. The membranes were blocked with 0.5 μg/μl polyvinyl alcohol (PVA) for 1 minute, then incubated overnight at 4°C with the mouse monoclonal anti-FAS antibody (BD Biosciences) at a dilution of 1:250 or with a rabbit polyclonal anti-calreticulin antibody at a dilution of 1:1,000 (kindly provided by R.A. Clark, University of Texas Health Science Center at San Antonio, San Antonio, Texas, USA) in TBS (50 mM Tris HCl, 150 mM NaCl, pH 7.5) buffer containing 0.1% Tween-20 and 5% BSA. Signals were revealed by incubation with HRP-conjugated goat anti-mouse (1:2,000 dilution), goat anti-rabbit (1:3,000 dilution; Bio-Rad) secondary antibodies for 1 hour at room temperature. Immunoreactive bands were visualized by enhanced chemiluminescence reaction (LiteAblot; EuroClone) and were quantified by Quantity One System (Bio-Rad). FAS protein amount was expressed relative to calreticulin expression and normalized to the average expression level of the saline-infused (control) mice.
Samples (~300 mg) of epididymal WAT were homogenized as previously described (49), and Akt phosphorylation and kinase activity, and phosphorylation of FoxO1, in the basal and insulin-stimulated state was measured in liver, skeletal muscle, and WAT of fasted 6-week-old male WT C57BL/6J, Mc3r-KO, and Mc4r-KO as described previously (42).
Fecal lipid extraction.
Lipids were extracted from 1 g of dried, powdered feces as previously described (68). The total extract was dried under nitrogen and resuspended in 1 ml methanol before being analyzed by TLC as previously described (69). Lipids were visualized by staining the plate with phosphomolybdic acid (10% in ethanol) and heating to 80°C for 5–10 minutes. Sample amounts applied to TLC plates were corrected for extraction efficiency as indicated by recovery of radiolabeled triolein and oleic acid tracers added to the powdered samples.
Levels of plasma metabolites and hormones.
Plasma glucose was measured by the glucose oxidase method (glucose analyzer 2; Beckman Coulter). Plasma FFA concentrations were determined using a kit from Wako; TAGs were determined using a kit from bioMérieux. Plasma insulin and leptin levels were measured by a previously described RIA (44).
Indirect calorimetry in MC4R-deficient humans.
Subjects with loss-of-function mutations in MC4R have been identified as part of the Genetics of Obesity Study (GOOS) cohort as reported previously (29). For this study, 85 MC4R-deficient subjects (mean BMI 42 ± 5.5 kg/m2) and 35 control subjects with a normal MC4R genotype matched for age and BMI (mean BMI 39 ± 4.8 kg/m2) were invited to the Wellcome Trust Clinical Research Facility at Addenbrooke’s Hospital for clinical studies. All studies were approved by the Cambridge local regional ethics committee and were conducted in accordance with the principles of the Declaration of Helsinki, after informed consent was received. Anthropometry and whole-body dual-energy x-ray absorptiometry (DEXA) (DPX software; Lunar Corp.) to determine body composition was performed as previously described (29). Resting metabolic rate and RQ were measured by indirect calorimetry after a 12-hour overnight fast using an open-circuit, ventilated canopy measurement system (Europa Gas Exchange Monitor; NutrEn Technology Ltd.). After adjustment for body composition, the resting metabolic rate was compared with that predicted according to age- and sex-specific equations (29).
Statistics.
Results are given as mean ± SEM. Statistical analysis was performed using 1-way ANOVA followed by the post-hoc Tukey test. A 2-tailed P value less than 0.05 was considered significant.
Supplementary Material
Acknowledgments
We are grateful to Brad Lowell, Joel Elmquist, and Nina Balthasar for providing MC4R-KO mice and valuable scientific advice. This work was supported by European Community (EC) FP6 funding (contract no. LSHMCT-2003-503041, to F. Rohner-Jeanrenaud, S. O’Rahilly, and M.H. Tschöp). I.S. Farooqi and S. O’Rahilly are funded by the Wellcome Trust and the Medical Research Council. We wish to thank Marcella Klein, Hilary Wilson, Jennifer Adelmann, Erin Grant, and Traci Kruthaupt for excellent technical assistance. We wish to thank the Genomics Platform of the National Centre of Competence in Research Frontiers in Genetics program for the invaluable help in performing the low-density array experiments. R. Nogueiras was a recipient of a fellowship from the Alexander-von-Humboldt Foundation and is currently recipient of a Marie Curie Outgoing International Fellowship. This work was supported by grant N°3100A0-105889/1 of the Swiss National Science Foundation, Bern, Switzerland (to F. Rohner-Jeanrenaud). It was also part of the Geneva Program for Metabolic Disorders.
Footnotes
Nonstandard abbreviations used: ACCα, acetyl-CoA carboxylase α; Agrp, agouti-related protein; BAT, brown adipose tissue; CNS-Mcr, central nervous melanocortin system; CPT-1a, carnitine palmitoyl transferase–1a; FAS, fatty acid synthase; INSIG2, insulin-induced gene 2; LPL, lipoprotein lipase; Mcr, melanocortin receptor(s); MTP, microsomal TAG transfer protein; Npy, neuropeptide Y; RPS29, ribosomal protein S29; RQ, respiratory quotient; SCD1, stearoyl-CoA desaturase–1; SNA, sympathetic nerve activity; SNS, sympathetic nervous system; TAG, triglyceride; TKO, triple (β1-, β2-, and β3-) adrenoceptor-deficient mice; UCP, uncoupling protein; WAT, white adipose tissue.
Conflict of interest: The authors have declared that no conflict of interest exists.
Citation for this article: J. Clin. Invest. 117:3475–3488 (2007). doi:10.1172/JCI31743
Ruben Nogueiras, Petra Wiedmer, and Diego Perez-Tilve contributed equally to this work.
References
- 1.Lam T.K., Schwartz G.J., Rossetti L. Hypothalamic sensing of fatty acids. Nat. Neurosci. 2005;8:579–584. doi: 10.1038/nn1456. [DOI] [PubMed] [Google Scholar]
- 2.Seeley R.J., Woods S.C. Monitoring of stored and available fuel by the CNS: implications for obesity. Nat. Rev. Neurosci. 2003;4:901–909. doi: 10.1038/nrn1245. [DOI] [PubMed] [Google Scholar]
- 3.Plum L., Belgardt B.F., Brüning J.C. Central insulin action in energy and glucose homeostasis. J. Clin. Invest. 2006;116:1761–1766. doi: 10.1172/JCI29063. [DOI] [PMC free article] [PubMed] [Google Scholar]
- 4.Flier J.S. Obesity wars: molecular progress confronts an expanding epidemic. Cell. 2004;116:337–350. doi: 10.1016/s0092-8674(03)01081-x. [DOI] [PubMed] [Google Scholar]
- 5.Song C.K., Jackson R.M., Harris R.B., Richard D., Bartness T.J. Melanocortin-4 receptor mRNA is expressed in sympathetic nervous system outflow neurons to white adipose tissue. Am. J. Physiol. Regul. Integr. Comp. Physiol. 2005;289:R1467–R1476. doi: 10.1152/ajpregu.00348.2005. [DOI] [PubMed] [Google Scholar]
- 6.Song C.K., Enquist L.W., Bartness T.J. New developments in tracing neural circuits with herpesviruses. Virus Res. 2005;111:235–249. doi: 10.1016/j.virusres.2005.04.012. [DOI] [PubMed] [Google Scholar]
- 7.Bartness T.J., Kay Song C., Shi H., Bowers R.R., Foster M.T. Brain-adipose tissue cross talk. Proc. Nutr. Soc. 2005;64:53–64. doi: 10.1079/pns2004409. [DOI] [PubMed] [Google Scholar]
- 8.Day D.E., Bartness T.J. Agouti-related protein increases food hoarding more than food intake in Siberian hamsters. Am. J. Physiol. Regul. Integr. Comp. Physiol. 2004;286:R38–R45. doi: 10.1152/ajpregu.00284.2003. [DOI] [PubMed] [Google Scholar]
- 9.Williams D.L., Bowers R.R., Bartness T.J., Kaplan J.M., Grill H.J. Brainstem melanocortin 3/4 receptor stimulation increases uncoupling protein gene expression in brown fat. Endocrinology. 2003;144:4692–4697. doi: 10.1210/en.2003-0440. [DOI] [PubMed] [Google Scholar]
- 10.Bartness T.J. Dual innervation of white adipose tissue: some evidence for parasympathetic nervous system involvement. J. Clin. Invest. 2002;110:1235–1237. doi: 10.1172/JCI200217047. [DOI] [PMC free article] [PubMed] [Google Scholar]
- 11.Moran T.H. Gut peptide signaling in the controls of food intake. Obesity (Silver Spring). 2006;14(Suppl. 5):250S–253S. doi: 10.1038/oby.2006.318. [DOI] [PubMed] [Google Scholar]
- 12.Aja S., Moran T.H. Recent advances in obesity: adiposity signaling and fat metabolism in energy homeostasis. Adv. Psychosom. Med. 2006;27:1–23. doi: 10.1159/000090959. [DOI] [PubMed] [Google Scholar]
- 13.Moran T.H. Gut peptides in the control of food intake: 30 years of ideas. Physiol. Behav. 2004;82:175–180. doi: 10.1016/j.physbeh.2004.04.048. [DOI] [PubMed] [Google Scholar]
- 14.Seeley R.J., Moran T.H. Principles for interpreting interactions among the multiple systems that influence food intake. Am. J. Physiol. Regul. Integr. Comp. Physiol. 2002;283:R46–R53. doi: 10.1152/ajpregu.00021.2002. [DOI] [PubMed] [Google Scholar]
- 15.Cone R.D. Anatomy and regulation of the central melanocortin system. Nat. Neurosci. 2005;8:571–578. doi: 10.1038/nn1455. [DOI] [PubMed] [Google Scholar]
- 16.Xu A.W., Barsh G.S. MC4R neurons weigh in differently. Nat. Neurosci. 2006;9:15–16. doi: 10.1038/nn0106-15. [DOI] [PubMed] [Google Scholar]
- 17.Butler A.A. The melanocortin system and energy balance. Peptides. 2006;27:281–290. doi: 10.1016/j.peptides.2005.02.029. [DOI] [PMC free article] [PubMed] [Google Scholar]
- 18.Harrold J.A., Williams G. Melanocortin-4 receptors, beta-MSH and leptin: key elements in the satiety pathway. Peptides. 2006;27:365–371. doi: 10.1016/j.peptides.2005.01.030. [DOI] [PubMed] [Google Scholar]
- 19.Fan W., Boston B.A., Kesterson R.A., Hruby V.J., Cone R.D. Role of melanocortinergic neurons in feeding and the agouti obesity syndrome. Nature. 1997;385:165–168. doi: 10.1038/385165a0. [DOI] [PubMed] [Google Scholar]
- 20.Nargund R.P., Strack A.M., Fong T.M. Melanocortin-4 receptor (MC4R) agonists for the treatment of obesity. J. Med. Chem. 2006;49:4035–4043. doi: 10.1021/jm058241a. [DOI] [PubMed] [Google Scholar]
- 21.Gropp E., et al. Agouti-related peptide-expressing neurons are mandatory for feeding. Nat. Neurosci. 2005;8:1289–1291. doi: 10.1038/nn1548. [DOI] [PubMed] [Google Scholar]
- 22.Luquet S., Perez F.A., Hnasko T.S., Palmiter R.D. NPY/AgRP neurons are essential for feeding in adult mice but can be ablated in neonates. Science. 2005;310:683–685. doi: 10.1126/science.1115524. [DOI] [PubMed] [Google Scholar]
- 23.Bewick G.A., et al. Post-embryonic ablation of AgRP neurons in mice leads to a lean, hypophagic phenotype. FASEB J. 2005;19:1680–1682. doi: 10.1096/fj.04-3434fje. [DOI] [PubMed] [Google Scholar]
- 24.Chen A.S., et al. Inactivation of the mouse melanocortin-3 receptor results in increased fat mass and reduced lean body mass. Nat. Genet. 2000;26:97–102. doi: 10.1038/79254. [DOI] [PubMed] [Google Scholar]
- 25.Huszar D., et al. Targeted disruption of the melanocortin-4 receptor results in obesity in mice. Cell. 1997;88:131–141. doi: 10.1016/s0092-8674(00)81865-6. [DOI] [PubMed] [Google Scholar]
- 26.Vaisse C., Clement K., Guy-Grand B., Froguel P. A frameshift mutation in human MC4R is associated with a dominant form of obesity. Nat. Genet. 1998;20:113–114. doi: 10.1038/2407. [DOI] [PubMed] [Google Scholar]
- 27.Yeo G.S., et al. A frameshift mutation in MC4R associated with dominantly inherited human obesity. Nat. Genet. 1998;20:111–112. doi: 10.1038/2404. [DOI] [PubMed] [Google Scholar]
- 28.Vaisse C., et al. Melanocortin-4 receptor mutations are a frequent and heterogeneous cause of morbid obesity. J. Clin. Invest. 2000;106:253–262. doi: 10.1172/JCI9238. [DOI] [PMC free article] [PubMed] [Google Scholar]
- 29.Farooqi I.S., et al. Clinical spectrum of obesity and mutations in the melanocortin 4 receptor gene. N. Engl. J. Med. 2003;348:1085–1095. doi: 10.1056/NEJMoa022050. [DOI] [PubMed] [Google Scholar]
- 30.Biebermann H., et al. A role for beta-melanocyte-stimulating hormone in human body-weight regulation. Cell. Metab. 2006;3:141–146. doi: 10.1016/j.cmet.2006.01.007. [DOI] [PubMed] [Google Scholar]
- 31.Obici S., et al. Central melanocortin receptors regulate insulin action. J. Clin. Invest. 2001;108:1079–1085. doi: 10.1172/JCI200112954. [DOI] [PMC free article] [PubMed] [Google Scholar]
- 32.Voss-Andreae A., et al. Role of the central melanocortin circuitry in adaptive thermogenesis of brown adipose tissue. Endocrinology. 2006;148:1550–1560. doi: 10.1210/en.2006-1389. [DOI] [PubMed] [Google Scholar]
- 33.Foster M.T., Bartness T.J. Sympathetic but not sensory denervation stimulates white adipocyte proliferation. Am. J. Physiol. Regul. Integr. Comp. Physiol. 2006;291:R1630–R1637. doi: 10.1152/ajpregu.00197.2006. [DOI] [PubMed] [Google Scholar]
- 34.Giordano A., et al. White adipose tissue lacks significant vagal innervation and immunohistochemical evidence of parasympathetic innervation. Am. J. Physiol. Regul. Integr. Comp. Physiol. 2006;291:R1243–R1255. doi: 10.1152/ajpregu.00679.2005. [DOI] [PubMed] [Google Scholar]
- 35.Rahmouni K., Haynes W.G., Morgan D.A., Mark A.L. Role of melanocortin-4 receptors in mediating renal sympathoactivation to leptin and insulin. J. Neurosci. 2003;23:5998–6004. doi: 10.1523/JNEUROSCI.23-14-05998.2003. [DOI] [PMC free article] [PubMed] [Google Scholar]
- 36.Frigeri L.G., Wolff G.L., Teguh C. Differential responses of yellow Avy/A and agouti A/a (BALB/c X VY) F1 hybrid mice to the same diets: glucose tolerance, weight gain, and adipocyte cellularity. Int. J. Obes. 1988;12:305–320. [PubMed] [Google Scholar]
- 37.Ste Marie L., Miura G.I., Marsh D.J., Yagaloff K., Palmiter R.D. A metabolic defect promotes obesity in mice lacking melanocortin-4 receptors. Proc. Natl. Acad. Sci. U. S. A. 2000;97:12339–12344. doi: 10.1073/pnas.220409497. [DOI] [PMC free article] [PubMed] [Google Scholar]
- 38.Raposinho P.D., White R.B., Aubert M.L. The melanocortin agonist Melanotan-II reduces the orexigenic and adipogenic effects of neuropeptide Y (NPY) but does not affect the NPY-driven suppressive effects on the gonadotropic and somatotropic axes in the male rat. J. Neuroendocrinol. 2003;15:173–181. doi: 10.1046/j.1365-2826.2003.00962.x. [DOI] [PubMed] [Google Scholar]
- 39.Butler A.A., et al. A unique metabolic syndrome causes obesity in the melanocortin-3 receptor-deficient mouse. Endocrinology. 2000;141:3518–3521. doi: 10.1210/endo.141.9.7791. [DOI] [PubMed] [Google Scholar]
- 40.Trevaskis J.L., Butler A.A. Double leptin and melanocortin-4 receptor gene mutations have an additive effect on fat mass and are associated with reduced effects of leptin on weight loss and food intake. Endocrinology. 2005;146:4257–4265. doi: 10.1210/en.2005-0492. [DOI] [PubMed] [Google Scholar]
- 41.Hwa J.J., Ghibaudi L., Gao J., Parker E.M. Central melanocortin system modulates energy intake and expenditure of obese and lean Zucker rats. Am. J. Physiol. Regul. Integr. Comp. Physiol. 2001;281:R444–R451. doi: 10.1152/ajpregu.2001.281.2.R444. [DOI] [PubMed] [Google Scholar]
- 42.Sutton G.M., et al. Diet-genotype interactions in the development of the obese, insulin-resistant phenotype of C57BL/6J mice lacking melanocortin-3 or -4 receptors. Endocrinology. 2006;147:2183–2196. doi: 10.1210/en.2005-1209. [DOI] [PMC free article] [PubMed] [Google Scholar]
- 43.Zimmermann R., et al. Fat mobilization in adipose tissue is promoted by adipose triglyceride lipase. Science. 2004;306:1383–1386. doi: 10.1126/science.1100747. [DOI] [PubMed] [Google Scholar]
- 44.Theander-Carrillo C., et al. Ghrelin action in the brain controls adipocyte metabolism. J. Clin. Invest. 2006;116:1983–1993. doi: 10.1172/JCI25811. [DOI] [PMC free article] [PubMed] [Google Scholar]
- 45.Nakae J., et al. The forkhead transcription factor Foxo1 regulates adipocyte differentiation. Dev. Cell. 2003;4:119–129. doi: 10.1016/s1534-5807(02)00401-x. [DOI] [PubMed] [Google Scholar]
- 46.Armoni M., et al. FOXO1 represses peroxisome proliferator-activated receptor-gamma1 and -gamma2 gene promoters in primary adipocytes. A novel paradigm to increase insulin sensitivity. . J. Biol. Chem. 2006;281:19881–19891. doi: 10.1074/jbc.M600320200. [DOI] [PubMed] [Google Scholar]
- 47.Johnstone L.E., Fong T.M., Leng G. Neuronal activation in the hypothalamus and brainstem during feeding in rats. Cell Metab. 2006;4:313–321. doi: 10.1016/j.cmet.2006.08.003. [DOI] [PubMed] [Google Scholar]
- 48.Tschop M.H., Castaneda T.R., Woods S.C. The brain is getting ready for dinner. Cell Metab. 2006;4:257–258. doi: 10.1016/j.cmet.2006.09.001. [DOI] [PubMed] [Google Scholar]
- 49.Tietge U.J., et al. Hepatic overexpression of microsomal triglyceride transfer protein (MTP) results in increased in vivo secretion of VLDL triglycerides and apolipoprotein B. J. Lipid. Res. 1999;40:2134–2139. [PubMed] [Google Scholar]
- 50.Lam T.K., et al. Brain glucose metabolism controls the hepatic secretion of triglyceride-rich lipoproteins. Nat. Med. 2007;13:171–180. doi: 10.1038/nm1540. [DOI] [PubMed] [Google Scholar]
- 51.Appel B., Fried S.K. Effects of insulin and dexamethasone on lipoprotein lipase in human adipose tissue. Am. J. Physiol. 1992;262:E695–E699. doi: 10.1152/ajpendo.1992.262.5.E695. [DOI] [PubMed] [Google Scholar]
- 52.McTernan P.G., et al. Insulin and rosiglitazone regulation of lipolysis and lipogenesis in human adipose tissue in vitro. Diabetes. 2002;51:1493–1498. doi: 10.2337/diabetes.51.5.1493. [DOI] [PubMed] [Google Scholar]
- 53.Teruel T., Hernandez R., Rial E., Martin-Hidalgo A., Lorenzo M. Rosiglitazone up-regulates lipoprotein lipase, hormone-sensitive lipase and uncoupling protein-1, and down-regulates insulin-induced fatty acid synthase gene expression in brown adipocytes of Wistar rats. Diabetologia. 2005;48:1180–1188. doi: 10.1007/s00125-005-1744-0. [DOI] [PubMed] [Google Scholar]
- 54.Bradley R.L., Mansfield J.P., Maratos-Flier E. Neuropeptides, including neuropeptide Y and melanocortins, mediate lipolysis in murine adipocytes. Obes. Res. 2005;13:653–661. doi: 10.1038/oby.2005.73. [DOI] [PubMed] [Google Scholar]
- 55.Balthasar N., et al. Divergence of melanocortin pathways in the control of food intake and energy expenditure. Cell. 2005;123:493–505. doi: 10.1016/j.cell.2005.08.035. [DOI] [PubMed] [Google Scholar]
- 56.Elias C.F., et al. Leptin activates hypothalamic CART neurons projecting to the spinal cord. Neuron. 1998;21:1375–1385. doi: 10.1016/s0896-6273(00)80656-x. [DOI] [PubMed] [Google Scholar]
- 57.Vettor R., Zarjevski N., Cusin I., Rohner-Jeanrenaud F., Jeanrenaud B. Induction and reversibility of an obesity syndrome by intracerebroventricular neuropeptide Y administration to normal rats. Diabetologia. 1994;37:1202–1208. doi: 10.1007/BF00399793. [DOI] [PubMed] [Google Scholar]
- 58.Zarjevski N., Cusin I., Vettor R., Rohner-Jeanrenaud F., Jeanrenaud B. Intracerebroventricular administration of neuropeptide Y to normal rats has divergent effects on glucose utilization by adipose tissue and skeletal muscle. Diabetes. 1994;43:764–769. doi: 10.2337/diab.43.6.764. [DOI] [PubMed] [Google Scholar]
- 59.Li G., Zhang Y., Wilsey J.T., Scarpace P.J. Unabated anorexic and enhanced thermogenic responses to melanotan II in diet-induced obese rats despite reduced melanocortin 3 and 4 receptor expression. J. Endocrinol. 2004;182:123–132. doi: 10.1677/joe.0.1820123. [DOI] [PubMed] [Google Scholar]
- 60.da Silva A.A., Kuo J.J., Hall J.E. Role of hypothalamic melanocortin 3/4-receptors in mediating chronic cardiovascular, renal, and metabolic actions of leptin. Hypertension. 2004;43:1312–1317. doi: 10.1161/01.HYP.0000128421.23499.b9. [DOI] [PubMed] [Google Scholar]
- 61.Jimenez M., et al. Beta(1)/beta(2)/beta(3)-adrenoceptor knockout mice are obese and cold-sensitive but have normal lipolytic responses to fasting. FEBS Lett. 2002;530:37–40. doi: 10.1016/s0014-5793(02)03387-2. [DOI] [PubMed] [Google Scholar]
- 62.Rahmouni K., et al. Hypothalamic PI3K and MAPK differentially mediate regional sympathetic activation to insulin. J. Clin. Invest. 2004;114:652–658. doi: 10.1172/JCI200421737. [DOI] [PMC free article] [PubMed] [Google Scholar]
- 63.Terrettaz J., Assimacopoulos-Jeannet F., Jeanrenaud B. Severe hepatic and peripheral insulin resistance as evidenced by euglycemic clamps in genetically obese fa/fa rats. Endocrinology. 1986;118:674–678. doi: 10.1210/endo-118-2-674. [DOI] [PubMed] [Google Scholar]
- 64.Frayn K.N., Maycock P.F. Skeletal muscle triacylglycerol in the rat: methods for sampling and measurement, and studies of biological variability. J. Lipid. Res. 1980;21:139–144. [PubMed] [Google Scholar]
- 65.Neschen S., et al. Contrasting effects of fish oil and safflower oil on hepatic peroxisomal and tissue lipid content. Am. J. Physiol. Endocrinol. Metab. 2002;282:E395–E401. doi: 10.1152/ajpendo.00414.2001. [DOI] [PMC free article] [PubMed] [Google Scholar]
- 66.Rodbell M. Metabolism of isolated fat cells. i. Effects of hormones on glucose metabolism and lipolysis. J. Biol. Chem. 1964;239:375–380. [PubMed] [Google Scholar]
- 67.Lopez M., et al. Tamoxifen-induced anorexia is associated with fatty acid synthase inhibition in the ventromedial nucleus of the hypothalamus and accumulation of malonyl-CoA. Diabetes. 2006;55:1327–1336. doi: 10.2337/db05-1356. [DOI] [PubMed] [Google Scholar]
- 68.Huggins K.W., Boileau A.C., Hui D.Y. Protection against diet-induced obesity and obesity- related insulin resistance in Group 1B PLA2-deficient mice. Am. J. Physiol. Endocrinol. Metab. 2002;283:E994–E1001. doi: 10.1152/ajpendo.00110.2002. [DOI] [PubMed] [Google Scholar]
- 69.Howles P.N., Carter C.P., Hui D.Y. Dietary free and esterified cholesterol absorption in cholesterol esterase (bile salt-stimulated lipase) gene-targeted mice. J. Biol. Chem. 1996;271:7196–7202. doi: 10.1074/jbc.271.12.7196. [DOI] [PubMed] [Google Scholar]
Associated Data
This section collects any data citations, data availability statements, or supplementary materials included in this article.


