

Abstract
MMP25 (MT6-MMP) is one of the two glycosylphosphatidylinositol-anchored matrix metalloproteinases (MMPs) that have been suggested to play a role in pericellular proteolysis. However, its role in cancer is unknown, and its biochemical properties are not well established. Here we found a marked increase in MT6-MMP expression within in situ dysplasia and invasive cancer in 61 samples of human colon cancer. Expression of MT6-MMP in HCT-116 human colon cancer cells promoted tumorigenesis in nude mice. Histologically, the MT6-MMP-expressing tumors demonstrated an infiltrative leading edge in contrast to a rounded leading edge in vector control tumors. Biochemical and biosynthesis analyses revealed that MT6-MMP displayed on the cell surface exists as a major form of 120 kDa that likely represents enzyme homodimers linked by disulfide bonds. Upon reduction, a single 57-kDa active MT6-MMP was detected. Interestingly, neither membrane-anchored nor phosphatidylinositol-specific phospholipase C-released MT6-MMPs were found to be associated with tissue inhibitor of metalloproteinases (TIMPs) and did not activate pro-gelatinases (pro-MMP-2 and pro-MMP-9) even in the presence of exogenous TIMP-2 or TIMP-1. A catalytic domain of MT6-MMP was inhibited preferentially by TIMP-1 (Ki = 0.2 nm) over TIMP-2 (Ki = 2.0 nm), because of a slower association rate. These results show that MT6-MMP may play a role in colon cancer and exhibit unique biochemical and structural properties that may regulate proteolytic function at the cell surface.
The matrix metalloproteinases (MMPs)2 are multidomain, multifunctional zinc-dependent endopeptidases, which have been associated with the pathogenesis of a variety of human diseases, including cancer (1, 2). The MMP family includes secreted and membrane-anchored proteases (3), and thus they are mediators of proteolysis in the pericellular space and at the cell surface. The membrane-type MMP (MT-MMP) subfamily includes six members, four of which are anchored to the plasma membrane via a transmembrane domain (MMP14, MMP15, MMP16, and MMP24, also referred to as MT1-, MT2-, MT3-, and MT5-MMP, respectively) and two of which are membrane-anchored via a glycosylphosphatidylinositol (GPI) moiety (MMP17 and MMP25, referred to as MT4- and MT6-MMP, respectively) (4, 5). Although there is a significant amount of information on the transmembrane MT-MMPs, little is known about the properties and functions of GPI-anchored MT-MMPs.
MT6-MMP was originally cloned from human leukocytes (6) and from a fetal liver cDNA library (7). In human normal tissues, MT6-MMP mRNA is predominantly expressed in leukocytes (polymorphonuclear cells and monocytes) but is also detected in lung and spleen (6-8). Because of its abundance in leukocytes, MT6-MMP is also known as leukolysin (6). Functional studies with a recombinant catalytic domain showed that MT6-MMP can degrade various extracellular matrix components, including type IV collagen, gelatin, fibrin, fibronectin, chondroitin sulfate proteoglycan, and dermatan sulfate proteoglycan (9), suggesting that MT6-MMP may contribute to pericellular extracellular matrix degradation. MT6-MMP was also shown to inactivate α1-proteinase inhibitor (10) and thus may play a role in inflammation (11), consistent with its high expression in leukocytes.
Several transmembrane MT-MMPs initiate a cascade of zymogen activation at the cell surface by promoting the activation of pro-MMP-2 (5). Some MT-MMPs can also partner with members of the tissue inhibitors of metalloproteinase (TIMP) family to accomplish pro-MMP-2 activation. This process, which has been demonstrated with MT1-MMP and MT3-MMP, involves the generation of a ternary complex on the cell surface, which is formed by an active MT-MMP, TIMP-2, or TIMP-3 and pro-MMP-2 (12, 13). The activation of pro-MMP-2 is then initiated by a neighboring TIMP-free MT-MMP. However, conflicting results were reported regarding the ability of MT6-MMP to accomplish pro-MMP-2 activation (9, 14, 15). Furthermore, the role of TIMP-2 was not examined. MT6-MMP is inhibited by both TIMP-2 and TIMP-1 (9), which sets it apart from other MT-MMPs, such as MT1-MMP, known to be insensitive to TIMP-1. TIMP-1 inhibition of MT6-MMP raises the question as to whether MT6-MMP can accomplish the surface activation of pro-MMP-9, which is known to bind TIMP-1, in a process analogous to the ternary complex mechanism of pro-MMP-2 activation.
Evidence indicates that several MT-MMPs are highly expressed in cancer tissues and play a role in cancer progression (5). Early studies showed high levels of MT6-MMP mRNA expression in brain, colon, and urothelial and prostate cancers (7, 16-18). However, the localization of MT6-MMP protein in cancer tissues and its role in cancer progression remain to be investigated. To gain more insight into the expression and properties of MT6-MMP, we examined the expression of MT6-MMP by immunohistochemistry in human colon cancer tissues, its role in tumorigenicity, and its properties when overexpressed in colon cancer cell lines.
EXPERIMENTAL PROCEDURES
Cell Culture
Nonmalignant monkey kidney epithelial cells BS-C-1 (CCL-26) (13), human colorectal adenocarcinoma SW480 (CCL-228), HT-29 (HTB-38), and HCT-116 (CCL-247) cells were obtained from the American Type Culture Collection (ATCC, Manassas, VA). FET human colon carcinoma cells were a generous gift from Dr. Bonnie Sloane (Wayne State University School of Medicine). The cells were maintained in Dulbecco's modified Eagle's medium supplemented with 10% fetal bovine serum (FBS; Invitrogen) and antibiotics. Human HeLa S3 cells were purchased from ATCC (CCL-2.2) and grown in suspension in MEM Spinner medium (Quality Biologicals, Inc., Gaithersburg, MD) supplemented with 5% horse serum and antibiotics.
Recombinant Proteins and Antibodies
Human recombinant pro-MMP-2, pro-MMP-9, TIMP-2, and TIMP-1 were expressed in HeLa S3 cells infected with the appropriate recombinant vaccinia viruses and purified to homogeneity, as described previously (19). Human TIMP-3 and TIMP-4 were purchased from R&D Systems (Minneapolis, MN). A recombinant catalytic domain of human MT6-MMP expressed in Escherichia coli was a generous gift from Dr. Alex Strongin (The Burnham Institute, San Diego). Human recombinant Clusterin was purchased from Axxora, LLC (San Diego). The rabbit polyclonal antibody (pAb) against the hinge region (Ab39031) of MT6-MMP was obtained from Abcam (Cambridge, MA). Rabbit pAb against the C-terminal end (RP2-MMP-25) or the prodomain (RP4-MMP-25) of human MT6-MMP were from Triple Point Biologics (Forest Grove, OR). The pAb against the hemopexin-like domain (Ab19089) of human MT6-MMP was from Chemicon (Temecula, CA). The mouse monoclonal antibody (mAb) against human MT6-MMP (mAb1142) with unknown epitope was from R&D Systems (Minneapolis, MN).
A rabbit polyclonal antiserum raised against a synthetic peptide (107RYALSGSVWKKRTLT) from the catalytic domain of human MT6-MMP was produced by Invitrogen and referred to as pAb107. The specificity of pAb107 for MT6-MMP was tested by immunoblot analysis using purified recombinant catalytic domains of all human MT-MMPs (MT1-MMP to MT5-MMP) (supplemental Fig. 1), which were purchased from Calbiochem. Two mouse mAbs against human Clusterin were purchased from Research Diagnostics, Inc. (RDI-CLUSTabm-41D, Flanders, NJ), and Axxora, LLC (ALX-804-126-C100), respectively. Rabbit pAbs to human caveolin were from BD Biosciences. The mAb against human TIMP-1 (IM32L) was from Calbiochem. The mAb101 to human TIMP-2 was described previously (20). The mAb to the catalytic domain of MT1-MMP (LEM-2/15) was a gift from Dr. A. Arroyo (Hospital de la Princesa, Madrid, Spain). The mAb IM50L against the catalytic domain of human MT3-MMP was from Calbiochem. The RP3-MMP17 pAb against the catalytic domain of human MT4-MMP was from Triple Point Biologics. The mAb MAB050 against polyhistidine was from R&D Systems. The mAb to human β-actin was from Sigma.
cDNA Constructs
The full-length human MT6-MMP cDNA (a generous gift from Dr. D. Pei, University of Minnesota) was cloned into the expression plasmid pcDNA3.1™/myc-His(−)A (Invitrogen) to generate pcDNA3.1-MT6 for stable transfection. The human MT6-MMP cDNA was also cloned into the pTF7-EMCV-1 vector for expression in the vaccinia system (21). The correct sequences of the insert and junctions in the vectors were verified by DNA sequencing of both strands. The pTF7-EMCV-1 expression vector containing human MT6-MMP cDNA under control of the T7 promoter was used to generate an MT6-MMP-expressing recombinant vaccinia virus (vTF-MT6) by homologous recombination, as described previously (21). A chimeric GPI-anchored human pro-MT1-MMP (GPI-MT1) containing the GPI-anchoring sequence of MT6-MMP (Ala539–Arg562) cloned in the pTF7-EMCV-1 expression vector was described previously (22).
Tissue Samples and Immunohistological Analyses
Representative tissues were collected from archived human colon cancer resection specimens in the Department of Pathology at the University of Chicago under an IRB-approved protocol. Paired samples of invasive colonic adenocarcinoma and adjacent uninvolved benign colon from 61 patients were used to create tissue microarrays using from paraffin-embedded tissue using an ATA-27 automated arrayer (Beecher Systems, Sun Prairie, WI). Each patient's specimen was represented by four tissue cores, two each of tumor and benign tissue. Four-micron-thick sections of the arrays were deparaffinized, and antigen retrieval was performed by microwaving slides in 7.5 mm sodium citrate buffer, pH 6.0. After a brief rinse in Tris-buffered saline (TBS), pH 8.0, endogenous peroxidase activity and nonspecific background staining were blocked by incubating for 30 min in 3% hydrogen peroxide in methanol followed by 30 min in 0.3% bovine serum albumin in TBS. Slides were rinsed for 2 min each in TBS, TBS containing 0.01% Triton X-100, and TBS followed by incubation for 1 h at room temperature with rabbit antiserum pAb107 to human MT6-MMP (1:400 dilution). Slides were then rinsed in TBS and incubated for 30 min with goat anti-rabbit IgG conjugated to a horseradish peroxidase-labeled polymer (Envision+ System, DAKO, Carpinteria, CA). This incubation was followed by additional TBS rinses, visualization with diaminobenzidine chromogen (DAKO), and counterstained with hematoxylin. Negative controls used preimmune rabbit serum in place of the primary antibody. The sections were blindly analyzed for histopathological features by two pathologists (C. R. Weber and J. R. Turner). Intensity of staining in the epithelial cells of duplicate tumor and paired benign control samples was scored semi-quantitatively from 0 to 2 (0 = negative, 1 = weak staining, and 2 = strong staining). Staining scores for each patient were calculated as the mean score of the duplicate samples.
Semiquantitative RT-PCR
Total RNA of SW480, HCT-116, FET, and HT-29 cells was extracted with RNeasy® mini kit (Qiagen, Valencia, CA). Total RNA from human polymorphonuclear (PMN) cells was kindly provided by Dr. Sosne (Wayne State University School of Medicine). RT-PCR was performed with 1 μg of each total RNA sample using SuperScript™ III reverse transcriptase (Invitrogen) and subsequently HotStar Taq® master mix kit (Qiagen) following the manufacturers' instructions. The sequences of the specific primers (IDT, Coralville, IA) for human MT6-MMP used are as follows: forward, 5′-ATG GCC TGC AGC AAC TCT AT-3′; reverse, 5′-AGG GGC CTT TGA AGA AGA AA-3′. Thirty two cycles of PCR were performed with 30 s at 94 °C, 30 s at 52 °C, and 30 s at 72 °C. The housekeeping gene GAPDH was also amplified and used as an internal control. The sequences of the human GAPDH primers (IDT) are as follows: forward, 5′-CCA CCC ATG GCA AAT TCC ATG GCA-3′; reverse, 5′-TCT AGA CGG CAG GTC AGG TCC ACC-3′. The amplified genes were resolved by 1% agarose gels and detected by ethidium bromide staining.
Generation of Stable HT-29 and HCT-116 Transfectants
HT-29 and HCT-116 colon cancer cells were grown until 60–80% confluence. The cells were then transfected with pcDNA3.1-MT6 or pcDNA3.1 without insert (referred to as EV). Twenty four hours later, the cells were grown in complete medium supplemented with geneticin (500 μg/ml, Invitrogen) for selection. Single clones were then selected from pooled populations by serial dilutions using standard protocols. In some studies, two to three independent clones from each transfectant (MT6 and EV) of HCT-116 and HT-29 cells were pooled to generate the MT6-MMP pools (referred to as MT6-HCT and MT6-HT) and the EV pools (referred to as EV-HCT and EV-HT).
Co-infection and Infection-Transfection Procedures
vTF7-3, a recombinant vaccinia virus expressing bacteriophage T7 RNA polymerase was described previously (21). BS-C-1 cells were co-infected with 1 plaque-forming unit/cell each of vTF-MT6 and vTF7-3 in infection medium (DMEM supplemented with 2.5% FBS and antibiotics) for 45 min. As a control, BS-C-1 cells in parallel wells were infected only with the vTF7-3 virus. In some experiments, BS-C-1 cells were co-infected to express MT6-MMP with pro-MMP-9 or pro-MMP-2 using the appropriate recombinant viruses (13). For infection-transfection, BSC-1 cells were infected with vTF7-3 virus followed by transfection with plasmid vector encoding for MT6-MMP, MT1-MMP, or GPI-MT1 as described previously (20). The cells were then analyzed for MT-MMP expression by immunoblot analyses or for ability to promote pro-gelatinase activation as described below.
Tumorigenicity Assays
All experimental procedures were performed on 4-week-old female NCr nude mice (Taconic Farms, Germantown, NY) according to the Animal Welfare Regulations at Wayne State University. HCT-116 transfectants (MT6 clone M2 and EV clone E2 and pooled clones MT6-HCT and EV-HCT) were harvested and resuspended in phosphate-buffered saline (PBS, Invitrogen). Each mouse was inoculated subcutaneously with 3 × 10⁶ cells in 100 μl of PBS. The volume of the tumor was measured three times a week with a caliper, using the formula V = LW2 × 0.4 (where V is volume (mm3); L is biggest diameter (mm); W is smallest diameter (mm)). Data were analyzed for statistical significance by unpaired t test with Welch correction using the GraphPad InStat® version 3.0 (GraphPad Software, San Diego). The differences were considered to be statistically significant at p < 0.05. The mice were euthanized 4–5 weeks after tumor was inoculated, and the tumors were harvested and fixed in formalin or frozen for histopathological analyses.
Histopathological Analyses of Tumor Xenografts
Formalin-fixed tumors were embedded in paraffin. Four-micron-thick sections were stained with hematoxylin and eosin, and tumor invasiveness was calculated by determining the fraction of length along the tumor/stroma interface that showed an irregular invasive, rather than smooth pushing, border. The sections were blindly analyzed for histopathological features by two pathologists (C. R. Weber and J. R. Turner). To examine the expression of MT6-MMP in the tumor xenograft, frozen tumors (50 mg each) were homogenized in 500 μl of cold lysis buffer (1% Nonidet P-40, 25 mm Tris-HCl, pH 7.5, 100 mm NaCl, 60 mm β-octyl glucoside, and EDTA-free protease inhibitors (PI) mixture mix (Roche Applied Science)) using a Tissue Tearor™ (Biospec Products, Bartlesville, OK). The lysates were centrifuged (14,000 × g) for 15 min at 4 °C, and the protein concentration was determined by the BCA procedure (Pierce). The lysates (250 μg each) were pre-absorbed with immobilized protein A beads (Pierce) and centrifuged, and the supernatants were incubated with either 4 μg/ml pAb Ab39031 to the hinge region of MT6-MMP or rabbit IgG and protein A beads. The immunoprecipitates were mixed with Laemmli SDS-sample buffer, with or without β-mercaptoethanol (β-ME), resolved by SDS-PAGE, and subjected to immunoblot analyses using anti-MT6-MMP mAb1142.
Preparation of Cell Lysates and Immunoblot Analyses
Cells were lysed with cold lysis buffer. In some experiments, the lysis buffer was supplemented with freshly added 20 mm N-ethylmaleimide (NEM) before cell solubilization. Briefly, the cells were incubated with lysis buffer for 1 h on ice and centrifuged (14,000 × g) for 15 min at 4 °C. The protein concentration in the lysates was determined by the BCA procedure (Pierce). An aliquot of each lysate was mixed with Laemmli SDS-sample buffer with or without 1% β-ME, boiled (95 °C, 5 min), and resolved by SDS-PAGE followed by immunoblot analyses using various antibodies.
Crude Plasma Membrane Fractions
Confluent MT6-HCT cells from three 150-mm culture dishes were scraped in cold PBS supplemented with 2 mm EDTA. The cells were recovered by centrifugation (1000 × g, 5 min, 4 °C). The cells were then washed in PBS and resuspended in 25 mm Tris-HCl, pH 7.4, supplemented with 50 mm NaCl, and 8.5% sucrose supplemented with PI mixture mix. The cells were homogenized by passing though 22½-gauge needle, 20 times on ice. The homogenate was centrifuged (18,000 × g, 20 min, 4 °C) to remove cell organelles. The resulting supernatant was centrifuged (200,000 × g, 1 h, 4 °C), and the pellet was resuspended in 25 mm Tris-HCl buffer, pH 7.4, containing 50 mm NaCl and protease inhibitors and stored at −80 °C until used. The protein concentration was determined by the BCA procedure.
PI-PLC Treatment
Confluent HT-29 and HCT-116 transfectants in 6-well plates were washed with cold PBS and treated with 0.3 units/well of phosphatidylinositol-specific phospholipase C (PI-PLC, Molecular Probes, Eugene, OR) in PBS for 30 min on ice. The supernatant was clarified and concentrated with Microcon® centrifugal filter devices (Millipore, Bedford, MA) in the presence of the PI mix. An aliquot of each concentrated supernatant was mixed with Laemmli SDS-sample buffer with or without β-ME, boiled, and resolved by SDS-PAGE followed by immunoblot analysis.
PMN Cell Isolation
Lysates of human PMNs were kindly provided by Dr. Gabriel Sosne (Wayne State University School of Medicine). Briefly, freshly drawn blood in 8-ml EDTA vacutainers was centrifuged at ∼700 × g for 5 min at room temperature. The leukocyte-rich plasma and upper layer were transferred to a 50-ml centrifuge tube and subjected to gradient centrifugation through a layer of Histopaque®-1077 reagent over a layer of Histopaque®-1119 reagent (Sigma) (volume ratio blood, 1077:1119 = 2:1:1) at ∼700 × g for 30 min at room temperature. PMNs enriched at the interface of Histopaque®-1077 and -1119 were carefully collected and washed with PBS at room temperature and pelleted (∼700 × g, 5 min, room temperature). The lysate of PMNs was prepared by lysing ∼107 cells in 0.5 ml of Triton X-100 lysis buffer (1% Triton X-100 in PBS supplemented with PI mix). An aliquot of the lysate was mixed with Laemmli SDS-sample buffer with or without β-ME, boiled, and resolved by SDS-PAGE followed by immunoblot analysis.
Successive Detergent Extraction of Lipid Rafts
The procedure was adapted from Solomon et al. (23). Briefly, cells grown in 100-mm tissue culture dishes were scraped in PBS containing 2 mm EDTA. The cell pellet was resuspended in buffer A (25 mm MES, pH 6.5, 150 mm NaCl) on ice. An equal volume of the same buffer containing 2% Triton X-100 and the PI mix was added. The tube contents were gently mixed and incubated on ice for 30 min. Insoluble fractions were pelleted by centrifugation (14,000 × g) for 20 min at 4 °C. The Triton-soluble protein fraction was collected and labeled as nonlipid raft fraction. The pellet was resuspended in buffer B (10 mm Tris-HCl, pH 7.5, 1% Triton X-100, 500 mm NaCl, 60 mm β-octyl glucoside, and PI mix). After 30 min of incubation on ice, the cellular debris, insoluble fraction, was removed by centrifugation (14,000 × g), and β-octyl glucoside soluble protein was marked as lipid raft fraction. An aliquot of the nonlipid raft (referred to as S fraction) and lipid raft (referred to as I fraction) fractions were mixed with Laemmli SDS-sample buffer with or without β-ME, boiled, and resolved by SDS-PAGE followed by immunoblot analysis using various anti-MT6-MMP antibodies. The blots were reprobed with antibodies to human caveolin, a lipid raft protein.
Pulse-Chase Analyses
MT6-HCT cells (80% confluent) in 6-well plates were incubated for 30 min with 1 ml/well of starving medium (DMEM without methionine and cysteine supplemented with 10 mm HEPES). The cells were then pulsed with 500 μCi/ml of [35S]methionine/cysteine in starvation medium supplemented with 1% dialyzed FBS (0.5 ml/well) for 15 min at 37 °C. After the pulse, the medium was aspirated, and the cells were washed twice with PBS before the addition of 1 ml/well chase medium (DMEM with 1% dialyzed FBS, 5 mm methionine, and 5 mm cysteine). At the end of the chase period (0–120 min at 37 °C), the medium was removed, and the cells were washed with cold PBS and lysed with cold lysis buffer as described before. The lysates were clarified by a brief centrifugation and were pre-absorbed with immobilized protein A beads (Pierce). The lysates were subjected to immunoprecipitation with either MT6-MMP antibodies or rabbit IgG (Pierce) and immobilized protein A beads. The immunoprecipitates were mixed with Laemmli SDS-sample buffer, with or without β-ME, and resolved by SDS-PAGE followed by autoradiography.
Pro-gelatinase Activation Assays
These assays were carried out with infected BS-C-1 cells and with the HT-29 and HCT-116 transfectants. Briefly, BS-C-1 cells were co-infected to express wild type MT6-MMP and MT1-MMP or infected with control virus as described above. Four hour post-infection, the cells were incubated overnight in serum-free DMEM supplemented without or with various amounts (0–50 nm) of human recombinant TIMP-2 or TIMP-1. Then the media were aspirated and the cells were gently washed with DMEM to remove unbound TIMPs. The cells were then incubated (up to 8 h at 37 °C) with serum-free DMEM supplemented with 10 nm purified pro-MMP-2 or pro-MMP-9. The media were collected, and the cells were lysed with lysis buffer. The media and lysates were analyzed for pro-gelatinase activation by gelatin zymography, as described (20). Cell lysates were also subjected to SDS-PAGE followed by immunoblot analyses (24) to detect MT6-MMP or MT1-MMP. When testing GPI-MT1, BS-C-1 cells were infected-transfected as described with the appropriate plasmid vectors and processed for pro-MMP-2 activation as described above. In some experiments, BS-C-1 cells were co-infected to co-express MT6-MMP with either pro-MMP-2 or pro-MMP-9 by using the appropriate combination of vaccinia viruses as described above. Twenty four hours later, the media and lysates were monitored for pro-gelatinase activation by gelatin zymography. Stable HT-29 and HCT-116 transfectants (pooled populations and clones) were incubated with various amounts of human recombinant TIMP-2 or TIMP-1 followed by incubation with either pro-MMP-2 or pro-MMP-9 essentially as described for the BS-C-1 cells. In another series of experiments, EV-HT clone E4 and MT6-HT clone M9 grown in T75 flasks were treated with 1.5 units/flask of PI-PLC as described before. The PI-PLC supernatants were clarified and concentrated. Various amounts of the concentrated supernatant were incubated with either 10 nm of pro-MMP-2 or 10 nm of pro-MMP-9 overnight in 50 μl of collagenase buffer (50 mm Tris-HCl, pH 7.5, 150 mm NaCl, 5 mm CaCl2, 0.02% Brij35). The reaction mixtures were subjected to gelatin zymography.
MT6-MMP Interactions with TIMPs and Clusterin
MT6-MMP and GPI-MT1-MMP were expressed in BS-C-1 cells in 6-well plates by infection-transfection as described previously (20). Six hours post-infection-transfection, the cells received 20 nm of purified recombinant TIMP-1 or TIMP-2 in serum-free DMEM followed by overnight incubation. The media were removed, and the cells were treated (30 min, on ice) with PIPLC in PBS (0.5 ml/well) as described above. The PI-PLC supernatants were collected, concentrated, and resolved by reducing 12% SDS-PAGE followed by immunoblot analyses with the appropriate antibodies to MT6-MMP, MT1-MMP, or TIMPs. In another series of studies, MT6-HCT cells and EV-HCT cells were incubated overnight in the presence of 20 nm of TIMP-1, TIMP-2, TIMP-3, or TIMP-4 in serum-free media. The cells were washed and surface-biotinylated as described (13, 25). The cells were then treated with PI-PLC in PBS as described above. The PI-PLC-released proteins were pulled down with streptavidin beads as described (13, 25), and the bound proteins were eluted with Laemmli SDS-sample buffer, boiled, and resolved by reducing 12% SDS-PAGE followed by immunoblot analyses.
In another series of experiments, surface-biotinylated MT6-HCT cells and EV-HCT cells were lysed in lysis buffer as described above, and the lysates were subjected to pulldowns with streptavidin beads. The precipitates were resolved by reducing or nonreducing SDS-PAGE followed by immunoblot analyses using either anti-human Clusterin mAb or anti-MT6-MMP mAb1142.
Enzyme Inhibition Studies
The enzymatic activity of the MT6-MMP catalytic domain (MT6-MMPcat) was monitored using the synthetic fluorescence-quenched peptide (7-methoxycoumarin-4-yl) acetyl-l-prolyl-l-leucyl-l-glycyl-leucyl(N3-(2,4-dinitophenol)-l-2,3-diaminopropionyl)-l-alanyll-arginine amide (MOCAcPLGLA2pr(Dnp)AR-NH2 from Peptides International, Louisville, KY), as described (26), on a Photon Technology International spectrofluorometer, at excitation and emission wavelengths of 328 and 393 nm, respectively. The kinetic parameters for the reaction of MT6-MMPcat with the fluorogenic substrate were determined from fitting the substrate concentration dependence of the initial rates of substrate hydrolysis to the Michaelis-Menten equation, using the program Scientist® (MicroMath, Salt Lake City, UT). The kcat and Km values were determined to be 0.088 ± 0.005 s−1 and 2.5 ± 0.6 μm, respectively, yielding a kcat/Km ratio of (3.5 ± 0.8) × 104 m−1 s−1. The concentration of MT6-MMPcat was determined by titration with the hydroxamate-based MMP inhibitor GM6001 (Chemicon). All the kinetic assays were carried out in a buffer consisting of 50 mm HEPES, pH 7.5, 150 mm NaCl, 5 mm CaCl2, 0.01% Brij35, and 1% Me2SO (1% v/v) (buffer R), at 25 °C, in a thermostatted cuvette holder. Less than 10% hydrolysis of the fluorogenic substrate was monitored (26). MT6-MMPcat inhibition by TIMPs was carried out essentially as described (27). The concentrations of TIMPs were determined by active site titration using active MMP-2 with known concentration, as described previously (28). MT6-MMPcat (3–10 nm) was added to a mixture of synthetic substrate (11 μm) and various inhibitor concentrations (up to 30 nm), in buffer R, in acrylic cuvettes with stirring, and hydrolysis of the substrate was followed for 40 min. Analysis of these progress curves yielded the association and dissociation rate constants (kon and koff) and the inhibition constant values (Ki = koff/kon), as described (27).
RESULTS
MT6-MMP Expression in Human Colon Cancer
Paired samples of human colorectal carcinoma and adjacent control tissue from each of 61 patients were immunostained with a specific antibody to MT6-MMP, pAb107 (supplemental Fig. 1). Staining of the tissues with pre-immune rabbit antiserum showed no signal (data not shown). As shown in Fig. 1, benign colonic epithelial cells were essentially negative for MT6-MMP (below horizontal arrow in Fig. 1, A and A′ and left of long arrow in B and B′). At most, weak staining was present (51 of 61 benign specimens showed weak or no staining; mean intensity 0.7 × 0.7; Fig. 1F). However, weak staining of lymphocytes and neutrophils was detected (Fig. 1A′, dashed arrows), consistent with the reported pattern of MT6-MMP tissue expression (6). Pre-invasive neoplastic epithelial lesions, i.e. in situ dysplasia (Fig. 1A and A′, area above horizontal arrow), stained weakly but slightly more strongly than nondysplastic epithelium (Fig. 1, A and A′, area below horizontal arrow). In sharp contrast to benign epithelia and pre-invasive neoplasia, nearly all invasive adenocarcinomas showed strong staining for MT6-MMP (short arrow in Fig. 1, B and B′; 53 of 61 with strong staining; mean intensity 1.7 × 0.4; Fig. 1F). In 50 of 61 matched pairs of benign and invasive tissue from individual patients, the invasive carcinoma stained more strongly than the adjacent benign tissue (Fig. 1, B-F, p < 0.0001). In 8 patients, staining intensity was similar in benign epithelium and invasive cancer. In all 61 invasive cancers studied, staining intensity was independent of tumor differentiation; both moderately (Fig. 1, C and C′) and poorly differentiated (Fig. 1, D and D′) tumors expressed MT6-MMP. There was also no association between intensity of staining and invasion of cancer cells into lymphovascular spaces (Fig. 1, E and E′). Other factors used to define tumor grade, including architectural organization, cell polarity, mitotic rate, and extent of necrosis, as well as clinical stage, were not associated with differences in MT6-MMP expression. This is likely because MT6-MMP expression coincides with acquisition of the invasive phenotype rather than with changes that occur as tumor stage advances.
FIGURE 1. Invasive human colorectal carcinomas express high levels of MT6-MMP.

Hematoxylin and eosin stains (A–E) and MT6-MMP immunostaining of adjacent sections (A′–E′) of specimens from five patients. A and A′, in situ dysplasia (area above arrows) and benign epithelium (area below arrows) are present. The immunostaining shows that the benign epithelium is negative, although faint staining can be detected in the preinvasive neoplasia (dysplasia, area above arrows). B and B′, moderately differentiated invasive colorectal carcinoma (arrowhead) is present infiltrating beneath benign epithelium (arrow). The immunostaining shows that the invasive carcinoma is strongly positive for MT6-MMP, whereas the overlying benign epithelium is negative. C and C′, moderately differentiated gland-forming invasive colorectal carcinoma. D and D′, poorly differentiated invasive colorectal carcinoma infiltrating as single cells and small nests. The invasive cells are stained positively for MT6-MMP. E and E′, lymphatic invasion in moderately differentiated invasive colorectal carcinoma. All scale bars = 100 μm. F, semi-quantitative analysis of mean MT6-MMP staining in duplicate paired samples from 61 patients (two normal, two invasive cancers from each patient). The lines connect each pair. MT6-MMP expression was increased in 50 of 61 pairs (p < 0.0001). Mean intensity for the entire study set is shown in red (control, 0.7 ± 0.08, S.E.; carcinoma, 1.7 ± 0.06 S.E.).
Expression and Characterization of MT6-MMP in the Cell Transfectants
To investigate the role of MT6-MMP in colon cancer cells, we screened several human colon cancer cell lines and found evident MT6-MMP mRNA expression in SW480 cells, in agreement with a previous study (7), and in HCT-116 cells (Fig. 2A). However, endogenous MT6-MMP protein expression was undetected by immunoblot analyses or after immunoprecipitation with anti-MT6-MMP antibodies, possibly because of low levels of expression. In contrast, MT6-MMP protein was readily detected in isolated human PMNs, as reported (6) (Fig. 2B, PMN). We transfected both HCT-116 and HT-29 colon cancer cells with human MT6-MMP cDNA or with empty vector and selected several clones. Immunoblot analyses of lysates obtained from MT6-HCT-116 clones 1–3 (referred to as M1, M2, and M3) and MT6-HT-29 clones 8–10 (referred to as M8, M9, and M10 clones) using an antibody recognizing the hinge region of MT6-MMP revealed two forms of MT6-MMP of ∼59 and ∼57 kDa under reducing conditions (Fig. 2, B and C). No MT6-MMP expression was detected in the empty vector clones of either cell lines (referred to as EV clones). A human PMN lysate, run as a control, exhibited a single form of MT6-MMP of ∼57 kDa under reducing conditions (Fig. 2B, PMN), as reported previously (29).
FIGURE 2. Expression of MT6-MMP in colon cancer cell lines and in stable transfectants.

A, RT-PCR analysis of MT6-MMP mRNA level in human colon cancer cell lines and in human PMNs. Expression of GAPDH is shown as a loading control. Arrow shows the PCR product of MT-MMP cDNA. B and C, immunoblot analyses of recombinant MT6-MMP protein expression in transfected clones of HT-29 (B) and HCT-116 (C) colon cancer cell lines. Cells were lysed with lysis buffer, and 20 μg/lane of lysate were resolved by reducing 10% SDS-PAGE followed by immunoblot analyses with anti-MT6-MMP hinge pAb Ab39031. A human PMN lysate (40 μg) was run as a control. D, immunoblot analyses of BS-C-1 cells co-infected to express MT6-MMP (lanes 2, 4, and 6) or infected with control virus (lanes 1, 3, and 5). Lysates (20 μg/lane) were resolved by reducing 10% SDS-PAGE followed by immunoblot analyses with pAb RP2-MMP25 (directed to the C terminus) (lanes 1 and 2), pAb RP4-MMP25 (directed to the prodomain) (lanes 3 and 4), and pAb107 (directed to the catalytic domain) (lanes 5 and 6). Note the lack of recognition of the 57-kDa species by the pro-domain antibody. E, PI-PLC release of MT6-MMP from HT-29 and HCT-116 stable clones. Cells were treated with (+) or without (−) PI-PLC as described under “Experimental Procedures.” The supernatant was collected, concentrated, and subjected to reducing 10% SDS-PAGE followed by immunoblot analysis with pAb Ab39031 to the hinge region of MT6-MMP. Arrow in E indicates the soluble MT-MMP released by PI-PLC.
We also expressed human MT6-MMP in BS-C-1 cells using the vaccinia expression system (13), and lysates of the co-infected cells were probed with various anti-MT6-MMP antibodies. As shown in Fig. 2D, three forms of MT6-MMP of ∼62, ∼59, and ∼57 kDa were detected with an antibody directed to the C terminus RP2-MMP25 (Fig. 2D, lane 2). An antibody directed to the prodomain (RP4-MMP25) recognized only the 62- and 59-kDa species (Fig. 2D, lane 4), indicating that the 57-kDa species is likely to be active MT6-MMP. The pAb107 directed to the catalytic domain of MT6-MMP clearly recognized the 59- and the 57-kDa forms (Fig. 2D, lane 6). A minor MT6-MMP degradation product of ∼38-kDa was infrequently detected and only observed in overexposed blots (data not shown) suggesting that MT6-MMP is relatively stable. No signal was detected in BS-C-1 cells infected with vTF7-3 virus alone (no-MT6-MMP) (Fig. 2D, lanes 1, 3, and 5) indicating the specificity of the antibodies, including pAb107.
To confirm that MT6-MMP is anchored to cell surface via a GPI-anchoring motif, the colon cancer cell lines were treated with PI-PLC, and the supernatant was examined for the presence of MT6-MMP forms by immunoblot analyses. A single form of ∼57 kDa was found in the supernatant, which was recognized by antibody Ab39031 to the hinge region (Fig. 2E) but not by antibody RP4-MMP25 to the prodomain (data not shown), indicating that the active GPI-anchored form of MT6-MMP was present on the cell surface. After characterization, the three MT6-MMP and EV clones of HCT-116 and HT-29 cells were mixed to generate pooled populations referred to as MT6-HCT, EV-HCT, MT6-HT, and EV-HT for further analyses.
MT6-MMP Promotes Tumor Growth
To examine the biological consequences of MT6-MMP expression, the HCT-116 transfectants were tested for migratory and invasive activity in vitro and tumorigenicity in nude mice. Migration and invasion assays through collagen I or Matrigel-coated filters showed no significant differences in these activities between EV- and MT6-MMP-expressing cells (data not shown). Next, the cells were subcutaneously inoculated into nude mice, and tumor growth was evaluated. To this end, we conducted two independent experiments. Experiment 1 utilized HCT-116 clones M2 and E2, and experiment 2 utilized the pooled clones MT6-HCT and EV-HCT. As shown in Fig. 3, A and B, both experiments showed that HCT-116 cells expressing MT6-MMP exhibited accelerated tumor growth when compared with EVtransfected cells. The mean tumor volume in experiment 2 (Fig. 3B) was 2258 ± 413 mm3 for MT6-HCT tumors and 896 ± 277 mm3 for EV-HCT tumors, after 35 days (p = 0.018). Tumor incidence did not differ among the various groups with 88–100% of mice developing tumors. In vitro proliferation assays showed no differences in the growth of MT6-HCT and EV-HCT cells (data not shown). Histological analyses of the tumors revealed that in EV-HCT tumors the boundary between tumor and surrounding tissue tended to be smooth and had a well delineated pushing border separating the tumor from surrounding soft tissue (Fig. 3C). In contrast, MT6-HCT cells formed tumors in which 70 ± 30% of the tumor border was irregularly infiltrative and interfaced with a markedly desmoplastic stroma (Fig. 3D). Only 40 ± 20% of the border was infiltrative in EV-HCT tumors (p = 0.05). No lung or liver metastases were present in either group, and no differences in extent of tumor necrosis or mitotic activity were present between the two groups. Thus, MT6-MMP promotes tumor growth in vivo.
FIGURE 3. MT6-MMP promotes the tumorigenicity and local invasion of human HCT-116 colon cancer cells.

A, MT6-HCT clone M2 (■) and EV-HCT clone E2 (□); or B, pooled clones MT6-HCT (■) and EV-HCT (□) were subcutaneously inoculated (3 × 10⁶ cells/mouse) into NCr female nude mice (n = 8). Tumors were measured at the indicated days, and the tumor volumes were calculated as described under “Experimental Procedures.” Points represent mean of tumor volume, and bars indicate S.E. *, p < 0.002; **, p < 0.02; ***, p < 0.05. C and D, histological sections of EV-HCT (C) and MT6-HCT (D)tumors stained by hematoxylin and eosin.Note the smooth border between tumor and surrounding stroma in EV-HCT tumors (C) versus the ragged infiltrative border with the surrounding desmoplastic stroma in MT6-HCT tumors (D). Bar = 100 μm. T, tumor; S, stroma.
Biochemical Characterization of MT6-MMP Forms
Upon careful examination of overexposed blots of cell lysates, we noticed, in addition to the 57-kDa form of MT6-MMP, an ∼120-kDa species that was occasionally but specifically detected in the MT6-MMP-expressing clones under reducing conditions. Therefore, the lysate, crude plasma membrane, and PI-PLC-released fractions of the transfectants were resolved by SDS-PAGE under non-reducing (−β-ME) and reducing (+β-ME) conditions followed by immunoblot analyses. Cell lysates were prepared in the presence of 20 mm NEM to prevent oxidation during sample preparation. As shown in Fig. 4A, both MT6-HCT and MT6-HT lysates contained the 57-kDa species of MT6-MMP under reducing conditions (Fig. 4A, lanes 4 and 2, respectively). In the absence of reducing agents, the lysates of both cell transfectants showed the ∼120-kDa form (Fig. 4A, lanes 6 and 8). The ∼120-kDa form was recognized by antibodies to the hinge and catalytic domain of MT6-MMP but was not recognized by the pro-domain antibody (data not shown). As expected, MT6-MMP forms were not detected in the control cells (EV) (Fig. 4A, lanes 1, 3, 5, and 7) demonstrating the specificity of the detection. Thus, the presence of the ∼120-kDa species of MT6-MMP is not because of potential oxidation conditions generated during sample preparation.
FIGURE 4. Cell surface MT6-MMP is displayed as an ∼120-kDa species.

A, immunoblot analyses of lysates of pooled clones of EV-HT (lanes 1 and 5), MT6-HT (lanes 2 and 6), EV-HCT (lanes 3 and 7), and MT6-HCT (lanes 4 and 8). Cells were lysed in cold lysis buffer supplemented with 20 mm NEM and mixed with Laemmli SDS-sample buffer with (+) or without (−) β-ME. The lysates (10 μg/lane) were resolved by 7.5% SDS-PAGE followed by immunoblot analysis with mAb1142. B, crude plasma membrane fraction isolated from MT6-HCT cells was treated with PI-PLC (5 units per 5 mg of total protein in 1 ml of TBS) and centrifuged, and the supernatant (lanes 3 and 6,20 μg/lane) and pellet (lanes 2 and 5, 20 μg/lane) were collected. Lanes 1 and 4 show the input plasma membrane fraction (2 μg/lane) before PI-PLC treatment. The fractions were mixed with Laemmli SDS-sample buffer with (+) or without (−) β-ME and resolved by 7.5% SDS-PAGE followed by immunoblot analysis with pAb Ab39031 to the hinge region of MT6-MMP. C, MT6-HCT cells in 6-well plates were treated with 0.5 ml of PI-PLC (0.3 units/well) in PBS for 30 min on ice. The supernatant was concentrated and mixed with Laemmli SDS-sample buffer with (+) or without (−) β-ME and resolved by 7.5% SDS-PAGE followed by immunoblot analysis with mAb1142. D and E, EV-HCT (lanes 1 and 2) and MT6-HCT tumors (lanes 3 and 4) were homogenized, and extracts were immunoprecipitated with either anti-MT6-MMP hinge pAb Ab39031 (D and E) or rabbit IgG (not shown) and resolved by 10% (reducing) or 7.5% (nonreducing) SDS-PAGE in the presence (+) or absence (−) of β-ME followed by immunoblot analysis with anti-MT6-MMP mAb1142. Asterisk in E shows a nonspecific band. F, human PMN lysate was mixed with Laemmli SDS-sample buffer with (+) or without (−) β-ME and resolved by 7.5% SDS-PAGE followed by immunoblot analysis with mAb1142. Arrowhead and arrow in A–F indicate the ∼120- and 57-kDa species of MT6-MMP, respectively.
We isolated crude plasma membrane fraction from MT6-HCT cells (Fig. 4B). The isolated plasma membrane was treated or untreated with PI-PLC and centrifuged, and the resultant supernatants and pellets were resolved by SDS-PAGE followed by immunoblot analyses using the antibody to the hinge region of MT6-MMP. Under nonreducing conditions, a major form of ∼120 kDa and a minor form of ∼180 kDa were detected in the supernatant consistent with these species being GPI-anchored (Fig. 4B, lane 6). Under reducing conditions, the PI-PLC super-natant exhibited the 57-kDa species (Fig. 4B, lane 3). A small amount of the 57-kDa species was detected in the remaining pellet, which was present as a doublet of 57–59 kDa (Fig. 4B, lane 2), possibly representing differently glycosylated forms. The lack of detection of these species in the remaining pellet under nonreducing conditions (Fig. 4B, lane 5) may be because of a higher affinity of the hinge antibody for the monomeric forms.
To examine whether the ∼120-kDa form of MT6-MMP is present on the surface of live cells, MT6-HCT cells were treated with PI-PLC, and the supernatants were examined by immunoblot analyses under reducing and nonreducing conditions. The blots shown in Fig. 4C show that PI-PLC releases an ∼120-kDa species of MT6-MMP from the surface of MT6-HCT cells (Fig. 4C, lane 2), in agreement with the findings with the plasma membranes. Interestingly, a small amount of the ∼120-kDa species was also seen under reducing conditions suggesting that a small portion of this MT6-MMP form is SDS- and reduction-resistant.
Next, we examined whether the ∼120-kDa form of MT6-MMP was also present in the mouse tumors produced by MT6-HCT cells. To this end, tumors were harvested and homogenized and analyzed for MT6-MMP expression as described under “Experimental Procedures.” Fig. 4D shows that under reducing conditions MT6-MMP is detected as a 57-kDa species (Fig. 4D, lanes 3 and 4), whereas under nonreducing conditions the ∼120-kDa form is detected (Fig. 4E, lanes 3 and 4). This indicates that the ∼120-kDa species is generated in vivo. No specific signal was detected in the tumors-produced EV-HCT cells (Fig. 4, D and E, lanes 1 and 2) or after immunoprecipitation with rabbit IgG (data not shown).
To determine whether the ∼120-kDa form of MT6-MMP is also present in human PMNs, lysates of PMNs were resolved under reducing and nonreducing conditions. These studies showed that the ∼120-kDa species of MT6-MMP is also detected in PMNs (Fig. 4F, lane 2). Taken together, these data demonstrate that MT6-MMP displayed on the cell surface exists as a major form of ∼120-kDa and a minor form of ∼180-kDa, which are SDS- and reduction-sensitive, and thus their formation involves generation of disulfide linkages.
MT6-MMP Localizes in Lipid Rafts
Resident raft proteins, including GPI-anchored proteins, can be identified by their resistance to solubilization by cold nonanionic detergents such as Triton X-100 (23). MT6-MMP-expressing cells were lysed and fractionated into Triton X-100-soluble (S) and Triton X-100-insoluble (I)/β-octyl glucoside-soluble fractions as described (23). Through this procedure, lipid raft components such as GPI-anchored proteins and members of the caveolin family partition into the I-fraction (23, 30). Both MT6-HCT and MT6-HT cells were fractionated using this procedure, and the resultant S and I fractions were resolved by SDS-PAGE under reducing and nonreducing conditions followed by immunoblot analyses. As shown in Fig. 5, the 57-kDa (reducing) and the ∼120-kDa (nonreducing) forms of MT6-MMP were exclusively detected in the I-fraction in both cell transfectants (Fig. 5, A and B, lanes 4 and 8). As expected, caveolin was found mostly in the I-fraction (Fig. 5, lower panels). Thus, MT6-MMP is targeted to the lipid raft microdomain and is present in this domain as an ∼120-kDa form.
FIGURE 5. MT6-MMP is targeted to the lipid raft fraction.
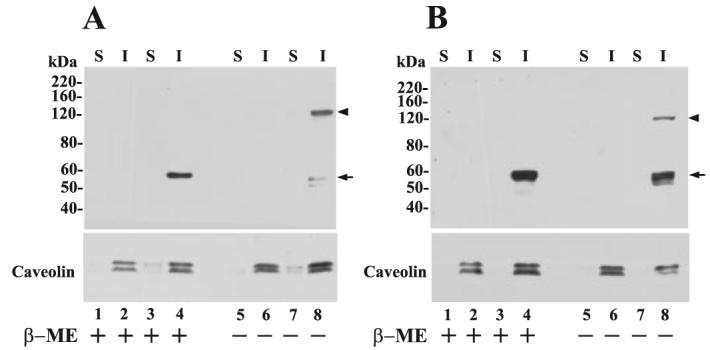
A, EV-HT (lanes 1, 2, 5, and 6) and MT6-HT cells (lanes 3, 4, 7, and 8); B, EV-HCT (lanes 1, 2, 5, and 6) and MT6-HCT cells (lanes 3, 4, 7, and 8) were harvested, and cellular proteins were separated into Triton X-100-soluble (S) and Triton X-100-insoluble/OCG-soluble (I) fractions. Equal amounts of protein (10 μg/lane) from each fraction were mixed with Laemmli SDS-sample buffer with (+) or without (−) β-ME and resolved by 7.5% SDS-PAGE followed by immunoblot analysis with mAb1142. Arrowhead and arrow in A and B indicate the ∼120- and 57-kDa species of MT6-MMP, respectively. The blots were reprobed with an anti-caveolin pAb to detect the ∼22–24-kDa caveolin (lower panels).
Biosynthesis of MT6-MMP
To examine the biosynthesis of MT6-MMP, we conducted a pulse-chase experiment as described under “Experimental Procedures” using MT6-HCT cells. After the chase period, the resulting cell lysates were immunoprecipitated with either the hinge antibody Ab39031 or pAb107 to the catalytic domain. The precipitates were subjected to SDS-PAGE analysis under nonreducing and reducing conditions followed by autoradiography. As shown in Fig. 6A, MT6-MMP was synthesized as an ∼59–60-kDa form, which was processed to an ∼57-kDa species within 30 min when examined under reducing conditions with the hinge antibody. Consistent with being the precursor/latent form of MT6-MMP, the ∼59 – 60-kDa species was not precipitated by the antibody to the catalytic domain (Fig. 6C). However, pAb107 clearly precipitated the active form at the 30-min time point (Fig. 6C), indicating that the epitope recognized by pAb107 is not exposed in the latent form of MT6-MMP when tested under native conditions (Fig. 6C), but it recognizes the latent and active forms in immunoblots (Fig. 2D).
FIGURE 6. Biosynthesis of MT6-MMP.

MT6-HCT cells were pulsed (15 min) with 500 μCi/ml [35S]methionine/cysteine and chased for 0, 15, 30, 60, and 120 min as described under “Experimental Procedures.” At each time point, the cells were harvested in cold lysis buffer, and the lysates were immunoprecipitated with either pAb Ab39031 to the hinge region (A and B) or pAb107 to the catalytic domain (C and D). The precipitated proteins were eluted by boiling in Laemmli SDS-sample buffer with (A and C) or without (B and D) β-ME and subjected to 10% (A and C) or 7.5% (B and D) SDS-PAGE followed by autoradiography. The lysate at the 30-min time point was precipitated with rabbit IgG, as a control (Ctrl.). Arrowhead and arrow in A–D indicate the ∼120-and 57-kDa species of MT6-MMP, respectively. Open arrow in A indicates the 59-kDa species of MT6-MMP.
Under nonreducing conditions (Fig. 6, B and D), the ∼120-kDa form of MT6-MMP was readily detected within 15 min into the chase period. The ∼120-kDa form was precipitated by both antibodies (Fig. 6, B and D), and under these conditions its appearance was concomitant with detection of the active 57-kDa species (Fig. 6D).
MT6-MMP Does Not Activate Pro-gelatinases
We investigated the ability of MT6-MMP to mediate the surface activation of pro-MMP-2 and pro-MMP-9 in the absence or the presence of TIMP-2 and TIMP-1 using the vaccinia expression system with BS-C-1 cells (31) and with the transfected colon cancer cell lines. Overall, all these studies showed that MT6-MMP cannot accomplish the activation of pro-MMP-2 or pro-MMP-9 regardless of the presence of TIMP-2 or TIMP-1 (supplemental Fig. 2). Pro-gelatinase activation was also not observed after co-expression of MT6-MMP and pro-gelatinases in co-infected BS-C-1 cells (data not shown). In contrast to MT6-MMP, MT1-MMP readily activated pro-MMP-2 in the presence of TIMP-2 in BS-C-1 cells infected to express MT1-MMP, as reported (20) (supplemental Fig. 2A). Also, an MT1-MMP chimera containing the MT6-MMP GPI anchor (GPI-MT1) activated pro-MMP-2 to the same extent as wild type MT1-MMP (supplemental Fig. 2F) suggesting that GPI anchoring and lipid raft insertion (22) are not limiting factors for TIMP-2-dependent pro-MMP-2 activation. Moreover, PI-PLC released MT6-MMP had no effect on pro-gelatinase activation (supplemental Fig. 2E). Together, our data indicate that, under the conditions used here, MT6-MMP is not a pro-gelatinase activator.
Interactions of MT6-MMP with TIMPs
We first measured the kinetic parameters of MT6-MMPcat and found that it exhibits significant activity toward the synthetic fluorogenic substrate MOCAcPLGLA2pr(Dnp)AR-NH2 (kcat/Km = (3.5 ± 0.8) × 104m−1 s−1), consistent with previous reports (9). MT6-MMPcat also cleaved the serine proteinase inhibitor α1-proteinase inhibitor, in agreement with Nie and Pei (10). Next, we studied the kinetics of inhibition of MT6-MMPcat by TIMP-1 and TIMP-2. As shown in Table 1, both TIMP-1 and TIMP-2 exhibit the kinetic characteristics of tight, slow-binding, reversible inhibitors of MT6-MMPcat, typical for the inhibition of MMPs by TIMPs (27, 28). However, as opposed to MT1-MMPcat and MT3-MMPcat (13), MT6-MMPcat was effectively inhibited by TIMP-1 (Ki = 0.2 ± 0.1 nm) in agreement with English et al. (9). Interestingly, the affinity of TIMP-2 (Ki = 2 ± 1 nm) for MT6-MMPcat was significantly lower (∼1 order of magnitude) than that of TIMP-1 because of a higher kon rate. Indeed, although MT6-MMPcat exhibits reasonable Ki values for both TIMP-1 and TIMP-2 (nanomolar range), the association rate of TIMP-2 is an order of magnitude lower ((1.30 ± 0.36) × 105 m−1 s−1) than that exhibited by MT1-MMPcat and MT3-MMPcat for TIMP-2 (in the order of 106 m−1 s−1).
TABLE 1. Association, dissociation and inhibition constants for MT6-MMPcat interactions with TIMP-1 and TIMP-2.
The enzymes were incubated with increasing concentrations of the inhibitors, at 25.0 °C, in buffer R. The enzymatic activity was monitored with the fluorogenic substrate MOCAcPLGLA2pr(Dnp)AR-NH2 at excitation and emission wavelengths of 328 and 393 nm, respectively. The kinetic parameters were determined as described under “Experimental Procedures.”
| Enzyme/inhibitor | kon | koff | Ki |
|---|---|---|---|
| M−1 s−1 | s−1 | nM | |
| MT6-MMPcat | |||
| TIMP-1 | (1.43 ± 0.34) × 106 | (2.8 ± 1.6) × 10−4 | 0.2 ± 0.1 |
| TIMP-2 | (1.30 ± 0.36) × 105 | (2.4 ± 1.8) × 10−4 | 2 ± 1 |
| MT1-MMPcat | |||
| TIMP-1 | NIa | ||
| TIMP-2 | (2.74 ± 0.14) × 106 | 2 × 10⁻⁴ | 0.07b |
| MT3-MMPcat | |||
| TIMP-1 | NI | ||
| TIMP-2 | (1.78 ± 0.24) × 106 | (2.95 ± 0.88) × 10−4 | 0.17 ± 0.06 |
We next examined the ability of TIMP-1 and TIMP-2 to associate with membrane-tethered and PI-PLC-released MT6-MMP in our cellular systems. To this end, we expressed MT6-MMP and GPI-MT1 in BS-C-1 cells by infection-transfection using the vaccinia system (13). The infected-transfected cells were then incubated with exogenous TIMPs followed by PI-PLC treatment as described under “Experimental Procedures.” If TIMPs are associated with the protease, the PI-PLC supernatants should contain the inhibitors and the released MT-MMP. We found that neither TIMP-2 nor TIMP-1 was detected in the PI-PLC supernatant of MT6-MMP-expressing cells (Fig. 7, A and C, lane 1). In contrast, TIMP-2 (Fig. 7A, lane 3), but not TIMP-1 (Fig. 7C, lane 3), was clearly detected in the PI-PLC supernatant of cells expressing GPI-MT1, consistent with the differential ability of MT1-MMP to bind TIMP-2 but not TIMP-1. Consistently, TIMP-2 was not found in the supernatant of cells expressing GPI-MT1 treated with PBS (Fig. 7A, lane 4). As expected, both GPI-MT1 and MT6-MMP were present in the PI-PLC supernatant fraction (Fig. 7, B, lane 3 and D, lane 1, respectively). Next, MT6-HCT and EV-HCT cells were incubated with various recombinant TIMPs (20 nm) followed by surface biotinylation. The biotinylated proteins were recovered and subjected to immunoblot analyses. As shown, in Fig. 7E, biotinylated MT6-MMP was readily detected on the surface of MT6-HCT cells but not in the control EV-HCT cells, as expected. In contrast, biotinylated TIMPs were not detected after probing the blots with anti-TIMP antibodies (data not shown). It should be mentioned that both HCT-116 and HT29 cells also express endogenous TIMP-1 and TIMP-2 (data not shown). However, the PI-PLC supernatants of MT6-HCT and MT6-HT cells showed no detectable TIMPs (data not shown). We also failed to detect MT6-MMP in complex with TIMP-1 or TIMP-2 after immunoprecipitation with antibodies to either MT6-MMP or TIMPs (data not shown). Taken together, these studies show a differential association of TIMPs in cells expressing MT6-MMP or MT1-MMP.
FIGURE 7. MT6-MMP is not detected in complex with TIMPs.

A–D, MT6-MMP and GPI-MT1-MMP were expressed in BS-C-1 cells by infection-transfection as described under “Experimental Procedures.” Six hours post-infection-transfection, the cells received 20 nm of purified recombinant TIMP-1 or TIMP-2 in serum-free DMEM followed by overnight incubation. The media were removed, and the cells were treated with (+) or without (−) PI-PLC. The supernatants were collected, concentrated, and resolved by reducing 12% SDS-PAGE followed by immunoblot analyses. The blots were probed successively with mAb101 to TIMP-2 (A), mAb LEM-2/15 to MT1-MMP (B), mAb to TIMP-1 (C), and pAb Ab39031 to the hinge of MT6-MMP (D). The asterisks in D show nonspecific bands. Recombinant TIMP-2 (A, lane 5) and TIMP-1 (C, lane 5) (10 ng each/lane) were run as a control. E, MT6-HCT and EV-HCT cells were cultured in the presence of 20 nm of TIMP-1, TIMP-2, TIMP-3, or TIMP-4 in complete media. The cells were then surface-biotinylated as described under “Experimental Procedures.” The biotinylated cells were then treated with PI-PLC, and the supernatants were collected and subjected to streptavidin beads pulldowns. The bound proteins were eluted with reducing Laemmli SDS-sample buffer and resolved by 12% SDS-PAGE followed by immunoblot analysis. The blots were probed with antibodies to MT6-MMP or to TIMPs. Only the blot probed with MT6-MMP antibody (mAb1142) is shown. The TIMP blots showed no signals. Arrows in A and C indicate the recombinant TIMP-2 (∼22 kDa) and TIMP-1 (∼30 kDa), respectively.
DISCUSSION
Following the earlier reports showing increased mRNA expression of the GPI-anchored MT6-MMP in colon cancer (7), we set to investigate the expression and localization of MT6-MMP in human colon cancer tissues and its role in tumor growth of human colon cancer cells. To achieve these goals we conducted an immunohistochemical study of MT6-MMP in samples of human colon cancer. We also overexpressed MT6-MMP in two human colon cancer cell lines, characterized the expression, synthesis, and function of the recombinant protease in the transfected cells, and examined the functional consequence of its expression in tumor growth. In agreement with the early report of Velasco et al. (7), the immunohistochemical studies show that MT6-MMP is not expressed in benign colon tissue. We did, however, find limited MT6-MMP expression in the inflammatory cells present in normal colon and in association with colon tumors. As suggested by previous detection of MT6-MMP mRNA in the human colon cancer cell line SW480 (7), our study shows that MT6-MMP protein is highly expressed in human invasive colon cancer. We assessed 61 patient specimens and found strong staining in 87%. Mildly increased MT6-MMP expression was also detected in pre-invasive neoplastic epithelium. Thus, marked increases in MT6-MMP expression are associated with progression from pre-invasive to invasive colon cancer. This suggests that MT6-MMP may be important for tumor cell invasion.
Screening of several colon cancer cell lines revealed expression of MT6-MMP mRNA, but protein was not detected. The reason for this lack of detection is unclear but may be related to very low levels of protein expression in certain established cell lines. Nevertheless, ectopic expression of MT6-MMP in HCT-116 cells caused tumors that grew more rapidly than control HCT-116 cells in nude mice. Notably, the tumors produced by cells overexpressing MT6-MMP exhibited a more infiltrative leading edge and elicited a stronger desmoplastic response than tumors produced by the control cells. Thus, both the analysis of MT6-MMP expression in human tumors and the effects of MT6-MMP expression on experimental tumor growth rate and pattern suggest that MT6-MMP contributes to local tumor invasion.
Together, with a previous study showing that the MT6-MMP homologue MT4-MMP also promoted tumorigenicity and formation of lung metastasis when overexpressed in MDA-MB-231 breast cancer cells (32), our data establish an association between GPI-anchored MMPs and malignancy in two distinct cancer types. However, the substrates and function of these MT-MMPs in cancer tissues remain to be determined. In vitro invasion assays using isolated basement membranes showed that both GPI-anchored MT-MMPs did not promote invasion of transfected COS cells (33). MT4-MMP also failed to promote in vitro invasion of transfected MDA-MB-231 cells (32), and here we found that MT6-MMP overexpressed in colon cancer cells did not exhibit enhanced migration or invasion (data not shown). Thus, although data in human cancer samples and mouse cancer models suggest a role for MT4-MMP (32) and MT6-MMP in tumor invasion, this property is not manifested in in vitro invasion assays. Because tumor cell growth and invasion are multifactorial processes, the GPI-anchored MT-MMP may influence these processes by unique mechanisms that need to be elucidated.
The present studies also revealed that MT6-MMP displayed on the cell surface exists as a major ∼120-kDa species and a minor ∼180-kDa form. Lysates of tumor xenografts and of human PMNs also exhibit the ∼120-kDa form of MT6-MMP when examined under nonreducing conditions. The ∼120-kDa form of MT6-MMP may represent enzyme homodimers or a complex of MT6-MMP with other proteins(s) such as Clusterin, a serum protein shown to bind MT6-MMP (34). However, the evidence presented here strongly suggests that these enzyme forms constitute homodimers of active MT6-MMP (57-kDa). First, the relative molecular mass, reduction sensitivity, and biosynthetic patterns are consistent with this conclusion. Second, neither recombinant nor natural ∼120-kDa MT6-MMP species cross-reacted with anti-Clusterin antibodies (supplemental Fig. 3, A and B), and Clusterin was not detected on the surface of biotinylated HCT-116 cells (supplemental Fig. 3, C and D) regardless that these cells express and secrete endogenous Clusterin (∼75 kDa under reducing conditions; data not shown). Therefore, we suggest a model in which active MT6-MMP is displayed at the cell surface in homodimeric forms held by intermolecular disulfide bonds and/or noncovalent interactions. This finding also establishes MT6-MMP together with MT1-MMP (35, 36) as two members of the MT-MMP subfamily capable of dimerization. The precise mechanism(s) and structural features involved in MT6-MMP dimerization and its implication for enzyme function and regulation are under investigation.
We found that MT6-MMP, like most GPI-anchored proteins, is sorted to the lipid raft fraction with both the monomeric and dimeric forms present in lipid rafts. In agreement with these findings, a previous proteomic study identified MT6-MMP as a major component of the lipid rafts in human neutrophils (37). The presence of MT6-MMP in lipid rafts may confer this protease with the ability to interact with and degrade specific components of the lipid raft. Thus, given its unique localization, it will be important to identify MT6-MMP substrates and interacting proteins in the lipid raft environment.
Here we have also found that MT6-MMP is not a physiological activator of pro-MMP-2 and pro-MMP-9 even in the presence of TIMP-2 or TIMP-1, respectively, in agreement with previous studies (9, 14). Previously, MT4-MMP was shown to be unable to activate pro-MMP-2 (38). Thus, the overall evidence indicates that GPI-anchored MT-MMPs did not evolve to act as pro-MMP-2 activators. In the case of pro-MMP-9, our data show that activation of this zymogen does not occur via formation of ternary complexes with MT6-MMP and TIMP-1 on the cell surface. Thus, the physiological role of the pro-MMP-9· TIMP-1 complex is different from that of pro-MMP-2 with TIMP-2, and its function remains elusive.
Our enzyme inhibition studies using a recombinant MT6-MMP catalytic domain confirmed previous observations showing that MT6-MMPcat is effectively inhibited by both TIMP-2 and TIMP-1 (9, 34). However, here we showed that TIMP-1 is a much better inhibitor of MT6-MMPcat than TIMP-2 (Ki values of 0.2 and 2 nm, respectively) and that MT6-MMPcat is less sensitive to TIMP-1 and TIMP-2 inhibition than MT1-MMPcat, mainly because of a slower association rate (an order of magnitude) in the case of TIMP-2. Our kinetic data differ from the findings of English et al. (9) who showed TIMP-2 to be more effective than TIMP-1 for inhibition of MT6-MMPcat and that TIMP-2 equally inhibits MT6-MMPcat and MT1-MMPcat. These different results may be explained by the fact that English et al. (9) provided estimated apparent Ki values, and the association and dissociation constants (kon and koff) were not determined. Nevertheless, ours and previous studies (9, 34) establish an important difference in TIMP inhibition between transmembrane and GPI-anchored MT-MMPs that permits us to fine-tune pericellular proteolysis as a function of the profile and concentration of TIMPs in the pericellular space.
Consistent with the different interactions between TIMPs and MT-MMPs, we found that neither TIMP-1 nor TIMP-2 was detected in the lysates or PI-PLC-released fractions of cells expressing MT6-MMP, whereas TIMP-2 was readily detected in the same fractions derived from cells expressing MT6-GPI-anchored MT1-MMP, under the same conditions. This difference in the detection of TIMPs between MT6- and MT1-MMP can be partly explained by the affinity constants reported here. Indeed, this difference was unrelated to GPI-mediated anchoring and lipid raft localization because a GPI-anchored MT1-MMP bound TIMP-2. It is possible that formation of MT6-MMP oligomers at the cell surface may compromise interactions of TIMPs with the active site as reported for the pro-MMP-9 dimers and TIMP-1 (39). These observations raise interesting questions about the nature and function of MT6-MMP on the cell surface and about the diversity and uniqueness of the members of the MMP family. In summary, the studies presented here provide new insights into the role of MT6-MMP in colon cancer tissues and cells and highlights some of its biological, biochemical, and structural properties.
Supplementary Material
Acknowledgments
We thank Dr. Amy Noffsinger who assisted in the development of the human tissue microarrays and Dr. Maria Tretiakova for immunohistochemical staining expertise. We are grateful to Dr. Duanqing Pei (University of Minnesota) for providing the human cDNA of MT6-MMP and to Dr. Alex Strongin (The Burnham Institute) for providing the recombinant catalytic domain of human MT6-MMP.
Footnotes
This work was supported by National Institutes of Health Grants RO1 CA-61986-11, CA-100475 (to R. F.), R01 DK61931, and R01 DK68271 (to J. R. T.) and University of Chicago Cancer Research Center Grant P30 CA14599.
The on-line version of this article (available at http://www.jbc.org) contains supplemental Figs. S1–S3.
The abbreviations used are: MMP, matrix metalloproteinase; MT-MMP, membrane type-MMP; GPI, glycosylphosphatidylinositol; TIMP, tissue inhibitor of metalloproteinase; pAb, polyclonal antibody; mAb, monoclonal antibody; DMEM, Dulbecco's modified Eagle's medium; PI-PLC, phosphatidylinositol-specific phospholipase C; PMN, polymorphonuclear; β-ME, β-mercaptoethanol; PI, protease inhibitors; MES, 2-(N-morpholino) ethanesulfonic acid; GAPDH, glyceraldehyde-3-phosphate dehydrogenase; TBS, Tris-buffered saline; FBS, fetal bovine serum; PBS, phosphate-buffered saline; NEM, N-ethylmaleimide; RT, reverse transcription; Dnp, 2,4-dinitrophenol.
REFERENCES
- 1.Nagase H, Visse R, Murphy G. Cardiovasc. Res. 2006;69:562–573. doi: 10.1016/j.cardiores.2005.12.002. [DOI] [PubMed] [Google Scholar]
- 2.Deryugina EI, Quigley JP. Cancer Metastasis Rev. 2006;25:9–34. doi: 10.1007/s10555-006-7886-9. [DOI] [PubMed] [Google Scholar]
- 3.Maskos K, Bode W. Mol. Biotechnol. 2003;25:241–266. doi: 10.1385/MB:25:3:241. [DOI] [PubMed] [Google Scholar]
- 4.Hernandez-Barrantes S, Bernardo M, Toth M, Fridman R. Semin. Cancer Biol. 2002;12:131–138. doi: 10.1006/scbi.2001.0421. [DOI] [PubMed] [Google Scholar]
- 5.Zucker S, Pei D, Cao J, Lopez-Otin C. Curr. Top. Dev. Biol. 2003;54:1–74. doi: 10.1016/s0070-2153(03)54004-2. [DOI] [PubMed] [Google Scholar]
- 6.Pei D. Cell Res. 1999;9:291–303. doi: 10.1038/sj.cr.7290028. [DOI] [PubMed] [Google Scholar]
- 7.Velasco G, Cal S, Merlos-Suarez A, Ferrando AA, Alvarez S, Nakano A, Arribas J, Lopez-Otin C. Cancer Res. 2000;60:877–882. [PubMed] [Google Scholar]
- 8.Bar-Or A, Nuttall RK, Duddy M, Alter A, Kim HJ, Ifergan I, Pennington CJ, Bourgoin P, Edwards DR, Yong VW. Brain. 2003;126:2738–2749. doi: 10.1093/brain/awg285. [DOI] [PubMed] [Google Scholar]
- 9.English WR, Velasco G, Stracke JO, Knauper V, Murphy G. FEBS Lett. 2001;491:137–142. doi: 10.1016/s0014-5793(01)02150-0. [DOI] [PubMed] [Google Scholar]
- 10.Nie J, Pei D. Exp. Cell Res. 2004;296:145–150. doi: 10.1016/j.yexcr.2004.02.008. [DOI] [PubMed] [Google Scholar]
- 11.Sosne G, Christopherson PL, Barrett RP, Fridman R. Investig. Ophthalmol. Vis. Sci. 2005;46:2388–2395. doi: 10.1167/iovs.04-1368. [DOI] [PubMed] [Google Scholar]
- 12.Strongin AY, Collier I, Bannikov G, Marmer BL, Grant GA, Goldberg GI. J. Biol. Chem. 1995;270:5331–5338. doi: 10.1074/jbc.270.10.5331. [DOI] [PubMed] [Google Scholar]
- 13.Zhao H, Bernardo MM, Osenkowski P, Sohail A, Pei D, Nagase H, Kashiwagi M, Soloway PD, DeClerck YA, Fridman R. J. Biol. Chem. 2004;279:8592–8601. doi: 10.1074/jbc.M308708200. [DOI] [PubMed] [Google Scholar]
- 14.Kojima S, Itoh Y, Matsumoto S, Masuho Y, Seiki M. FEBS Lett. 2000;480:142–146. doi: 10.1016/s0014-5793(00)01919-0. [DOI] [PubMed] [Google Scholar]
- 15.Nie J, Pei D. Cancer Res. 2003;63:6758–6762. [PubMed] [Google Scholar]
- 16.Riddick AC, Shukla CJ, Pennington CJ, Bass R, Nuttall RK, Hogan A, Sethia KK, Ellis V, Collins AT, Maitland NJ, Ball RY, Edwards DR. Br. J. Cancer. 2005;92:2171–2180. doi: 10.1038/sj.bjc.6602630. [DOI] [PMC free article] [PubMed] [Google Scholar]
- 17.Wallard MJ, Pennington CJ, Veerakumarasivam A, Burtt G, Mills IG, Warren A, Leung HY, Murphy G, Edwards DR, Neal DE, Kelly JD. Br. J. Cancer. 2006;94:569–577. doi: 10.1038/sj.bjc.6602931. [DOI] [PMC free article] [PubMed] [Google Scholar]
- 18.Nuttall RK, Pennington CJ, Taplin J, Wheal A, Yong VW, Forsyth PA, Edwards DR. Mol. Cancer Res. 2003;1:333–345. [PubMed] [Google Scholar]
- 19.Olson MW, Bernardo MM, Pietila M, Gervasi DC, Toth M, Kotra LP, Massova I, Mobashery S, Fridman R. J. Biol. Chem. 2000;275:2661–2668. doi: 10.1074/jbc.275.4.2661. [DOI] [PubMed] [Google Scholar]
- 20.Hernandez-Barrantes S, Toth M, Bernardo MM, Yurkova M, Gervasi DC, Raz Y, Sang QA, Fridman R. J. Biol. Chem. 2000;275:12080–12089. doi: 10.1074/jbc.275.16.12080. [DOI] [PubMed] [Google Scholar]
- 21.Fuerst TR, Earl PL, Moss B. Mol. Cell. Biol. 1987;7:2538–2544. doi: 10.1128/mcb.7.7.2538. [DOI] [PMC free article] [PubMed] [Google Scholar]
- 22.Toth M, Sohail A, Mobashery S, Fridman R. Biochem. Biophys. Res. Commun. 2006;350:377–384. doi: 10.1016/j.bbrc.2006.09.052. [DOI] [PubMed] [Google Scholar]
- 23.Solomon KR, Mallory MA, Finberg RW. Biochem. J. 334:325–333. doi: 10.1042/bj3340325. [DOI] [PMC free article] [PubMed] [Google Scholar]
- 24.Toth M, Hernandez-Barrantes S, Osenkowski P, Bernardo MM, Gervasi DC, Shimura Y, Meroueh O, Kotra LP, Galvez BG, Arroyo AG, Mobashery S, Fridman R. J. Biol. Chem. 2002;277:26340–26350. doi: 10.1074/jbc.M200655200. [DOI] [PubMed] [Google Scholar]
- 25.English JL, Kassiri Z, Koskivirta I, Atkinson SJ, Di Grappa M, Soloway PD, Nagase H, Vuorio E, Murphy G, Khokha R. J. Biol. Chem. 2006;281:10337–10346. doi: 10.1074/jbc.M512009200. [DOI] [PubMed] [Google Scholar]
- 26.Knight CG. Methods Enzymol. 1995;248:18–34. doi: 10.1016/0076-6879(95)48004-8. [DOI] [PubMed] [Google Scholar]
- 27.Bernardo MM, Brown S, Li ZH, Fridman R, Mobashery S. J. Biol. Chem. 2002;277:11201–11207. doi: 10.1074/jbc.M111021200. [DOI] [PubMed] [Google Scholar]
- 28.Olson MW, Gervasi DC, Mobashery S, Fridman R. J. Biol. Chem. 1997;272:29975–29983. doi: 10.1074/jbc.272.47.29975. [DOI] [PubMed] [Google Scholar]
- 29.Kang T, Yi J, Guo A, Wang X, Overall CM, Jiang W, Elde R, Borregaard N, Pei D. J. Biol. Chem. 2001;276:21960–21968. doi: 10.1074/jbc.M007997200. [DOI] [PubMed] [Google Scholar]
- 30.Zhuang L, Lin J, Lu ML, Solomon KR, Freeman MR. Cancer Res. 2002;62:2227–2231. [PubMed] [Google Scholar]
- 31.Fridman R, Fuerst TR, Bird RE, Hoyhtya M, Oelkuct M, Kraus S, Komarek D, Liotta LA, Berman ML, Stetler-Stevenson WG. J. Biol. Chem. 1992;267:15398–15405. [PubMed] [Google Scholar]
- 32.Chabottaux V, Sounni NE, Pennington CJ, English WR, van den Brule F, Blacher S, Gilles C, Munaut C, Maquoi E, Lopez-Otin C, Murphy G, Edwards DR, Foidart JM, Noel A. Cancer Res. 2006;66:5165–5172. doi: 10.1158/0008-5472.CAN-05-3012. [DOI] [PubMed] [Google Scholar]
- 33.Hotary K, Li XY, Allen E, Stevens SL, Weiss SJ. Genes Dev. 2006;20:2673–2686. doi: 10.1101/gad.1451806. [DOI] [PMC free article] [PubMed] [Google Scholar]
- 34.Matsuda A, Itoh Y, Koshikawa N, Akizawa T, Yana I, Seiki M. J. Biol. Chem. 2003;278:36350–36357. doi: 10.1074/jbc.M301509200. [DOI] [PubMed] [Google Scholar]
- 35.Itoh Y, Takamura A, Ito N, Maru Y, Sato H, Suenaga N, Aoki T, Seiki M. EMBO J. 2001;20:4782–4793. doi: 10.1093/emboj/20.17.4782. [DOI] [PMC free article] [PubMed] [Google Scholar]
- 36.Rozanov DV, Deryugina EI, Ratnikov BI, Monosov EZ, Marchenko GN, Quigley JP, Strongin AY. J. Biol. Chem. 2001;276:25705–25714. doi: 10.1074/jbc.M007921200. [DOI] [PubMed] [Google Scholar]
- 37.Nebl T, Pestonjamasp KN, Leszyk JD, Crowley JL, Oh SW, Luna EJ. J. Biol. Chem. 2002;277:43399–43409. doi: 10.1074/jbc.M205386200. [DOI] [PubMed] [Google Scholar]
- 38.English WR, Puente XS, Freije JM, Knauper V, Amour A, Merry-weather A, Lopez-Otin C, Murphy G. J. Biol. Chem. 2000;275:14046–14055. doi: 10.1074/jbc.275.19.14046. [DOI] [PubMed] [Google Scholar]
- 39.Strongin AY, Collier IE, Krasnov PA, Genrich LT, Marmer BL, Goldberg GI. Kidney Int. 1993;43:158–162. doi: 10.1038/ki.1993.26. [DOI] [PubMed] [Google Scholar]
Associated Data
This section collects any data citations, data availability statements, or supplementary materials included in this article.