

Abstract
The origin and patterns of dispersal of anatomically modern humans are the focus of considerable debate1-3. Global genetic analyses have argued for one single origin, placed somewhere in Africa4-7. This scenario implies a rapid expansion, with a series of bottlenecks of small amplitude, which would have led to the observed smooth loss of genetic diversity with increasing distance from Africa. Analyses of cranial data, on the other hand, have given mixed results8-12, and have been argued to support multiple origins of modern humans2, 9, 12. Using a large dataset of skull measurements and an analytical framework equivalent to the one used for genetic data, we show that the loss in genetic diversity has been mirrored by a loss in phenotypic variability. We find evidence for an African origin, placed somewhere in the central/southern part of the continent, which harbours the highest intra-population diversity in phenotypic traits. We failed to find evidence for a second origin and confirm these results on a large genetic dataset. Distance from Africa accounts for an average 19% - 25% of heritable variation in craniometric traits, a remarkably strong effect for phenotypic traits known to be under selection.
The origin of anatomically modern humans has been the focus of much heated debate1, 3. Recent large scale genetic analyses4-7 seem to support the idea that all modern humans originated from a single location (single origin hypothesis, SO). More specifically, all studies point to Africa as the putative cradle of modern humans. If rapid, the expansion out of Africa would imply progressive loss of genetic diversity through a series of founder events (bottlenecks), a prediction that has recently received empirical support4-6. Heterozygosity declines monotonically with distance from east Africa, with South American populations carrying 64% of the neutral variability (as measured from microsatellites) found in African populations. This view is further supported by some archaeological and anthropological evidence1. However, studies of craniometric data have yielded mixed results8-12, and the presence of archaic human-like traits in skulls that would be otherwise classified as H. sapiens in several continents has been interpreted as evidence for multiple origins (multiregional hypothesis, MR)2, 12.
An important step towards an univocal answer regarding the number of origins of modern humans would be to analyse the phenotypic (cranial) traits using the same approach used for genetic traits. The alternative models (SO and MR) make clear predictions about how craniometric diversity should be distributed. Under SO, we expect to find a monotonic decrease in phenotypic variability analogous to that seen for genetic traits (unless the sampling process is so strong as to destabilise canalisation through the loss of genetic diversity)13, 14. In contrast, multiple origins should lead to several clines, the magnitude of each cline being determined by the relative contribution of its origin.
To test these predictions, we used an exceptional dataset of 4666 male skulls measured for 37 morphometric traits (Table S1) and drawn from 105 populations (Fig.1; Table S2)15, 16. A minimum sample size of 15 individuals was enforced (median size: 36) and skulls older than 2,000 years were excluded to avoid any bias in the quality of the material. It is well known that some skull traits correlate with climate, implying natural selection17, 18. Consequently, before considering the effect of ancient demography, we investigated the effect of three key climatic variables on the within-population cranial variability: maximum and minimum temperature, and average annual precipitation. For each population, we estimated the mean standardised phenotypic variance19 and fitted it in a linear model with climate variables (maximum temperature, minimum temperature and precipitation, with all possible interactions) as predictors (see Methods). Backwards stepwise elimination selected the interaction between maximum temperature and precipitation (ΔBIC=-2.2) as the best predictors of cranial variability. The minimal model including this interaction was used as the starting point for the investigation of any effect of ancient demography, effectively assuming that climate was the most parsimonious explanation for any global pattern, and that ancient demography had to explain variance that had not already been accounted for by climate. This is arguably a very conservative approach, given that Relethford 18 found a strong pattern of isolation by distance in craniometric inter-population differences and argued that selection through climate is insufficient to erase ancient demographic signals.
Fig. 1.

Map of locations of populations from which male (blue) and female (red) skulls were collected. Locations from which skulls of both sexes were collected are marked in purple.
We next searched the globe for the putative origin giving the strongest relationship between within-population phenotypic variability (corrected for climate) and distance on land5, 20 (see Methods). This strongest cline originates in central / southern Africa and could be either a single origin or the main origin in an MR scenario (Fig. 2a & Fig. 3; effect of distance from the centroid of the likely origins after correcting for climate: ΔBIC=-12.5; distance R2=14.0). A similar analysis on the 789 autosomal neutral microsatellites from the 54 populations of the HGDP-CEPH panel21, 22, using heterozygosity as a measure of genetic variability, gives almost identical results (Fig. 2b; showing patterns similar to those obtained by Ramachandran et al6 and Ray et al7, who used previous versions of the HGDP-CEPH dataset and somewhat different analytical approaches). The only noticeable difference between the estimates based on phenotypic and genetic traits is that the latter does not include south Africa amongst the most likely origins.
Fig. 2.

Maps showing the likely location of a single origin for (a) phenotypic and (b) genetic data. Lighters colours represent better fits of models of variability as predicted by distance from a location. The area containing the most likely origins are marked by a dashed blue line. Areas of the world not investigated as possible origins (such is Iceland and Madagascar, which would require substantial land bridges to the main continents) are shown in grey.
Fig. 3.
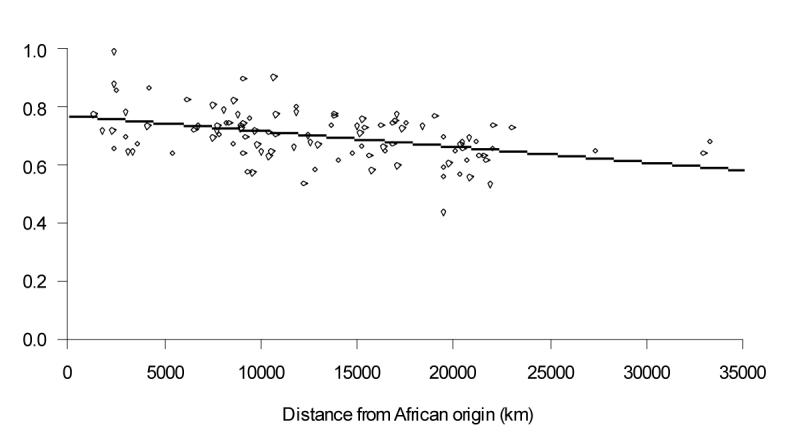
Relationship between mean phenotypic variability (corrected for climate) for male skulls and distance from the putative African origin (represented by the centroid of likely origins)
To test the MR hypothesis, we sought a second, non-African origin capable of increasing the explanatory power of the model (see Methods). Adding distances from other non-African origins did not improve our models (neither for phenotypic nor for genetic traits), supporting Ray et al7, who used a spatially explicit stochastic population model and also failed to find evidence for the multiregional hypothesis. Our approach therefore suggests a multiple origin is unlikely. However, we cannot distinguish between single vs multiple exoduses from Africa, because both scenarios would lead to a major cline from Africa. Depending on the exact timing and extent of the multiple exoduses, we could expect several subtly different patterns, and neither the genetic nor phenotypic datasets are currently large enough to investigate this level of detail. Also, very localised episodes of admixture between anatomically modern and archaic humans might go undetected if they left no signature in present day modern humans2.
How strong are the patterns for individual cranial traits? Since we could not identify a precise location for the African origin of humans, we chose a centroid of the likely craniometric origins, and the possible influence of outliers was minimised by using robust regression23 (see Methods). We considered both a model with distance as the only predictor, and one with a correction for climate. Out of 37 cranial traits, 34 showed a decline in variability with distance from Africa (binomial test, p<0.001; Table S3), and 12 of these (18 if we did not correct for climate) were significant after correction for multiple testing with a false discovery rate (FDR) procedure24. Although mean R2 was 6.3% (7.0% if we did not correct for climate), some traits showed a strong demographic signal (Fig. 4; Table S3). A further test of how reliable these results are is to repeat the analysis on an equivalent but smaller dataset of female skulls, composed of 1579 individuals from 39 populations (Table S2). The results are very similar to the ones found in males (Table S4), with a mean R2 of 9.1% for distance (8.9% without correcting for climate). Furthermore, slopes of trait CV over distance for females are almost identical to those obtained for males (best regression line: [female_slope_trait_x]=1.00 *[male_slope_trait_x], R2 =0.77, F1,36=124.9, p<0.001).
Fig. 4.

Relationships between phenotypic variability for four traits (expressed as CV, corrected for climate) from male skulls and distance from the putative African origin (represented by the centroid of locations of origins). The traits are: (a) Lambda-opisthion chord (OCC), (b) Nasion prosthion height (NPH), (c) Nasal height (NLH), and (d) Zygomaxillary subtense (SSS).
Given that distance from Africa explains over 87% of variance in heterozygosity at neutral microsatellite markers5, the equivalent values for morphometric traits might seem disappointing. However, phenotypes are only partially determined by genotypes, as the environment is also playing an important role. Heritability, h2, defines the fraction of variance in a trait affected by genetics, and this represents an upper ceiling for the size of the demographic signal that can be detected. Estimates of heritability for cranial traits are rare, but Carson25 recently derived values for 19 of the traits included in our analysis and these correlate significantly with the proportion of variance explained by distance from Africa (males rS=0.56, p=0.012). On average, R2/h2=0.20 (s.e.=0.06) for males and R2/h2=0.20 (s.e.=0.06) for females (0.24±0.06 and 0.25±0.06 respectively if we did not correct for climate), indicating that the proportion of explained variance is at least a fifth of the heritability. Interestingly, this figure is similar to the 17 - 35% of variance explained by distance from Africa for class I MHC genes which are under selection by infectious diseases26, just as climatic factors select for skull shape. Thus, after allowing for the impact of heritability and selection, the signal of ancient demography in human skull variability should properly be seen as remarkably strong.
Methods Summary
Thirty-seven morphometric cranial traits (Table S1) were measured in 4666 male skulls drawn from 105 populations (Fig.1; Table S2) 15, 16. After correcting for climate, we looked for the likely origin of human diversity by investigating the relationship between phenotypic diversity (scored as mean standardised phenotypic variance19) and distances on land from locations across the globe. We then tested for the presence of a second origin by testing whether adding distances to putative locations improved the single origin model. We also assessed the strength of the signal from ancient demography on variability in individual traits for both male skulls and an additional dataset of 1579 female skulls from 39 populations, and compared patterns found in the two sexes. Finally, we investigated the magnitude of the ancient demographic signal in the context of the heritability of individual traits, since heritability provides an upper limit to any signature left by genetic factors.
Methods
Datasets
Thirty-seven morphometric cranial traits (Table S1) were measured in 6245 skulls (4666 male and 1579 female), drawn from 105 and 39 populations for males and females respectively (Fig.1; Table S2). Details on the measurements are provided elsewhere15, 16. Mid-oceanic populations were excluded because their origins are often unclear. Also excluded were samples over 2,000 years old, as deterioration might lead to biased estimates of phenotypic variability. Only the male dataset was large enough to discriminate among potential origins of diversity. Consequently, the female dataset was used for comparison when estimating the strength of the clines detected using male skulls. Genetic data come from the latest version of the HGDP-CEPH panel21, 22, which includes 971 individuals belonging to 54 populations and typed for 789 neutral autosomal microsatellites. Climate data (minimum and maximum temperature, and average precipitation) were obtained from WORDCLIM27, as sets of global climatic GIS layers with a 30 arc-seconds resolution.
Statistical analysis
Total within-population phenotypic variability was computed as the mean standardised phenotypic variance over all traits, following Relethford and Blangero19. Variability of individual traits within each population was computed as the Coefficient of Variation (CV, the ratio of the standard deviation to the mean). This dimensionless measure allows comparisons between different traits. Realistic geographic distances between locations were computed as the shortest route through landmasses that avoid areas with a mean altitude over 2,000 m and assuming the following land bridges: a single connection between Africa and Eurasia via a route through the Sinai to the Levant, the Bering Strait between Eurasia and the Americas, and connections between the Malaysian Peninsula to Melanesia and Oceania5, 20.
To model the effect of climate on craniometric traits (male skulls only), we fitted a linear model with mean standardised phenotypic variance as the response and three climatic variables and all their possible interactions as predictors. Starting from this full model, we then found a minimal model for climate by backwards stepwise elimination using the Bayesian Information criterion (BIC) 28.
The presence of a primary cline in diversity was tested by fitting as an additional predictor to the minimal climate model, distance from a range of potential origins distributed at intervals of 5 degrees latitude / longitude across the whole of Africa, Eurasia and Australia. As we effectively had to compare hundreds of similar models with only a slight difference in the values of the predictor variable (distances from different locations), we used BIC to select origins that gave similarly good fits. Models within 4 units of the best model have “considerable support”29, thus providing a suitable envelope for the likely real origin. Having identified an African origin, we searched for a second origin by fitting distances from origins outside Africa as an additional predictor to the best African model. This approach was then repeated using the genetic dataset, with heterozygosity as the response variable in a linear model.
The strength of the relationship between variability of individual traits and distance from Africa was explored by considering individual traits in both males and females. Distances from a centroid of likely origins were fitted on top of the minimal climate model with the CV of traits as individual responses. Visual inspection of the relationship between CV and geographic distance revealed outliers in several traits. To account for heteroskedasticity without resorting to ad-hoc removal of populations, we used robust regression with MM-estimators23 fitted in R30 using the robustbase package. This technique allows the estimation of linear models that are not affected by the outliers. We fitted models both with and without correcting for climate. The proportion of variance explained by distance from Africa when correcting for climate was estimated by subtracting the R2 of the model including distance and climate from the R2 of the climate model alone. Due to the large number of nested tests, it is difficult to formulate exact p-values. To provide a measure of goodness of fit, we computed Local False Discovery Rates24 using the fdrtools package in R30.
Supplementary Material
Acknowledgements
We thank three anonymous referees for their comments on a previous version of the manuscript that greatly improved the paper. F.B. was supported by the BBSRC.
References
- 1.Mellars P. Going east: New genetic and archaeological perspectives on the modern human colonization of Eurasia. Science. 2006;313:796–800. doi: 10.1126/science.1128402. [DOI] [PubMed] [Google Scholar]
- 2.Trinkaus E. Early modern humans. Annual Review Of Anthropology. 2005;34:207–230. [Google Scholar]
- 3.Mellars P. Why did modern human populations disperse from Africa ca. 60,000 years ago? A new model. Proceedings Of The National Academy Of Sciences Of The United States Of America. 2006;103:9381–9386. doi: 10.1073/pnas.0510792103. [DOI] [PMC free article] [PubMed] [Google Scholar]
- 4.Liu H, Prugnolle F, Manica A, Balloux F. A geographically explicit genetic model of worldwide human-settlement history. American Journal Of Human Genetics. 2006;79:230–237. doi: 10.1086/505436. [DOI] [PMC free article] [PubMed] [Google Scholar]
- 5.Prugnolle F, Manica A, Balloux F. Geography predicts neutral genetic diversity of human populations. Current Biology. 2005;15:R159–R160. doi: 10.1016/j.cub.2005.02.038. [DOI] [PMC free article] [PubMed] [Google Scholar]
- 6.Ramachandran S, et al. Support from the relationship of genetic and geographic distance in human populations for a serial founder effect originating in Africa. Proceedings Of The National Academy Of Sciences Of The United States Of America. 2005;102:15942–15947. doi: 10.1073/pnas.0507611102. [DOI] [PMC free article] [PubMed] [Google Scholar]
- 7.Ray N, Currat M, Berthier P, Excoffier L. Recovering the geographic origin of early modern humans by realistic and spatially explicit simulations. Genome Research. 2005;15:1161–1167. doi: 10.1101/gr.3708505. [DOI] [PMC free article] [PubMed] [Google Scholar]
- 8.Grine FE, et al. Late Pleistocene human skull from Hofmeyr, South Africa, and modern human origins. Science. 2007;315:226–229. doi: 10.1126/science.1136294. [DOI] [PubMed] [Google Scholar]
- 9.Wolpoff MH, Hawks J, Caspari R. Multiregional, not multiple origins. American Journal Of Physical Anthropology. 2000;112:129–136. doi: 10.1002/(SICI)1096-8644(200005)112:1<129::AID-AJPA11>3.0.CO;2-K. [DOI] [PubMed] [Google Scholar]
- 10.Brauer G, Collard M, Stringer C. On the reliability of recent tests of the Out of Africa hypothesis for modern human origins. Anatomical Record Part A-Discoveries In Molecular Cellular And Evolutionary Biology. 2004;279A:701–707. doi: 10.1002/ar.a.20064. [DOI] [PubMed] [Google Scholar]
- 11.Lahr MM. The multiregional model of modern human origins - A reassessment of its morphological basis. Journal Of Human Evolution. 1994;26:23–56. [Google Scholar]
- 12.Wolpoff MH. In: The human revolution: Biological perspectives in the origins of modern humans. Mellars P, Stringer C, editors. Princeton: Princeton University Press; 1989. [Google Scholar]
- 13.Fowler K, Whitlock MC. The distribution of phenotypic variance with inbreeding. Evolution. 1999;53:1143–1156. doi: 10.1111/j.1558-5646.1999.tb04528.x. [DOI] [PubMed] [Google Scholar]
- 14.Frankham R. Do island populations have less genetic variation than mainland populations? Heredity. 1997;78:311–327. doi: 10.1038/hdy.1997.46. [DOI] [PubMed] [Google Scholar]
- 15.Hanihara T, Ishida H. Metric dental variation of major human populations. American Journal Of Physical Anthropology. 2005;128:287–298. doi: 10.1002/ajpa.20080. [DOI] [PubMed] [Google Scholar]
- 16.Hanihara T, Ishida H. Os incae: variation in frequency in major human population groups. Journal Of Anatomy. 2001;198:137–152. doi: 10.1046/j.1469-7580.2001.19820137.x. [DOI] [PMC free article] [PubMed] [Google Scholar]
- 17.Roseman CC. Detecting interregionally diversifying natural selection on modern human cranial form by using matched molecular and morphometric data. Proceedings Of The National Academy Of Sciences Of The United States Of America. 2004;101:12824–12829. doi: 10.1073/pnas.0402637101. [DOI] [PMC free article] [PubMed] [Google Scholar]
- 18.Relethford JH. Boas and beyond: Migration and craniometric variation. American Journal Of Human Biology. 2004;16:379–386. doi: 10.1002/ajhb.20045. [DOI] [PubMed] [Google Scholar]
- 19.Relethford JH, Blangero J. Detection Of Differential Gene Flow From Patterns Of Quantitative Variation. Human Biology. 1990;62:5–25. [PubMed] [Google Scholar]
- 20.Manica A, Prugnolle F, Balloux F. Geography is a better determinant of human genetic differentiation than ethnicity. Human Genetics. 2005;118:366–371. doi: 10.1007/s00439-005-0039-3. [DOI] [PMC free article] [PubMed] [Google Scholar]
- 21.Rosenberg NA. Standardized subsets of the HGDP-CEPH human genome diversity cell line panel, accounting for atypical and duplicated samples and pairs of close relatives. Annals Of Human Genetics. 2006;70:841–847. doi: 10.1111/j.1469-1809.2006.00285.x. [DOI] [PubMed] [Google Scholar]
- 22.Rosenberg NA, et al. Genetic structure of human populations. Science. 2002;298:2381–2385. doi: 10.1126/science.1078311. [DOI] [PubMed] [Google Scholar]
- 23.Venables WN, Ripley BD. Modern Applied Statistics with S. New York: Springer-Verlag; 2002. [Google Scholar]
- 24.Storey JD, Tibshirani R. Statistical significance for genomewide studies. Proceedings of the National Academy of Sciences of the United States of America. 2003;100:9440–9445. doi: 10.1073/pnas.1530509100. [DOI] [PMC free article] [PubMed] [Google Scholar]
- 25.Carson EA. Maximum likelihood estimation of human craniometric heritabilities. American Journal of Physical Anthropology. 2006;131:169–180. doi: 10.1002/ajpa.20424. [DOI] [PubMed] [Google Scholar]
- 26.Prugnolle F, et al. Pathogen-driven selection and worldwide HLA class I diversity. Current Biology. 2005;15:1022–1027. doi: 10.1016/j.cub.2005.04.050. [DOI] [PubMed] [Google Scholar]
- 27.Hijmans RJ, Cameron SE, Parra JL, Jones PG, A. J. Very high resolution interpolated climate surfaces for global land areas. International Journal of Climatology. 2005;25:1965–1978. [Google Scholar]
- 28.Crawley MJ. Statistical Computing: An Introduction to Data Analysis Using S-Plus. London: John Wiley; 2002. [Google Scholar]
- 29.Burnham KP, Anderson DR. Model selection and inferences. New York: Springer Verlag; 1998. [Google Scholar]
- 30.R Development Core Team . Vienna: R Foundation for Statistical Computing; 2006. [Google Scholar]
Associated Data
This section collects any data citations, data availability statements, or supplementary materials included in this article.