

Abstract
This study documents a case of coinfection (simultaneous infection of an individual with two or more strains) of two HIV-1 subtype B strains in an individual from a Phase 3 HIV-1 vaccine efficacy trial, conducted in North American and the Netherlands. We examined 86 full-length gp120 (env) gene sequences from this individual collected from nine different time points over a 20-month period. We estimated evolutionary relationships using maximum likelihood and Bayesian methods and inferred recombination breakpoints and recombinant sequences using phylogenetic and substitutional methods. These analyses identified two strongly supported monophyletic clades (clades A and B) of 14 and 69 sequences each and a small paraphyletic recombinant clade of three sequences. We then studied the genetic characteristics of these lineages by comparing estimates of genetic diversity generated by mutation and recombination and adaptive selection within a coalescent and maximum likelihood framework. Our results suggest significant differences on the evolutionary dynamics of these strains. We then discuss the implications of these results for vaccine development.
INTRODUCTION
Occurrence of infection with more than one strain of HIV-1 (dual infection) has important implications for understanding HIV transmission and for AIDS vaccine development1,2 and has led to many instances of recombinant viral strains of global epidemiologic relevance.3 Dual HIV-1 infection can be the result of either superinfection (infection with a second strain during some period after the initial established infection) or coinfection (establishment of simultaneous or near simultaneous infection with two or more heterologous HIV-1 strains within a brief period of time). The current literature defines, arbitrarily, HIV coinfection as occurring within the first month of infection.2 Coinfection has been reported in many cases of HIV-1-infected individuals. Some of these cases have been observations of infected individuals with two subtypes (intersubtype)4–10 but others involved HIV-1 variants from the same subtype (intrasub-type).11–14 Less common are the studies where recombination between different coinfecting HIV strains has been documented.11,12 Although recombination is a frequent phenomenon in vivo15–17 and constitutes a significant factor in assisting HIV-1 diversification and escape from host immunity and antiviral therapies, the role that recombination and dual infection play in contributing to virus variation is not well characterized.18 For example, the generation of new strains should be a more common phenomenon in cases of dual infection. Additionally, an overall greater amount of genetic diversity in a coinfected population with recombination and therefore a greater ability to defeat an immune system, drug treatment, or vaccine treatment, potentially resulting in a faster progression to AIDS, should be expected.
Here we report a case of coinfection between two strains of HIV-1 subtype B in a volunteer from the world’s first Phase 3 HIV vaccine efficacy trial (VAX004). Using phylogenetic and population genetic methods, we present congruent and well-supported evidence of recombination between two coinfecting strains of HIV. Additionally, we genetically characterized the evolution of these strains separately and combined using statistical approaches of population parameter inference. Population genetics is indeed important in understanding the evolutionary history, epidemiology, and population dynamics of pathogens, the potential for and mode of evolution of drug and vaccine resistance, and ultimately for public health control strategies and vaccine design.19,20 Within this framework, we examine the population dynamics of the coinfecting HIV-1 strains by estimating and comparing their coalescent and likelihood estimates of genetic diversity generated by mutation and recombination, growth, and selection.
MATERIALS AND METHODS
Clinical trial and volunteer characteristics
VaxGen enrolled 5417 individuals to participate in a Phase 3 vaccine clinical trial (VAX004) testing the efficacy of a recombinant subunit vaccine candidate (AIDSVAX B/B). The vaccine was composed of two HIV-1 gp120 envelope protein antigens derived from the CCR5-dependent GNE8 and CXCR4-dependent MN strains. Trial participants received up to seven injections of vaccine or placebo over a 36-month period and were seen every 6 months for regular HIV testing and counseling. Details of the study design and efficacy results are reported by the rgp120 HIV Vaccine Study Group.21
From these studies, one trial participant was identified as being potentially dually infected with at least two different HIV strains, so an additional molecular study was undertaken to analyze the complete set of longitudinal samples from this person. The clinical progression of HIV-1 viremia and CD4 cell counts within this trial participant, a white male who received three immunizations prior to infection, is shown in Table 1. Screening of sera samples with the Procleix HIV-1/HCV Assay (Chiron) indicated that the first HIV-1-positive timepoint for this volunteer was September 21, 2000 (data not shown). However, no viral load or CD4 count information was available for that collection time. Between November 28, 2000 (T3) and December 18, 2000 (T4) the volunteer started antiretroviral therapy. After that the viral loads were always lower than 7 × 10³ copies/ml. CD4 cell counts were higher than 550 cells/mm3 from November 20, 2000 (T2) to the end, except for July 2001 (T6), when they decreased to 380 cells/mm3.
TABLE 1.
Samples, Collection Dates, Time Points, ART Therapy, Viral Load (VL), CD4 Counts, and Sampled Tissuesa
| Sample name | Nb (86) | Collection date | Time point | ART therapy | VL (RNA copies/mL) | CD4 count (cells/mm3) | Sampled tissue |
|---|---|---|---|---|---|---|---|
| 101600P | 21 | 16-Oct-00 | T1 | — | 456,987 | 277 | Plasma |
| 112000P | 20 | 20-Nov-00 | T2 | — | 801,458 | 619 | Plasma |
| 112800P | 5 | 28-Nov-00 | T3 | — | 367,984 | 551 | Plasma |
| 112800C | 5 | 28-Nov-00 | T3 | — | — | — | Plasma |
| 121800P | 4 | 18-Dec-00 | T4 | Zidovudine and lamivudine/nelfinavir | 3,966 | 585 | Plasma |
| 121800C | 3 | 18-Dec-00 | T4 | Zidovudine and lamivudine/nelfinavir | — | — | Plasma |
| 022201M | 3 | 22-Feb-01 | T5 | Zidovudine and lamivudine/nelfinavir | 7,011 | 638 | PBMC |
| 070201P | 4 | 02-Jul-01 | T6 | Zidovudine and lamivudine/efavirenz | 746 | 379 | Plasma |
| 070201C | 4 | 02-Jul-01 | T6 | Zidovudine and lamivudine/efavirenz | — | — | Plasma |
| 100901P | 3 | 09-Oct-01 | T7 | Zidovudine and lamivudine/efavirenz | <400 | 633 | Plasma |
| 100901M | 3 | 09-Oct-01 | T7 | Zidovudine and lamivudine/efavirenz | — | — | PBMC |
| 021202P | 3 | 12-Feb-02 | T8 | Zidovudine and lamivudine/efavirenz | <400 | 743 | Plasma |
| 021202M | 3 | 12-Feb-02 | T8 | Zidovudine and lamivudine/efavirenz | — | — | PBMC |
| 060302P | 3 | 03-Jun-02 | T9 | Zidovudine and lamivudine/efavirenz | <775 | 615 | Plasma |
| 060302C | 2 | 03-Jun-02 | T9 | Zidovudine and lamivudine/efavirenz | — | — | Plasma |
Samples are designated by blood collection date and a letter indicating whether the sequence was derived from PPT plasma (P), CPT plasma (C), or PBMC (M), followed by a clone number. For example, 101600P1 is a sequence from October 16, 2000 isolated from PPT plasma and is clone number 1. Infection date for this trial participant was estimated as September 21, 2000. PPT and CPT are different plasma preparation tubes. PBMC, peripheral blood mononuclear cells.
N, the number of sequences for each time point; the number in parentheses indicates the total number of sequences.
We present here a comprehensive analysis of phylogenetic relationships, recombination, and population dynamics of HIV strains collected from this volunteer.
Molecular biology methods
HIV-1 gp120 viral RNA preparation and RT-PCR
Viral RNA and DNA was isolated from 0.5–1.0 ml of frozen plasma or peripheral blood mononuclear cells (PBMCs) using the ViroSeq Sample Preparation Kit (Applied Biosystems, Foster City, CA) and following the manufacturer’s instructions. Full-length gp120 sequences were amplified from samples using reverse-transcription polymerase chain reaction (RT-PCR). Random hexa-mers were utilized for the RT reaction followed by nested PCR reactions with the first round primers ED3/ED14 (ED3 5’-TTA GGC ATC TCC TAT GGC AGG AAG AAG CGG-3’ and ED14 5’-TCT TGC CTG GAG CTG TTT GAT GCC CCA GAC-3’) and then the second round primers envB/ED12 (envB 5’-AGA AAG AGC AGA AGA CAG TGG CAA TGA-3’ and ED12 5’-AGT GCT TCC TGC TGC TCC CAA GAA CCC AAG-3’). Note that for PCR from PBMC samples, no RT reaction was performed and only the PCR primers were used for amplification. The RT reaction condition was 37°C for 60 min with a second step of 90°C for 5 min (First Strand cDNA Synthesis kit, Amersham Biosciences, Piscataway, NJ). The PCR thermal cycling conditions for both rounds of PCR started with an initial denaturing step at 94°C for 2 min, then 30 cycles of 94°C for 15 sec, 55°C for 30 sec, 72°C for 3 min, with a final 72°C for 12 min (60 cycles total). Taq DNA Polymerase and buffer components were supplied by Sigma-Aldrich (St. Louis, MO).
Cloning and sequencing of PCR products
All resulting PCR reaction products were cloned into a bacterial plasmid (pCR 2.1-TOPO; Invitrogen, Carlsbad, CA) using the manufacturer’s recommended protocol and sequenced using BigDye 3.1 reaction mix and an ABI-3100 automated DNA sequencer (Applied Biosystems, Foster City, CA). Eight sequencing primers were used to provide coverage of both strands of the gp120 sequence: M13F 5’-GTAAAACGACGGCCAG-3’; BSEQF1 5’-ACCACTCTA-TTTTGTGCATCA-3’; BSEQF2 5’-AAACTGCTCTTTCAAT-GTCACCACA-3’; ES7 5’-CTGTTAAATGGCAGTCTAGC-3’; BSEQF4 5’-TCAAATATTACAGGGCTGCTA- TTAACAAG- 3’; BSEQR2 5’-GTTGTATTACAGTAGAAAAATTCCCCTC- 3’; BSEQR3 5’-CTGCCATTTAAC-AGCAGTTGAGTTG-3’; and M13R 5’-CAGGAAACAGCTATGAC-3’.
Phylogenetic analyses
A total of 89 sequences were collected from nine different time points from a single individual from the VAX004 Phase 3 AIDSVAX vaccine trial (Table 1). These sequences were translated into amino acids and then aligned using Clustal X.22 In addition to inferring positional homology in this amino acid data set, the alignment was loaded into the alignment editor Se-Al23 to check for possible errors and stop codons. Samples that contained frame shifts or stop codons were excluded from subsequent analyses leaving a final aligned data set of 86 gp120 sequences.
Fifty-six models of evolution were compared within a maximum likelihood (ML) framework using the Akaike Information Criterion (AIC) as implemented in ModelTest3.724 and outlined in Posada and Buckley.25 The chosen model of evolution was then implemented into PAUP*v4b1026 to estimate an ML tree27 for the full data set. ML searches were run using 100 random addition replicates and TBR branch swapping. Confidence in the resulting relationships was assessed using the nonparametric bootstrap procedure28 with 500 replicates, using heuristic searches with one random sequence addition and TBR branch swapping per replicate. Independent models of evolution for first, second, and third positions in the codon triplets were also estimated using ModelTest. These three models were then implemented in MrBayes3.1.129 to perform a mix-model Bayesian analysis coupled with Markov chain Monte Carlo (BAMCMC) of the full data set. Two independent BAMCMC analyses were run with each consisting of eight Markov chains. Each chain was started from a random tree and run for 1 × 10⁷ cycles, sampling every 1000th generation. Model parameters were treated as unknown variables with uniform default priors and were estimated as part of the analysis. Convergence and mixing were monitored using the program Tracer v1.2.30 All sample points prior to reaching stationarity were discarded as burn-in. The posterior probabilities (pP) for individual clades obtained from separate analyses were compared using the sumt command in MrBayes and combined and summarized on a 50% majority-rule-consensus tree.31 The ML and BAMCMC resulting trees were midpoint-rooted for easier visualization. Sequences were also aligned with other sequences from the laboratory (including the vaccine antigens), known laboratory strains, and other common subtypes to guard against contamination, mislabeling, and misidentification.32 The data set showed no signs of contamination or mislabeling and all gp120 sequences were classified as HIV-1 subtype B (data not shown).
Population dynamics
Identifying recombinants, especially among viruses of the same subtype, can be problematic. Based on both simulation studies33–35 and empirical results from HIV-1,36 methods to detect recombinants perform differentially well based on the overall genetic diversity in the data set with the typically used (in HIV-1 studies) phylogenetic methods tending to perform more poorly than substitution pattern approaches. Therefore, we chose to test for recombination using a variety of methods shown to be useful in detecting recombinants in these earlier studies, including MaxChiGlobal,34 PhylPro,37 Geneconv,38 and several recombination detection tools implemented in the software TOPALi39 and RDP2.40
We estimated genetic diversity (θW) and the population recombination rate (ρ) using the standard likelihood coalescent approach implemented in the LDhat2.0 package.41 Within this framework ρ can be expressed as 2Ner, where Ne is again the effective population size and r is the recombination rate per gene per generation. This method relaxes the infinite-sites assumption (typically violated by many empirical data sets 36) and accommodates different models of molecular evolution. LDhat2.0 also includes a powerful likelihood permutation test (LPT) to test the hypothesis of no recombination (ρ = 0). LDhat implements a corrected version (i.e., based on a finite-sites model) of the algorithm of Watterson42 for estimating θW. This estimator relies on the number of segregating sites in the sequences and it has been shown that although less efficient than coalescent ML, θW is still remarkably good.43,44
Adaptive selection
Adaptive selection at the molecular level is usually assessed by comparing the fixation rates of nonsynonymous (amino acid-altering) and synonymous (silent) substitutions within an ML phylogenetic framework45 estimating the nonsynonymous/synonymous substitution rate ratio or ω= dN/dS. ω measures the selective pressure at the protein level, with ω = 1 suggesting neutral evolution, ω < 1 negative selection, and ω > 1 positive selection. We inferred the extent of selection by estimating ω and the proportion of sites (p) with ω > 1 under the models M0 (one ratio), M1 (neutral), M2 (selection), M3 (discrete), M7 (beta), and M8 (beta and ω) of Goldman and Yang46 and Yang et al.45 Likelihood scores for the following nested models were compared using likelihood ratio tests (LRT): M0–M3, M1–M2, and M7–M8. We also applied the empirical Bayesian approaches implemented by Nielsen and Yang47 and Yang et al.48 to identify the potential sites under diversifying selection as indicated by a posterior probability (pP) > 0.95. All these analyses were carried out in PAML3.1449 and were performed under initial ω values > and <1, as recommended by the author. Here we report the ML estimates. ML trees were estimated for each clade under the bestfit substitution models.
RESULTS
Phylogenetic analyses
The Akaike Information Criterion (AIC), as implemented in ModelTest3.724 and outlined in Posada and Buckley,25 was used to select the most appropriate model of evolution from 56 different models, compared within an ML framework. The chosen model of evolution was then implemented into PAUP*v4b1026 to estimate an ML tree27 for the full data set. Under the AIC criterion the optimized model of evolution chosen for the entire data set of 86 sequences resulted in the TVM+I+Γ model, a model often found for HIV-1 sequences.50 The ML parameters associated with this model were as follows: base frequencies A = 0.3622, C = 0.1811, G = 0.2233, T = 0.2334, rate parameters of R1 = 2.0370, R2 = 7.0780, R3 = 0.6577, R4 = 0.4955, R5 = 7.0780, and R6 = 1.0, an alpha value for the gamma shape distribution of a = 0.9108, and a proportion of invariable sites of 0.4104. Using this model, we estimated an ML tree of evolutionary relationships (Fig. 1). Model testing under the AIC criterion for first, second, and third positions of the alignment resulted in the following models: GTR+I+Γ, GTR+Γ, and TVM+I+Γ, respectively. These three models were incorporated under the mixed-model Bayesian estimation. The resulting BMCMC tree was almost identical to that depicted in Fig. 1, but with greater clade support. The resulting phylogeny showed two distinct monophyletic groups of sequences, labeled as clades A and B, and a small group of three sequences clearly distinct connecting them (recombinant A&B). This topology is suggestive of recombination between clades A and B. The long branches separating these clades were supported by high bootstrap values (100%) and high posterior probabilities (1.0). The earliest time point (16OCT00 or 101600 as labeled on the phylogeny) was found in all lineages. Lineage B includes only members of this time point (T1) and the next time point in sampling (20NOV00 or 112000; T2). All subsequent time points are found exclusively in lineage A. Within this clade, longitudinal separation of time points T1–5, T6, and T7–9 can be observed. The recA&B group included the following three sequences: 101600C5, 101600C14, and 101600C12, all from T1.
FIG. 1.
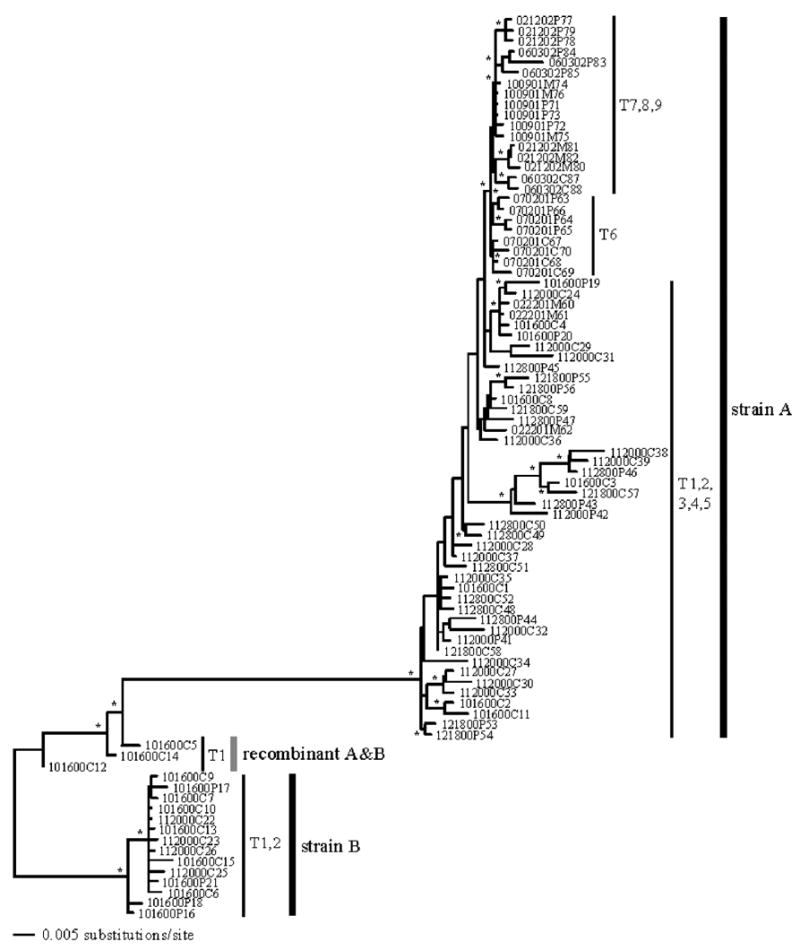
Maximum likelihood estimate of phylogenetic relationships. A mix model Bayesian analysis generated almost the same relationships. Clades supported by bootstrap values ≥ 70% and/or posterior probabilities ≥ 0.95 are indicated with an asterisk (*) on the branches. Branch lengths are shown proportional to the amount of evolutionary change. The sequence labels are described in Table 1 and sequence labels are coded by collection date.
Genetic divergence (GD) between and within strains based on corrected distances under the TVM+I+ Γ model is shown in Table 2. Clade A (0.000–0.049) showed greater GD between clones than clade B (0.001–0.013), but at least two times smaller than the GD observed between strains (0.097–0.131). The recA&B showed intermediate values of GD within clones (0.0090.022) and, as reflected in our trees, lower GD with clade B (0.032–0.059) than with clade A (0.051–0.095).
TABLE 2.
Genetic Divergence Range within and between Clades A, B, and the Recombinant A & B (RecA&B) Based on Corrected Distances Estimated under the TVM+I+Γ Model of Evolution
| Clade A | Clade B | RecA&B | |
|---|---|---|---|
| Clade A | 0.000–0.049 | 0.097–0.131 | 0.051–0.095 |
| Clade B | 0.097–0.131 | 0.001–0.013 | 0.032–0.059 |
| RecA&B | 0.051–0.095 | 0.032–0.059 | 0.009–0.022 |
Detection of recombinants
As suggested in the initial phylogenetic analyses (Fig. 1), the presence of recombination in the full data set was confirmed by the MaxChiGlobal test (p < 0.001). The phylogenetic profile analysis of the whole alignment (Fig. 2) and the distance plots obtained in RDP2 (Fig. 3) indicate that two or three recombination events seemed to have occurred at the beginning of the infection, giving rise to the recA&B group, with breakpoints around nucleotide positions 830, 966, and 1224, respectively. We used breakpoints 830 and 1224 to divide the whole alignment into three subregions and ML trees were constructed for each of them separately under the bestfit models (Fig. 4). Clear clustering by phylogenetic analysis of subregions of gp120 sequences highlights the regional contribution of the two parent populations to the construction of the new recombinant gp120 molecules (Fig. 4).
FIG. 2.
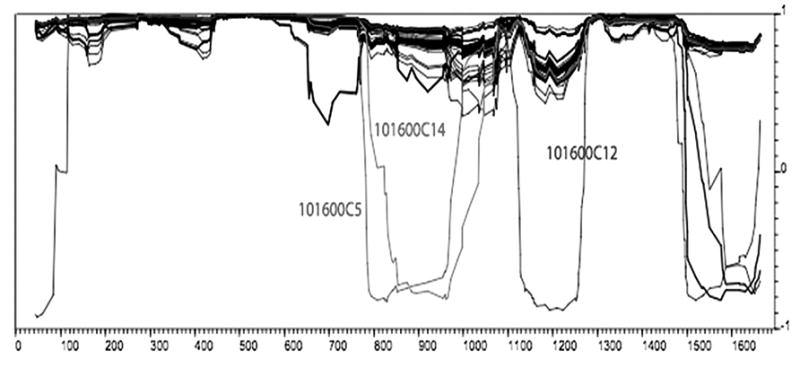
Phylogenetic profile analysis of the whole alignment.37 Negative correlation values (x-axis) indicate recombination breakpoints. Sequences 060302P83 and 060302P85 were excluded from the analysis because they contained many gaps. Low correlation values at the beginning and at the end of the alignment are noise.
FIG. 3.
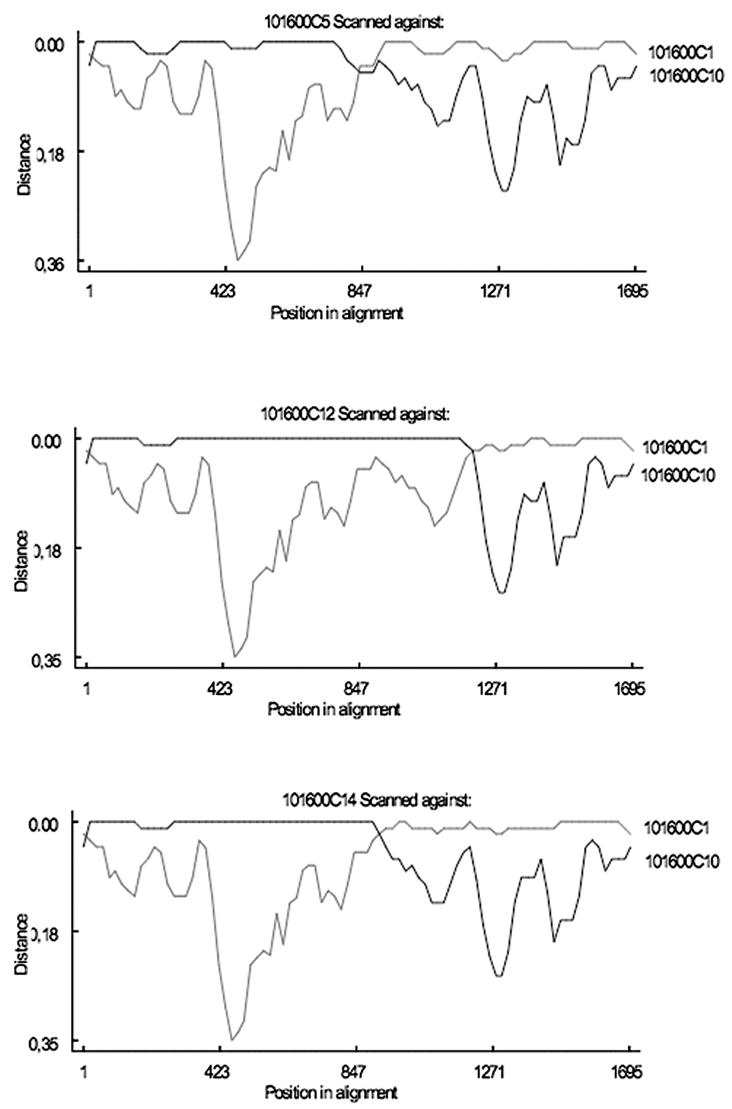
Distance plots obtained in RDP2 for the three putative recombinant sequences against two representatives of the two subtype B lineages.
FIG. 4.
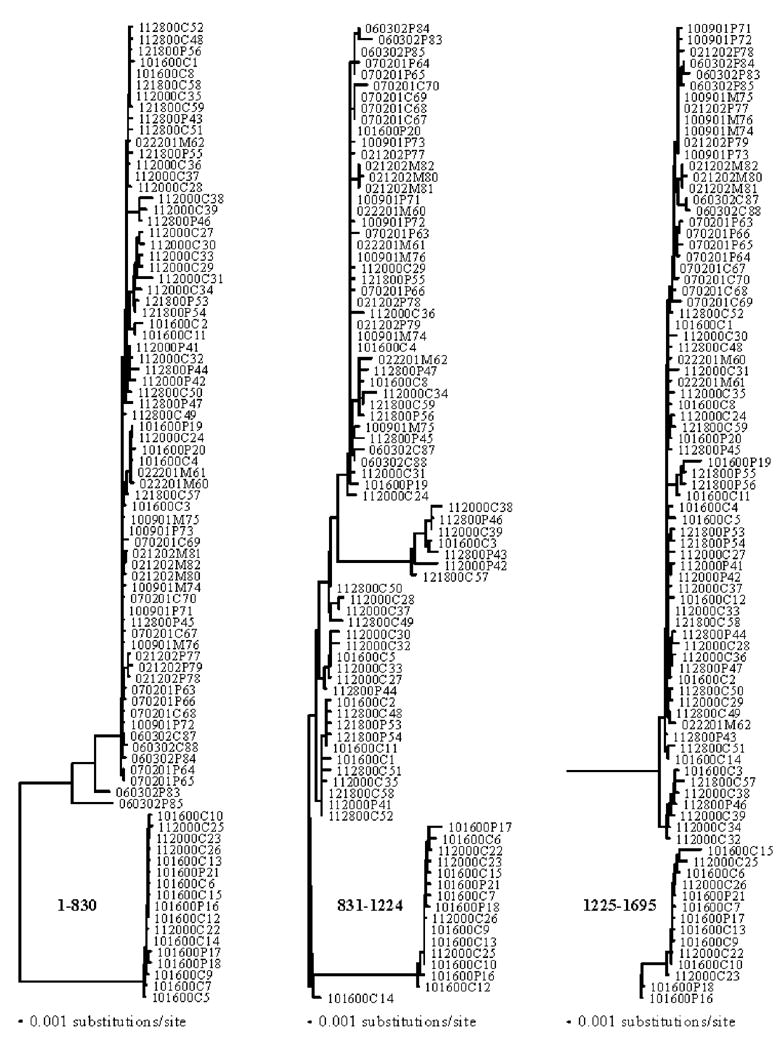
Maximum likelihood phylogenetic trees for three different subregions of the alignment. Recombinant sequences are highlighted.
Evolutionary dynamics of intrasubtype B strains
We characterized the population dynamics of this volunteer’s infecting virus with estimates of genetic diversity generated by mutation (θW) and recombination (ρ) for each strain and time point(s) (Table 3). θW and ρ were higher for clade A (θW = 0.039, ρ = 81%) compared to rates estimated for clade B (θW = 0.011, ρ = 2%). Sample size differences between strains are a concern when interpreting these estimates. These sample differences by themselves illustrate different evolutionary dynamics: clade A was present in all time points sampled (20-month period), but clade B did not appear in plasma or blood after the second time point (2 months). Nevertheless, genetic differences between clades A and B were clear since the first time point, as indicated by the θW and ρ estimates: θW and ρ were considerably higher for clade A at T1 and T2 or T1–2 (0.021–0.028 and 20–67, respectively) than they were for clade B (0.004–0.011 and 0–2, respectively) at the same time points (Table 3). Within clade A, θW diminishes after T4 probably as a result of a dramatic reduction in viral load (i.e., effective population size) due to the beginning of ART therapy application. We tested for positive selection by obtaining likelihood values and parameter estimates for different codon-substitution models of selection (Table 4). Model comparisons M0–M3, M1–M2, and M7–M8 for lineage B were not significant as indicated by the LRTs, hence no evidence of positive selection was observed. Consistent and significant strong levels of selection (ω = 4), however, for more than 5% of the sites were detected under site-specific models for lineage A. Under these models the Bayesian approaches were able to detect 8–16 sites under positive selection (pP > 0.95). Simulations by Anisimova et al.51 indicate that high levels of recombination (C ≈ 0.01), as those reported here for clade A, seem to affect dramatically the accuracy of the LRT test of models M0–M3 and M1–M2 but much less the LRT of models M7–M8, and often mistakes recombination as evidence of positive selection. Identification of sites under positive selection, however, using the Bayesian approach appears to be less affected.51 However, when data were simulated at very high levels (ω = 6) of positive selection (similar to those observed in our study) and the population was expanding, the LRT and Bayesian test become more accurate and powerful (concrete values are not reported). Therefore, although we think that recombination is probably inflating our PAML estimates of positive selection, the observed values are so high that it is clear that natural selection is a significant driving force in the evolution of these sequences as well. Previous work has also demonstrated convincing evidence for both adaptive selection and recombination.45,52,53
TABLE 3.
Estimates of Genetic Diversity (θW) and Population Recombination Rate (ρ)a
| θW | ρ | |
|---|---|---|
| Strain AT1–9 | 0.039 | 81*** |
| Strain AT1 | 0.021 | 20*** |
| Strain AT2 | 0.025 | 58*** |
| Strain AT3 | 0.021 | 75*** |
| Strain AT4 | 0.019 | 3*** |
| Strain AT5 | 0.009 | 0*** |
| Strain AT6 | 0.008 | 0*** |
| Strain AT7 | 0.003 | 0*** |
| Strain AT8 | 0.007 | 0*** |
| Strain AT9 | 0.009 | 0*** |
| Strain AT1–2 | 0.028 | 67*** |
| Strain BT1–2 | 0.011 | 2*** |
| Strain BT1 | 0.009 | 1*** |
| Strain BT2 | 0.004 | 0*** |
The probability of ρ = θ (indicated by asterisks) from the LPT test is also indicated. Sequences 060302P83 and 060302P85 were excluded from the analysis because they contained many gaps.
p < 0.01;
p < 0.001.
TABLE 4.
Likelihood Values, ω Estimates (ωM2, ωM3, AND ωM8), Proportion of Sites with A ω > 1 (ρM2, ρM3, and ρM8) and Number of Positively Selected Sites with a Posterior Probability > 0.95 (nM2, nM3, AND nM8)a
| −ln | LM0 | −ln | LM1 | −ln | LM2 | ωM2 | pM2 | nM2 | −ln | LM3 | ωM3 | pM3 | nM3 | −ln | LM7 | −ln | LM8 | ωM8 | pM8 | nM8 | |
|---|---|---|---|---|---|---|---|---|---|---|---|---|---|---|---|---|---|---|---|---|---|
| Clade A | 60 | 10.4 | 59 | 53.3 | 59 | 11.0 | 5.56 | 0.053 | 8 | 59 | 13.6 | 4.46 | 0.082 | 16 | 59 | 59.2 | 59 | 11.2 | 5.08 | 0.064 | 9 |
| Clade B | 25 | 9.2 | 25 | 9.7 | 25 | 9.7 | — | — | — | 25 | 8.7 | — | — | — | 25 | 9.7 | 25 | 9.7 | — | — | — |
The comparisons between models M0 and M3, M1 and M2, and M7 and M8 were only significant (p < 0.001) for clade A. ω and p estimates under purifying selection (ω < 1) or neutral selection (ω = 0) are not reported for any model.
DISCUSSION
Reports in the literature of dual infection are rare; for instance, superinfection has been documented in only 16 cases so far and most of those involved infection with different HIV subtypes.2 Due to the difficulty of detection, intrasubtype dual infections would be expected to be even more rarely reported. In the absence of substantive clinical indications of a dual infection (e.g., increases in viral load or accelerated disease progression while on drug therapy), the ability to detect multiple infection events is generally limited to molecular or serological analyses. However, even using molecular techniques, the detection of dual infection and recombination can be problematic for several reasons, especially if infection occurs with HIV isolates of the same subtype. For example, inadequate or improper use of phylogenetic and recombination detection methods, insufficient longitudinal sampling, and the use of partial gene sequences instead of complete genes or genomes make it likely that estimates of dual infection and recombination are underestimated in many at-risk populations.
In this study we reported on an individual from a Phase 3 HIV vaccine efficacy trial who was infected with multiple HIV strains and a recombinant population, despite receiving repeated vaccinations with a recombinant gp120-based vaccine. This study clearly demonstrates the importance of sampling close to the infection event in order to detect dual infection. Indeed, if the initial sampling took place after the second time point, clade B and the recA&B clade would never have been sampled.
In the current study, we also thoroughly document recombination using multiple phylogenetic and pattern matching methods. We expect that the recA&B clade is indeed a true recombinant group (i.e., and not generated by PCR) for the following reasons: (1) the recombinant breakpoints, while closely associated by region, are distinct, suggesting that more than one recombination event generated these new mutants and (2) despite at least three breakpoints at the approximate positions 830, 966, and 1224, all three gp120 sequences recombined to form an uninterrupted open reading frame. For this study, in fact, we only used sequences with full open reading frames (i.e., presumably functional molecules), to reduce the risk of analyzing nonfunctional sequences.
While phylogenetic methods are not always reliable predictors of recombination, in this case, both phylogenetic and pattern matching methods substantiated the recombinants and clearly differentiated the three populations (Figs. 1 and 4). While it is widely known that recombination occurs frequently in vivo,17,18,54 it is unclear how common recombination is between viruses from different infection events and in various geographic regions. For example, in Africa circulating recombinant forms are widespread and can make up a large percentage of the virus population in many countries,55–57 whereas recombination in North American viruses is seldom observed. Indeed this is partly a consequence of the fact that recombination between subtypes is much more easily detected than within subtypes and that there are far fewer subtypes circulating in North America (predominantly subtype B). This study thus complements prior studies reporting evidence of recombination between different strains of a single HIV-1 subtype,11,12 which taken together indicate that recombination of viral genomes within the different strains present in an infected individual may constitute a significant factor in the generation of HIV-1 diversity.11
Differences in sample size per time point (Table 1) suggest important differences in population dynamics between invasive strains since we see no representation of lineage B or the recombinant recA&B after time point two (before treatment with ART therapy). Population dynamics can be efficiently studied using explicit statistical models of evolution, such as the coalescent58 and the ML27 approaches that describe their effect on gene sequences. Here we used different implementations of these approaches to compare key population parameters such asθ, ρ, andω. between two HIV-1 strains. Observed significant differences in these parameters confirm sampling observations. Clade B is much more homogeneous than clade A, as indicated by their lower values of genetic diversity (θW) and recombination (ρ) (Table 3) and genetic divergence (Table 2). We found no evidence of adaptive selection in clade B (Table 4); hence, based on the gp120 gene region analyzed, it can be postulated that clade B viruses were not able to escape the immune system and ultimately failed to establish. Nevertheless, other factors such as different growth kinetics or stochastic loss due to severe viral drop (only for the later time points) cannot be ruled out to explain the failure of this strain. After the second month of infection, clade A began to dominate the viral population and eventually took over completely (Table 1). High levels of selection pressure on this clade were observed (Table 4), as expected for populations subjected to significant immunological pressure. Finally, the phylogeny itself (Fig. 1) also reflects this difference in growth rate among the strains and also the relative increase in fitness due to adaptation experienced by clade A as evidenced by the different clustering of the samples: early samples (T1–5) are depicted at the bottom of clade A and late samples (T7–9) at shallower nodes, with sample T6 in an intermediate position.
In summary, this study reports a case of coinfection and recombination from an HIV vaccine efficacy trial. As part of this presumably single infection event, this trial participant harbors two major virus populations and a small recombinant group, all of subtype B. Under the same host and treatment conditions it has been demonstrated that these three virus populations responded with different evolutionary dynamics over a period of about 2 years probably because of their different genetic backgrounds. This study underscores the need for a much larger survey to document the actual prevalence of multiple infection and recombination events in both vaccine and placebo groups from trial populations to better understand the relative population dynamics of HIV evolution in high-risk populations and in response to vaccine treatment.
Acknowledgments
The authors are indebted to the thousands of clinical trial volunteers who participated in the first Phase 3 HIV vaccine efficacy trial and who, as a result, have contributed a great deal to our current understanding of HIV. K.C. and D.P. were supported in part by NIH Grant GM 12 13 66276.
Footnotes
SEQUENCE DATA
All DNA sequences are deposited in GenBank under accession numbers P2924864–DQ924949.
References
- 1.Goulder PJ, Walker BD. HIV-1 superinfection: A word of caution. N Engl J Med. 2002;347:756–758. doi: 10.1056/NEJMe020091. [DOI] [PubMed] [Google Scholar]
- 2.Smith DM, Richman DD, Little SJ. HIV superinfection. J Infect Dis. 2005;192:438–444. doi: 10.1086/431682. [DOI] [PubMed] [Google Scholar]
- 3.Blackard JT, Cohen DE, Mayer KH. Human immunodeficiency virus superinfection and recombination: Current state of knowledge and potential clinical consequences. Clin Infect Dis. 2002;34:1108–1114. doi: 10.1086/339547. [DOI] [PubMed] [Google Scholar]
- 4.Artenstein AW, VanCott TC, Mascola JR, et al. Dual infection with human immunodeficiency virus type 1 of distinct envelope subtypes in humans. J Infect Dis. 1995;171:805–810. doi: 10.1093/infdis/171.4.805. [DOI] [PubMed] [Google Scholar]
- 5.Xin K-Q, Ma X-H, Crandall KA, et al. Dual infection with HIV-1 Thai subtype B and E. Lancet. 1995;346:1372–1373. doi: 10.1016/s0140-6736(95)92391-8. [DOI] [PubMed] [Google Scholar]
- 6.Janini LM, Pieniazek D, Peralta JM, et al. Identification of single and dual infections with distinct subtypes of human immunodeficiency virus type 1 by using restriction fragment length polymorphism analysis. Virus Genes. 1996;13:69–81. doi: 10.1007/BF00576981. [DOI] [PubMed] [Google Scholar]
- 7.Becker-Pergola G, Mellquist JL, Guay L, et al. Identification of diverse HIV type 1 subtypes and dual HIV type 1 infection in pregnant Ugandan women. AIDS Res Hum Retroviruses. 2000;16:1099–1104. doi: 10.1089/088922200414938. [DOI] [PubMed] [Google Scholar]
- 8.Mellquist JL, Becker-Pergola G, Gu J, et al. Dual transmission of subtype A and D HIV type 1 viruses from a Ugandan woman to her infant. AIDS Res Hum Retroviruses. 1999;15:217–221. doi: 10.1089/088922299311637. [DOI] [PubMed] [Google Scholar]
- 9.Ramos A, Tanuri A, Schechter M, et al. Dual and recombinant infections: An integral part of the HIV-1 epidemic in Brazil. Emerg Infect Dis. 1999;5:65–74. doi: 10.3201/eid0501.990108. [DOI] [PMC free article] [PubMed] [Google Scholar]
- 10.Yerly S, Jost S, Monnat M, et al. HIV-1 co/super-infection in intravenous drug users. AIDS. 2004;18:1413–1421. doi: 10.1097/01.aids.0000131330.28762.0c. [DOI] [PubMed] [Google Scholar]
- 11.Diaz RS, Sabino EC, Mayer A, Mosley JW, Busch MP. Dual human immunodeficiency virus type 1 infection and recombination in a dually exposed transfusion recipient. The Transfusion Safety Study Group. J Virol. 1995;69:3273–3281. doi: 10.1128/jvi.69.6.3273-3281.1995. [DOI] [PMC free article] [PubMed] [Google Scholar]
- 12.Zhu T, Wang N, Carr A, Wolinsky S, Ho DD. Evidence for coinfection by multiple strains of human immunodeficiency virus type 1 subtype B in an acute seroconvertor. J Virol. 1995;69:1324–1327. doi: 10.1128/jvi.69.2.1324-1327.1995. [DOI] [PMC free article] [PubMed] [Google Scholar]
- 13.Butto S, Argentini C, Mazzella AM, et al. Dual infection with different strains of the same HIV-1 subtype. AIDS. 1997;11:694–696. [PubMed] [Google Scholar]
- 14.Gottlieb GS, Nickle DC, Jensen MA, et al. Dual HIV-1 infection associated with rapid disease progression. Lancet. 2004;363:619–622. doi: 10.1016/S0140-6736(04)15596-7. [DOI] [PubMed] [Google Scholar]
- 15.Robertson DL, Hahn BH, Sharp PM. Recombination in AIDS viruses. J Mol Evol. 1995;40:249–259. doi: 10.1007/BF00163230. [DOI] [PubMed] [Google Scholar]
- 16.Robertson DL, Sharp PM, McCutchan FE, Hahn BH. Recombination in HIV-1. Nature. 1995;374:124–126. doi: 10.1038/374124b0. [DOI] [PubMed] [Google Scholar]
- 17.Jung A, Maier R, Vartanian J-P. Multiply infected spleen cells in HIV patients. Nature. 2002;418:144. doi: 10.1038/418144a. [DOI] [PubMed] [Google Scholar]
- 18.Rambaut A, Posada D, Crandall KA, Holmes EC. The causes and consequences of HIV evolution. Nature Rev Genet. 2004;5:52–61. doi: 10.1038/nrg1246. [DOI] [PubMed] [Google Scholar]
- 19.Maynard Smith J. Do bacteria have population genetics? In: Baumberg S, Young JPW, Saunders JR, Wellington EMH, editors. Population Genetics of Bacteria Society for General Microbiology, Symposium 52. Cambridge University Press; London: 1995. pp. 1–12. [Google Scholar]
- 20.Holmes EC, Zhang LQ, Robertson P, et al. The molecular epidemiology of human immunodeficiency virus type 1 in Edinburgh. J Infect Dis. 1995;171:45–53. doi: 10.1093/infdis/171.1.45. [DOI] [PubMed] [Google Scholar]
- 21.The rgp120 HIV Vaccine Study Group. Placebo-controlled phase 3 trial of a recombinant glycoprotein 120 vaccine to prevent HIV-1 infection. J Infect Dis. 2005;191:654–665. doi: 10.1086/428404. [DOI] [PubMed] [Google Scholar]
- 22.Thompson JD, Gibson TJ, Plewniak F, Jeanmougin F, Higgins DG. The clustalX windows interface: Flexible strategies for multiple sequence alignment aided by quality analysis tools. Nucleic Acids Res. 1997;24:4876–4882. doi: 10.1093/nar/25.24.4876. [DOI] [PMC free article] [PubMed] [Google Scholar]
- 23.Rambaut A. Se-Al: Sequence Alignment Editor. 1996 Available at http://evolve.zoo.ox.ac.uk/
- 24.Posada D, Crandall KA. Modeltest: Testing the model of DNA substitution. Bioinformatics. 1998;14:817–818. doi: 10.1093/bioinformatics/14.9.817. [DOI] [PubMed] [Google Scholar]
- 25.Posada D, Buckley TR. Model selection and model averaging in phylogenetics: Advantages of Akaike information criterion and Bayesian approaches over likelihood ratio tests. Syst Biol. 2004;53:793–808. doi: 10.1080/10635150490522304. [DOI] [PubMed] [Google Scholar]
- 26.Swofford DL. PAUP*. Phylogenetic Analysis Using Parsimony (*and Other Methods) Sinauer Associates; Sunderland, PA: 2002. [Google Scholar]
- 27.Felsenstein J. Evolutionary trees from DNA sequences: A maximum likelihood approach. J Mol Evol. 1981;17:368–376. doi: 10.1007/BF01734359. [DOI] [PubMed] [Google Scholar]
- 28.Felsenstein J. Confidence limits on phylogenies: An approach using the bootstrap. Evolution. 1985;39:783–791. doi: 10.1111/j.1558-5646.1985.tb00420.x. [DOI] [PubMed] [Google Scholar]
- 29.Ronquist F, Huelsenbeck JP. MrBayes 3: Bayesian phylogenetic inference under mixed models. Bioinformatics. 2003;19:1572–1574. doi: 10.1093/bioinformatics/btg180. [DOI] [PubMed] [Google Scholar]
- 30.Rambaut A, Drummond A. Tracer v1.2. 2004 http://evolve.zoo.ox.ac.uk/software.html.
- 31.Huelsenbeck JP, Larget B, Miller RE, Ronquist F. Potential applications and pitfalls of Bayesian inference of phylogeny. Syst Biol. 2002;51:673–688. doi: 10.1080/10635150290102366. [DOI] [PubMed] [Google Scholar]
- 32.Korber BT, Learn G, Mullins JI, Hahn BH, Wolinsky S. Protecting HIV databases. Nature. 1995;378:242–243. doi: 10.1038/378242a0. [DOI] [PubMed] [Google Scholar]
- 33.Brown CJ, Garner EC, Dunker AK, Joyce P. The power to detect recombination using the coalescent. Mol Biol Evol. 2001;18:1421–1424. doi: 10.1093/oxfordjournals.molbev.a003927. [DOI] [PubMed] [Google Scholar]
- 34.Posada D, Crandall KA. Evaluation of methods for detecting recombination from DNA sequences: Computer simulations. Proc Natl Acad Sci USA. 2001;98:13757–13762. doi: 10.1073/pnas.241370698. [DOI] [PMC free article] [PubMed] [Google Scholar]
- 35.Wiuf C, Christensen T, Hein J. A simulation study of the reliability of recombination detection methods. Mol Biol Evol. 2001;18:1929–1939. doi: 10.1093/oxfordjournals.molbev.a003733. [DOI] [PubMed] [Google Scholar]
- 36.Posada D. On the performance of methods for detecting recombination from DNA sequences: Real data. Mol Biol Evol. 2002;19:708–717. doi: 10.1093/oxfordjournals.molbev.a004129. [DOI] [PubMed] [Google Scholar]
- 37.Weiller GF. Phylogenetic profiles: A graphical method for detecting genetic recombinations in homologous sequences. Mol Biol Evol. 1998;15(3):326–335. doi: 10.1093/oxfordjournals.molbev.a025929. [DOI] [PubMed] [Google Scholar]
- 38.Sawyer S. Statistical tests for detecting gene conversion. Mol Biol Evol. 1989;6:526–538. doi: 10.1093/oxfordjournals.molbev.a040567. [DOI] [PubMed] [Google Scholar]
- 39.Milne I, Wright F, Rowe G, Marshall DF, Husmeier D, McGuire G. TOPALi: Software for automatic identification of recombinant sequences within DNA multiple alignments. Bioinformatics. 2004;20:1806–1807. doi: 10.1093/bioinformatics/bth155. [DOI] [PubMed] [Google Scholar]
- 40.Martin DP, Williamson C, Posada D. RDP2: Recombination detection and analysis from sequence alignments. Bioinformatics. 2005;21:260–262. doi: 10.1093/bioinformatics/bth490. [DOI] [PubMed] [Google Scholar]
- 41.McVean G, Awadalla P, Fearnhead P. A coalescent-based method for detecting and estimating recombination from gene sequences. Genetics. 2002;160:1231–1241. doi: 10.1093/genetics/160.3.1231. [DOI] [PMC free article] [PubMed] [Google Scholar]
- 42.Watterson GA. On the number of segregating sites in genetical models without recombination. Theor Pop Biol. 1975;7:256–276. doi: 10.1016/0040-5809(75)90020-9. [DOI] [PubMed] [Google Scholar]
- 43.Fu Y-X, Li W-H. Maximum likelihood estimation of population parameters. Genetics. 1993;134:1261–1270. doi: 10.1093/genetics/134.4.1261. [DOI] [PMC free article] [PubMed] [Google Scholar]
- 44.Felsenstein J. Inferring Phylogenies. Sinauer Associates; Sunderland, MA: 2004. [Google Scholar]
- 45.Yang Z, Swanson WJ, Vacquier VD. Maximum likelihood analysis of molecular adaptation in abalone sperm lysin reveals variable selective pressures among lineages and sites. Mol Biol Evol. 2000;17:1446–1455. doi: 10.1093/oxfordjournals.molbev.a026245. [DOI] [PubMed] [Google Scholar]
- 46.Goldman N, Yang Z. A codon-based model of nucleotide substitution for protein-coding DNA sequences. Mol Biol Evol. 1994;11:725–736. doi: 10.1093/oxfordjournals.molbev.a040153. [DOI] [PubMed] [Google Scholar]
- 47.Nielsen R, Yang Z. Likelihood models for detecting positively selected amino acid sites and applications to the HIV-1 envelope gene. Genetics. 1998;148:929–936. doi: 10.1093/genetics/148.3.929. [DOI] [PMC free article] [PubMed] [Google Scholar]
- 48.Yang Z, Wong WSW, Nielsen R. Bayes empirical Bayes inference of amino acid sites under positive selection. Mol Biol Evol. 2005;22:1107–1118. doi: 10.1093/molbev/msi097. [DOI] [PubMed] [Google Scholar]
- 49.Yang Z. PAML: Phylogenetic Analysis by Maximum Likelihood. University College London; London: 2001. [Google Scholar]
- 50.Posada D, Crandall KA. Selecting models of nucleotide substitution: An application to human immunodeficiency virus 1 (HIV-1) Mol Biol Evol. 2001;18:897–906. doi: 10.1093/oxfordjournals.molbev.a003890. [DOI] [PubMed] [Google Scholar]
- 51.Anisimova M, Nielsen R, Yang Z. Effect of recombination on the accuracy of the likelihood method for detecting positive selection at amino acid sites. Genetics. 2003;164:1229–1236. doi: 10.1093/genetics/164.3.1229. [DOI] [PMC free article] [PubMed] [Google Scholar]
- 52.Pérez-Losada M, Browne EB, Madsen A, Wirth T, Viscidi RP, Crandall KA. Population genetics of microbial pathogens estimated from multilocus sequence typing (MLST) data. Infect Genet Evol. 2006;6:97–112. doi: 10.1016/j.meegid.2005.02.003. [DOI] [PMC free article] [PubMed] [Google Scholar]
- 53.Pérez-Losada M, Viscidi RP, Demma JC, Zenilman J, Crandall KA. Population genetics of Neisseria gonorrhoeae in a high-prevalence community using a hypervariable outer membrane porB and 13 slowly evolving housekeeping genes. Mol Biol Evol. 2005;22:1887–1902. doi: 10.1093/molbev/msi184. [DOI] [PubMed] [Google Scholar]
- 54.Wain-Hobson S, Renoux-Elbé C, Vartanian J-P, Meyerhans A. Network analysis of human and simian immunodeficiency virus sequence sets reveals massive recombination resulting in shorter pathways. J Gen Virol. 2003;84:885–895. doi: 10.1099/vir.0.18894-0. [DOI] [PubMed] [Google Scholar]
- 55.Hoelscher M, Kim B, Maboko L, et al. High proportion of unrelated HIV-1 intersubtype recombinants in the Mbeya region of southwest Tanzania. AIDS. 2001;15(12):1461–1470. doi: 10.1097/00002030-200108170-00002. [DOI] [PubMed] [Google Scholar]
- 56.Harris ME, Serwadda D, Sewankambo N, et al. Among 46 near full length HIV type 1 genome sequences from Rakai District, Uganda, subtype D and AD recombinants predominate. AIDS Res Hum Retroviruses. 2002;18(17):1281–1290. doi: 10.1089/088922202320886325. [DOI] [PubMed] [Google Scholar]
- 57.Dowling WE, Kim B, Mason CJ, et al. Forty-one near full-length HIV-1 sequences from Kenya reveal an epidemic of subtype A and A-containing recombinants. AIDS. 2002;16(13):1809–1820. doi: 10.1097/00002030-200209060-00015. Erratum in AIDS 2002;16(15):2104. [DOI] [PubMed] [Google Scholar]
- 58.Hudson RR. Gene genealogies and the coalescent process. In: Futuyma D, Antonovics J, editors. Oxford Surveys in Evolutionary Biology. Vol. 7. Oxford University Press; Oxford: 1990. pp. 23–36. [Google Scholar]