Abstract
The excitability of gonadotropin-releasing hormone (GnRH) neurons is essential for episodic neuropeptide release, but the mechanism by which electrical activity controls GnRH secretion is not well characterized. The role of phospholipase D (PLD) in mediating the activity-dependent secretory pathway was investigated in immortalized GT1 neurons, which both secrete GnRH and express GnRH receptors. Activation of these Ca2+-mobilizing receptors was associated with transient hyperpolarization of GT1 cells, followed by sustained firing of action potentials. This was accompanied by an increase in PLD activity, as indicated by elevated phosphatidylethanol (PEt) production. GnRH-induced PEt production was reduced by inhibition of phospholipase C-dependent phosphoinositide hydrolysis by U73122 and neomycin, suggesting that signaling from phospholipase C led to activation of PLD. The intermediate role of protein kinase C (PKC) in this process was indicated by the ability of phorbol 12-myristate 13-acetate to induce time- and dose-dependent increases in PEt and diacylglycerol, but not inositol trisphosphate, and by reduction of GnRH-induced PEt accumulation in PKC-depleted cells. Consistent with the role of action potential-driven Ca2+ entry in this process, agonist-induced PLD activity was also reduced by nifedipine and low extracellular Ca2+. Inhibition of the PLD pathway by ethanol and propranolol reduced diacylglycerol production and caused a concomitant fall in GnRH release. These data indicate that voltage-gated Ca2+ entry and PKC act in an independent but cooperative manner to regulate PLD activity, which contributes to the secretory response in GT1 cells. Thus, the electrical activity of the GnRH-secreting neuron participates in the functional coupling between GnRH receptors and PLD pathway.
The mammalian hypothalamus contains between 1000 and 3000 gonadotropin-releasing hormone (GnRH)-producing cells that are distributed within the preoptic area and/or the mediobasal hypothalamus (1). The GnRH neurons do not form a clearly defined nucleus, but operate in a synchronized manner to release pulses of GnRH into the hypothalamo-hypophyseal portal vessels (2, 3). The pulsatile mode of GnRH secretion is associated with episodic electrical activity of similar frequency within the hypothalamus and leads in turn to the intermittent release of gonadotropins from the pituitary gland into the systemic circulation (4, 5). Although the mechanisms underlying these phenomena are not well defined, the ability of immortalized GnRH neurons (GT1 cells) to release GnRH in an episodic manner indicates that pulsatile secretion is an intrinsic property of GnRH neurons (6–8). Since synchronization of the secretory activity of GT1 neurons is not externally driven, their pulsatile secretion could result from electrical coupling between the cells, synaptic coupling, or the action of nonsynaptic diffusible regulators, such as nitric oxide (9).
The dependence of episodic GnRH release from perifused hypothalamic cells and GT1 neurons on extracellular Ca2+ suggests that GnRH secretion is controlled by Ca2+ entry through plasma membrane Ca2+ channels (8). Electrophysiological measurements have demonstrated the expression of several types of plasma-membrane channels in GnRH neurons and GT1 cells, including transient and sustained voltage-sensitive Ca2+ channels (VSCCs; refs. 10 and 11). In addition, spontaneous and extracellular Ca2+-dependent electrical activity is associated with fluctuations in intracellular Ca2+ concentration ([Ca2+]i) in single GT1 cells (12). These cells also form synapse-like connections and gap junctions (7, 13, 14), features that are important for their electrical coupling to one another. Such interconnections may serve to coordinate and remodulate the electrical activities of the individual neurosecretory cells.
However, the morphological and electrophysiological characterization of GnRH neurons has not clarified the manner in which their intrinsic pacemaker activity, with a frequency of 1–5 spikes per min, leads to synchronized electrical and Ca2+ signaling and Ca2+-dependent secretion by the GnRH neuronal network, at a frequency of 1–2 spikes per h. The gating properties of plasma membrane channels themselves do not provide an explanation for this phenomenon. In other tissues, it has been proposed that G protein-coupled receptors can modulate the gating properties of plasma membrane channels. Both the direct effects of G proteins and those of diffusible second messengers have been implicated in these actions (15, 16). In accordance with this, we have observed that both GT1 neurons and primary cultures of hypothalamic cells express Ca2+-mobilizing GnRH receptors (17, 18). This finding could account for the results of secretory studies showing that GnRH release is inhibited by GnRH agonists and enhanced by GnRH antagonists (19–21). In GT1 neurons and primary cultures of hypothalamic cells, GnRH agonists exert both inhibitory and stimulatory actions on GnRH release, depending on their concentration and duration of action (17, 18). Thus, the expression of GnRH receptors in hypothalamic neurons may provide the basis for receptor-mediated modulation of electrical activity in the GnRH neuronal network.
Agonist-induced activation of phospholipase C (PLC) is recognized to be the major signal transduction pathway in cells that express GnRH receptors, and the consequent Ca2+ mobilization and activation of protein kinase C (PKC) are key elements in the control of hormone secretion by pituitary gonadotrophs (22–24). In these cells, GnRH receptors are also coupled to the phospholipase D (PLD) pathway during sustained agonist stimulation (25, 26). It has not been determined whether the GnRH receptors expressed in GT1 cells are coupled to PLD, and the role of PLC- and PLD-derived messengers in the control of GnRH release has not been explored. This report addresses the hypothesis that activation of GnRH receptors in GnRH neurons, like those in pituitary gonadotrophs, stimulates the PLC and PLD pathways and influences the electrical activity of these cells. The corollaries that PLD serves as an intracellular effector of VSCC and PLC pathways and that diacylglycerol (DAG) acts as a common messenger were also investigated. Our findings demonstrate that Ca2+ influx through VSCCs stimulates PLD activity and amplifies GnRH-induced activation of this enzyme. The data also suggest that the PLD pathway participates in the regulation of GnRH secretion.
MATERIALS AND METHODS
GT1 Cell Culture.
GT1-7 cells were grown in DMEM supplemented with 10% fetal bovine serum and gentamicin (100 μg/ml) as described (17). After reaching confluence, the cells were dissociated by trypsin treatment and plated in 35-mm Petri dishes or four-well dishes. Before stimulation, on the day 3 or 4 of culture and when the cells had reached 70–80% confluence, the cultures were serum-deprived by washing twice in DMEM.
[3H]Inositol Labeling and Stimulation of GT1 Cells.
On the third day of cell culture in 4-well plates, the medium was changed to inositol-free medium 199 with Hanks’ salt solution containing 5 μCi (1 Ci = 37 GBq) of myo[3H]inositol (Amersham) NaHCO3 (1.4 g/liter) and 1% fetal bovine serum. After 24 h of incubation, the cells were washed three times with inositol-free medium 199 containing 25 mM Hepes (pH 7.4) and 0.1% BSA and treated with 100 nM GnRH, 50 mM KCl, or 100 nM Bay K 8644 (RBI). The radioactivity incorporated into the individual or total inositol phosphates was determined as previously described (27).
DAG Assays.
Cells were cultured in 4-well plates for 2–3 days, and their medium was replaced by DMEM containing 0.1% BSA 4 h before experiments and again immediately before stimulation. Agents were added in 0.5 ml DMEM/0.1% BSA, and incubations were terminated by removing the medium and adding 0.5 ml of dry, ice-cold methanol. The methanolic cell suspension was transferred to 15-ml polypropylene tubes, and lipids were extracted by a modification of the method of Bligh and Dyer (28); DAG was assayed by a modification of the DAG kinase assay described by Preiss et al. (29). The DAG contents of the cell samples were determined from the log-logit transformation of the standard curve.
CDP-DAG Assay.
Cells were cultured in 4-well dishes for 2–3 days as described above, and [3H]CDP-DAG formation was measured by a modification of the method of Watson and Godfrey (30). Briefly, cells were incubated in 0.45 ml of DMEM containing 0.1% BSA at 37°C for 60 min with [3H]cytidine (DuPont/NEN), followed by addition of stimuli for up to 90 min. The reactions were stopped by removal of medium and addition of 0.5 ml of dry, ice-cold methanol. Cells were scraped from the plates, and lipids were extracted by vigorous vortexing with chloroform/methanol/water. After mixing with chloroform and water, the samples were centrifuged, and the lower phases were transferred into new tubes and washed with methanol. Aliquots of the lipid phases containing [3H]CDP-DAG were dried under nitrogen and analyzed by liquid scintillation spectrometry after dissolving in Econofluor-2 (DuPont/NEN).
Phosphatidylethanol (PEt) Assay.
For PEt measurements, the culture medium in 35-mm culture dishes was changed to 1.1 ml of DMEM containing 0.1% fatty acid-free BSA, l-glutamine, glucose (4.5 g/liter), NaHCO3 (1.4 g/liter), and 5 μCi of [3H]oleic acid (DuPont/NEN). After 16 h of incubation, stimuli were added to the culture dishes in the presence or absence of 0.5% ethanol for the indicated times. Treatments were terminated by placing the dishes on ice, followed by removal of the medium and rinsing the dishes with 1 ml of ice-cold saline. Dry, ice-cold methanol (1 μL) was then added and the cells were scraped. After extraction and separation as described (25), phosphatidic acid (PA) and PEt were visualized either by autoradiography, for which the TLC plates were treated with EN3HANCE spray (DuPont, /NEN), or by iodine vapor staining. The regions corresponding to the appropriate standards were scraped into scintillation vials and extracted with 1 ml of methanol-HCl (150:1); Hydroflour (9 ml; National Diagnostics) was added after the iodine stains were extinguished. Samples were kept at room temperature overnight, and their radioactivity was measured in a Beckman model LS 9000 liquid scintillation counter.
Electrophysiological Recording.
The perforated patch variation of the patch-clamp technique was used to measure Vm oscillations (31). Before each experiment, the culture medium was replaced with a solution containing: 140 mM NaCl, 4 mM KCl, 2.6 mM CaCl2, 1 mM MgCl2, 10 mM Hepes [4-(2-hydroxyethyl)-1-piperazineethane-sulfonic acid, sodium salt], and 8 mM glucose. The pH was adjusted to 7.36 using NaOH. Patch-clamp electrodes were made of soft capillary glass (Blu-Tip/Oxford) using a BB-CH-PC puller (Mecanex, Geneva), adjusted to obtain tip resistance between 2 and 4 mΩ. These electrodes were filled with a solution of the following composition: 70 mM potassium aspartate, 70 mM KCl, 3 mM MgCl2, and 10 mM Hepes, and pH was adjusted to 7.15. Nystatin was added from a stock solution to obtain a final concentration of 100–200 μg/ml. The electrode was mounted on the headstage of a EPC-7 amplifier (List Electronics, Darmstadt, Germany), and the tip resistance monitored by applying a 1mV square pulse of 10 ms at 10 Hz. Once a high-resistance seal (>5 gΩ) was formed between the electrode and the cell membrane, the access resistance was monitored until values of under 30 mΩ were reached. The holding current was set to zero, and GnRH was added directly to the extracellular solution.
Secretory Responses.
GnRH release was analyzed in GT1 cells cultured in 12-well plates. After washing the cells, basal and GnRH agonist [des-Gly10[d-Ala6]GnRH) N-ethylamide]-induced neuropeptide release was analyzed in cells bathed in selected concentrations of ethanol for 3 h. GnRH release was measured by radioimmunoassay (17), using 125I-labeled GnRH and a primary antiserum donated by V. D. Ramirez (University of Illinois, Urbana).
RESULTS
GnRH-Induced Activation of PLD.
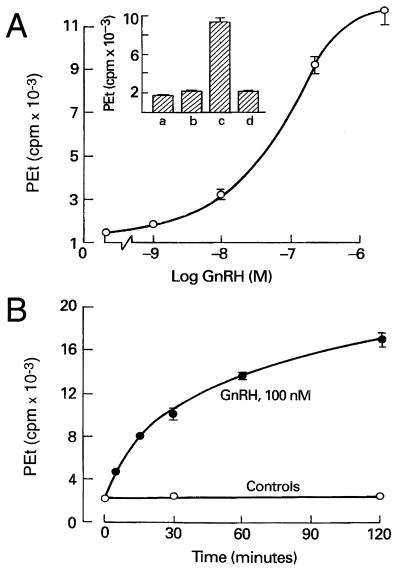
In the presence of ethanol, PLD catalyzes a transphosphatidylation mechanism that leads to the formation of PEt. This reaction is commonly used as a specific assay for PLD activity in agonist-stimulated cells (32, 33). In GT1 neurons, the coupling of GnRH receptors to PLD was indicated by a prominent increase in PEt production in GnRH-treated cells (Fig. 1). As shown in Fig. 1 Inset, the GnRH (10 nM)-induced PEt response (column c) was completely inhibited by the GnRH antagonist ([N-acetyl-d-p-Cl-Phe1,2,-Trp3, d-Lys6, d-Ala10]GnRH; 100 nM) (column d). Fig. 1A illustrates the concentration-dependence of GnRH action, with an estimated EC50 of 80 nM, and Fig. 1B shows its time course, with half-maximum response at 35 min. These findings demonstrate that GT1 neurons resemble other cell types expressing GnRH receptors in terms of their coupling to activation of the PLD pathway (25, 34, 35).
Figure 1.
GnRH-induced PEt production in GT1 neurons. (A) Concentration dependence of PEt accumulation in GnRH-stimulated cells. (Inset) Column a, basal PEt production; column b, lack of effect of a GnRH antagonist (100 nM) on PEt accumulation; column c, stimulation of PEt accumulation by GnRH (10 nM); and column d, inhibition of GnRH (10 nM) action by GnRH antagonist (100 nM). (B) Time course of GnRH-induced PEt formation. In this and the subsequent figures, results are shown as means ± SE of data from at least quadriplicate determinations.
PKC Dependence of PLD Activity.
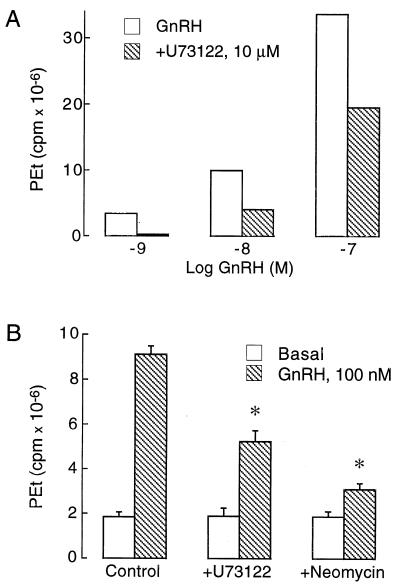
GnRH-induced PEt accumulation was significantly reduced in cells exposed to two inhibitors of phospholipid hydrolysis by PLC, U73122 and neomycin. Fig. 2A illustrates the effects of U73122 on GnRH (1–100 nM)-induced PEt accumulation in GT1 cells, and Fig. 2B shows the inhibition of GnRH-induced PEt responses by U73122 and neomycin. These data suggest that GnRH-induced activation of PLD is dependent on the PLC-controlled signal transduction pathway.
Figure 2.
Effects of PLC inhibitors on GnRH-induced PEt production in GT1 neurons. (A) Dose-dependent inhibition of PEt production by U73122. (B) Inhibitory actions of U73122 (10 μg) and neomycin (1.5 mM) on GnRH (100 nM)-induced PEt production. Cells were stimulated with GnRH for 90 min. U73122 and neomycin were added 5 min before GnRH.
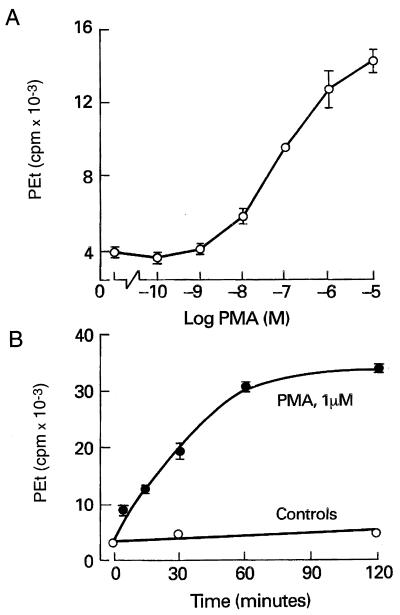
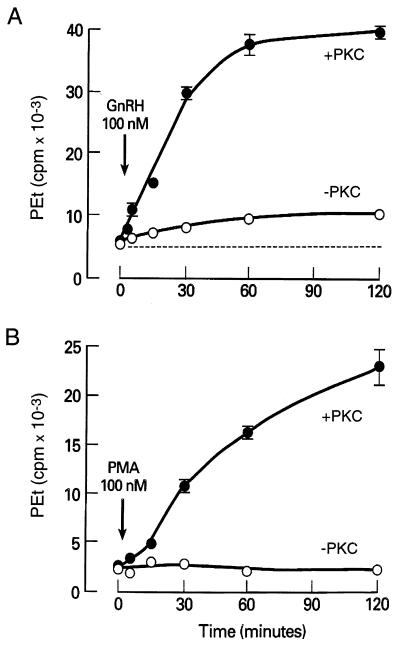
In several cell types, the integration of the PLD pathway into the PLC-dependent intracellular signaling cascade is mediated by PKC (36–38). In GT1 cells, activation of PKC by phorbol 12-myristate 13-acetate (PMA) mimicked the action of GnRH on PEt production in a concentration- (Fig. 3A) and time-dependent manner (Fig. 3B). However, PMA (100 nM for 15 min) did not induce Ca2+ mobilization in GT1 cells (bathed in Ca2+-deficient medium) over an interval sufficient to activate PLD [[Ca2+]i in PMA (100 nM)-treated cells = 184 ± 13 nM vs. control = 191 ± 15 nM; n = 14]. When GT1 neurons were depleted of PKC by exposure to 1 μM PMA for 6 h at 37°C, followed by a recovery period of 12 h, PMA-induced PEt accumulation was abolished (Fig. 4B) and GnRH-induced accumulation was markedly impaired. As shown in Fig. 4A, the agonist-induced PEt response represented ≈15% of the total accumulation observed in PKC-replete cells. These observations indicate that the stimulatory action of PKC on PLD activity is not secondary to its activation of PLC and that PKC-dependent and -independent pathways participate in GnRH-induced activation of PLD.
Figure 3.
Phorbol ester-induced PEt accumulation in GT1 neurons. (A) Concentration dependence of PEt accumulation in PMA-stimulated cells. (B) Time course of PMA action.
Figure 4.
Role of PKC in PLD activation. (A) GnRH-induced PEt formation was reduced but not abolished in PKC-depleted cells. (B) PKC dependence of PMA-induced PEt formation. +PKC, PKC-replete cells; −PKC, PKC-depleted cells.
Voltage-Gated Ca2+ Entry and PLD Activation.
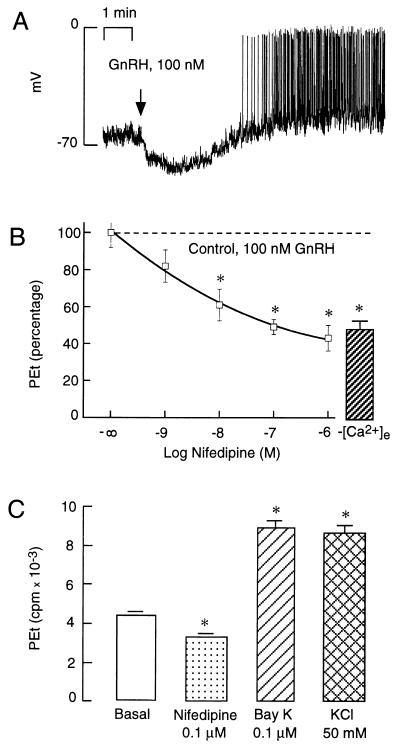
In GT1 cells, the initial phase of Ca2+ mobilization induced by GnRH is not affected by removal of extracellular Ca2+, whereas the concomitant and sustained increase in Ca2+ influx is abolished (17). Fig. 5A illustrates that GnRH-induced Ca2+ mobilization was associated with hyperpolarization of the plasma membrane, presumably due to activation of Ca2+-controlled potassium channels. The hyperpolarization was transient and was followed by depolarization and firing of action potentials with a frequency of 10–30 spikes per min. Thus, the sustained extracellular Ca2+-dependent phase of the [Ca2+]i response coincides with the phase of firing of action potentials.
Figure 5.
Role of voltage-sensitive Ca2+ channels in PLD activation. (A) Plasma membrane potential record from a single GT1 cell during sustained agonist stimulation. GnRH was added at the time indicated by the arrow. (B) Extracellular Ca2+ dependence of GnRH-induced PEt accumulation. Cells were bathed in 1.25 mM Ca2+ in the presence of nifedipine or in calcium-deficient medium ([Ca2+]e). (C) Effects of Bay K 8644, nifedipine, and K+-induced depolarization on PEt accumulation in GT1 cells. ∗, P < 0.05, vs. basal (B) and GnRH-treated (A) cells.
In accordance with the role of action potential-driven Ca2+ entry on PLD activity, GnRH-induced PEt accumulation in cells bathed in Ca2+-deficient medium was reduced to ≈45% of that observed in cells stimulated in Ca2+-containing medium (Fig. 5B, column at right). Stimulation of PLD by GnRH was also reduced during blockade of VSCCs by nifedipine, with an IC50 of ≈10 nM (Fig. 5B, graph at left). Treatment with nifedipine reduced GnRH-induced PEt accumulation to the same extent as incubation in Ca2+-deficient medium, suggesting that Ca2+ entry through L-type Ca2+ channels is exclusively responsible for the stimulatory effects of GnRH on the PLD pathway. Furthermore, direct stimulation of Ca2+ influx through VSCCs by Bay K 8644 and K+-induced depolarization was also associated with significant increases in PEt accumulation (Fig. 5C). These rises in PEt production were not secondary to Ca2+-induced activation of PLC (and consequently of PKC), since treatment with Bay K 8644 did not increase inositol 1,4,5-trisphosphate (InsP3) production (basal = 772 ± 27 cpm; Bay 8644 (100 nM)-treated = 514 ± 17 cpm; and GnRH (100 nM)-treated = 2,428 ± 317 cpm). It is also unlikely that the autocrine activation of GnRH receptors by endogenous GnRH release is responsible for such an action of potassium and Bay K 8644, since GnRH receptor blockade with 100 nM [N-acetyl-d-p-Cl-Phe1,2, -Trp3, d-Lys6, d-Ala10]GnRH had no effect on basal PEt accumulation (Fig. 1 Inset). Furthermore, both Bay K 8644 and high extracellular K+ stimulated PEt accumulation in PKC-depleted cells [PKC-replete vs. PKC-depleted cells: K+ (50 mM), 2739 ± 72 cpm vs. 2758 ± 105 cpm; and Bay K 8644 (100 nM), 2673 ± 60 cpm vs. 2778 ± 204 cpm]. These observations demonstrate that Ca2+ influx through VSCCs is sufficient to activate PLD and that such activation does not depend on the PLC/PKC pathway.
The Role of PLD in GnRH Release.
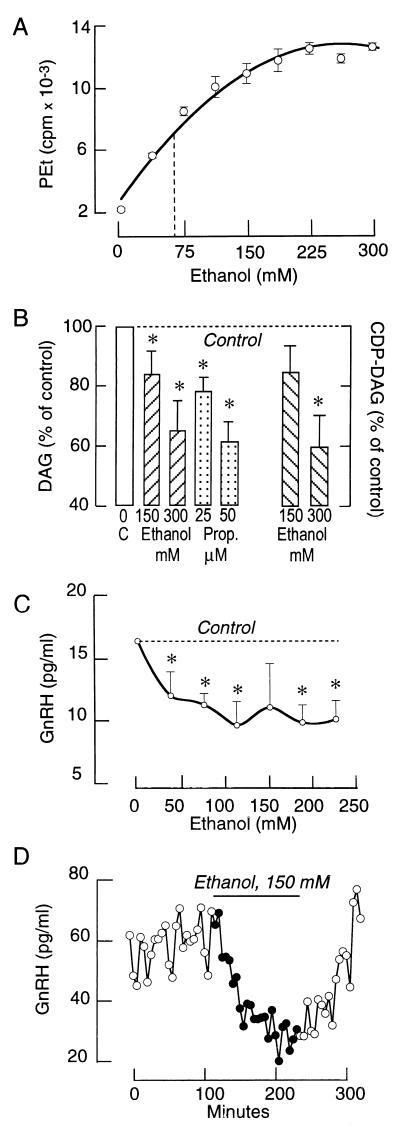
In many cell types, the PLD pathway provides an additional mechanism for the production of DAG during agonist stimulation (39). Furthermore, ethanol not only provides an index of PLD activity by acting as an acceptor during the transphosphatidylation reaction to form PEt, but it also competes with water during the hydrolysis of phosphatidylcholine. For this reason, ethanol inhibits PLD-dependent DAG production by reducing PA formation when present in sufficiently high concentrations (34). As shown in Fig. 6A, GnRH-induced PEt accumulation increased with rising ethanol concentration and plateaued at ≈200 mM. The production of PEt in GnRH-stimulated cells was associated with a marked decrease in the formation of PLD- but not PLC-dependent products of phospholipid hydrolysis. Thus, GnRH (100 nM)-stimulated DAG production was significantly reduced in the presence of 150 and 300 mM ethanol (Fig. 6B). The GnRH-induced accumulation of CDP-DAG was also reduced by ethanol. In contrast, the GnRH (100 nM)-induced [Ca2+]i response was not affected by ethanol, indicating that reduction of DAG production is not a consequence of inhibition of PLC (data not shown). To further evaluate the role of PA-phosphohydrolase in PLD-dependent signaling, GnRH-stimulated GT1 cells were treated with propranolol. In addition to acting as a β-adrenergic receptor antagonist, propranolol inhibits PA-phosphohydrolase activity at micromolar concentrations (40–42). In accord with this, GnRH-induced DAG production was substantially reduced in propranolol-treated cells (Fig. 6B).
Figure 6.
Effects of ethanol and propranolol on PEt, DAG, and CDP-DAG production and GnRH release in GT1 cells. (A) Concentration dependence of PEt accumulation in GnRH-stimulated cells. (B) Effects of ethanol and propranolol on GnRH-induced DAG formation. In both experiments, cells were stimulated with 100 nM GnRH for 15 min. (C) Concentration-dependent effects of ethanol on GnRH release from cultured GT1 cells. In this experiment, cells were exposed to ethanol for 120 min. (D) Effects of ethanol on pulsatile GnRH release from perifused GT1 cells. Cells were perifused at a flow rate of 0.15 ml/min and samples were collected every 5 min.
It is well established that GnRH secretion by hypothalamic tissue is significantly reduced by ethanol (43, 44), but the mechanism of this effect has not been determined. In static GT1 cell cultures, addition of ethanol was found to inhibit basal GnRH release in a concentration-dependent manner (Fig. 6C). An inhibitory effect of ethanol on GnRH release was also observed in perifused GTI cells. As shown in Fig. 6D, removal of ethanol led to a rapid and complete recovery of secretion. Furthermore, propranolol (50 μM for 2 h) had a similar effect on basal GnRH release (controls, 12.9 ± 1.7 pg/ml; and propranolol-treated, 7.4 ± 0.2 pg/ml). Such inhibitory effects of ethanol and propranolol on basal GnRH release were also observed in PKC-depleted cells (data not shown). These results indicate that the PLD pathway participates in the constitutive release of GnRH from GT1 cells and that this process is independent of PKC.
DISCUSSION
GnRH-secreting neurons have been found to express Ca2+-mobilizing receptors (including GnRH, α1-adrenergic, and endothelin receptors), adenylate cyclase-coupled receptors (including β-adrenergic and dopaminergic receptors), receptor tyrosine kinases (insulin-like growth factor, epidermal growth factor, fibroblast growth factor, and prolactin), receptor channels (N-methyl-d-aspartate, kainate, and γ-aminobutyric acid type A channels), and steroid hormone receptors (reviewed in refs. 45–48). In general, activation of these receptors in vivo and in vitro is associated with modulation of the frequency and/or amplitude of the pulses of GnRH release (8, 17, 49–51). Recent investigations have revealed that the nitric oxide/cGMP pathway is also operative in hypothalamic tissue and GT1 cells and modulates GnRH release in vitro (52–54). However, not all of the receptors and channels and the associated intracellular messengers that influence GnRH release are required for pulsatile GnRH secretion. Episodic GnRH release is preserved in vitro by hypothalamic tissue and cultured hypothalamic cells (55), suggesting that inputs from extra-hypothalamic neurons are not essential for the activity of the pulse generator. The ability of perifused GT1 neuronal cells to exhibit episodic GnRH release in the absence of other cell types suggests that GnRH neurons per se have the capacity for pulsatile neuropeptide secretion (6–8). Such episodes of GnRH release from perifused GT1 cells were abolished by removal of Ca2+ from the extracellular medium (8), and by blockade of voltage-sensitive Na+ and Ca2+ channels by tetrodotoxin and nifedipine (7, 8).
The ability of GnRH neurons to maintain a pulsatile secretory pattern in the absence of other cell types reduces the number of hypotheses for the mechanism(s) that synchronize the activity of GnRH neurons to three: electrical coupling, synaptic coupling, and diffusion of nonsynaptic mediators between the cells. The expression in GT1 cells of gap and synaptic junctions (13, 14), as well as GnRH receptors (17), provides a basis for either of the first two mechanisms in the synchronization of the secretory response. The inability of cultured hypothalamic cells and GT1 neurons to release GnRH in a pulsatile manner when bathed in nifedipine-containing or Ca2+-deficient medium (8) clearly indicates the dependence of neurosecretion on Ca2+ influx through VSCCs. On the other hand, the ability of GnRH analogs to induce activation of the PLC pathway and changes in the pattern of GnRH release in vivo and in vitro (17) supports the role of autocrine regulation in neuropeptide secretion.
These observations have raised several questions about the control of pulsatile GnRH secretion. Are both the electrical and PLC-dependent mechanisms required for pulsatile GnRH secretion, how are their activities synchronized, and which intracellular messenger(s) participate in their integration? This study has demonstrated that the calcium-mobilizing action of GnRH in GT1 cells is associated with prominent changes in the pattern of electrical activity and Ca2+ influx through VSCCs. It has also shown that PLD participates in the interactions between VSCC-mediated Ca2+ influx and GnRH receptor-activated intracellular signaling. In general, the coupling of electrical activity with intracellular Ca2+ signaling is possible without the activation of plasma membrane receptors. It is well established that increases in [Ca2+]i can activate PLC in certain cell types, and particularly in neurons (56). This raises the possibility that action potential-driven Ca2+ entry in GnRH neurons could stimulate PLC independently of activation of GnRH receptors. However, this does not occur in GT1 neurons, since Ca2+ influx stimulated by K+-induced depolarization and Bay K 8644 did not increase InsP3 production. On the other hand, the ability of such influx to increase PEt and DAG formation indicates that Ca2+ entry through voltage-gated channels per se is sufficient to activate the PLD pathway. This effect of Ca2+ influx was not abolished in neurons depleted of PKC, further suggesting that the action of Ca2+ is not mediated through a PKC-dependent pathway.
GnRH caused activation of the PLD pathway in GT1 neurons in a time- and concentration-dependent manner. In accordance with observations in other cell types (36, 37), PKC mediates the integration of the PLD pathway into the cascade of PLC-controlled intracellular signaling in GT1 neurons. However, while phorbol ester-induced activation of PLC was no longer demonstrable after depletion of PKC, the presence of PKC-independent PEt production in agonist-stimulated cells suggests that Ca2+ signaling also participates in the control of PLD activity. Consistent with this, the GnRH-induced PEt response was significantly reduced by nifedipine and in cells bathed in Ca2+-deficient medium. Under these conditions, the GnRH-induced InsP3 response was also reduced, suggesting that Ca2+ influx through VSCCs enhances the agonist-induced activation of PLC and PLD. Thus, Ca2+ entry resulting from the electrical activity of the GnRH neurons is sufficient to activate PLD and also facilitates agonist-induced activation of PLD.
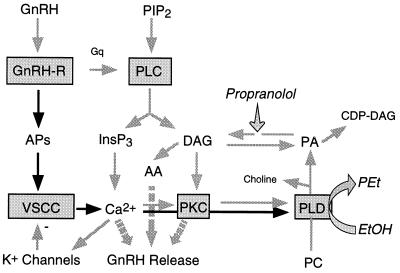
What is the physiological significance of VSCC- and receptor-controlled activation of PLD, and which products of its activation act as intracellular messengers? We have observed that formation of PEt at the expense of PA during agonist-induced activation of GT1 neurons in the presence of ethanol significantly reduces the production of DAG and CDP-DAG (Fig. 7). Also, inhibition of PA-phosphohydrolase activity by propranolol decreases DAG and increases PA and CDP-DAG. At the concentrations used in our experiments, ethanol also inhibits GnRH release in GT1 neurons, consistent with its effects in medial basal hypothalamic explants (43). Furthermore, the finding that GnRH secretion was also reduced in cells treated with propranolol indicates that DAG rather than PA or CDP-DAG is involved in the control of GnRH release.
Figure 7.
Mechanism of control of PLD activity by GnRH receptors. APs, action potentials; PC, phosphatidylcholine; and AA, arachidonic acid. The PA formed during hydrolysis of PC by PLD and the DAG produced during PLC-mediated hydrolysis of PIP2 are interconverted by the actions of DAG-kinase and PA-phosphohydrolase. Ethanol impairs the formation of PA at concentrations of 50–300 mM, and micromolar concentrations of propranolol inhibit the activity of PA-phosphohydrolase.
In cells in which agonist stimulation increases PLD activity, the DAG formed from PA could cause sustained and possibly selective activation of PKC isozymes (39). However, the finding that ethanol and propranolol can inhibit GnRH release in PKC-depleted cells indicates that a PKC-independent pathway to exocytosis is also affected by these compounds. One such pathway was suggested by the observation that inhibition of GnRH release by ethanol in hypothalamic tissue was associated with a reduction in arachidonic acid conversion to its active metabolites (43). Since PLD-dependent DAG production is also reduced in the presence of ethanol (34) and DAG contributes to arachidonic acid production (39), it is possible that impairment of the PLD pathway attenuates an arachidonic acid signaling cascade leading to activation of exocytosis (Fig. 7).
In summary, these results demonstrate that GnRH action in GT1 neurons is associated with activation not only of PLC but also of PLD, and also with changes in the pattern of electrical activity. The action of GnRH on PLD is mediated by PKC and Ca2+ influx through VSCCs. Thus, PLD serve as a common intracellular effector for PLC- and voltage-gated signaling pathways in GnRH neurons. The inhibitory actions of ethanol and propranolol on GnRH release suggests that the PLD pathway participates in pulsatile GnRH secretion. The results further indicate that DAG rather than PA is the major intracellular messenger in the PLD-dependent pathway in stimulus-secretion coupling. Finally, the present data suggest that inhibition of PLD activity could be the underlying mechanism of the well established inhibitory effect of ethanol on GnRH release from the hypothalamus.
Footnotes
Abbreviations: GnRH, gonadotropin-releasing hormone; VSCC, voltage-sensitive Ca2+ channel; PLC and PLD, phospholipase C and D, respectively; PKC, protein kinase C; DAG, diacylglycerol; PEt, phosphatidylethanol; PA, phosphatidic acid; PMA, phorbol 12-myristate 13-acetate; InsP3, inositol 1,4,5-trisphosphate.
References
- 1.Leranth C, Segura L M G, Palkovits M, MacLusky N J, Shanabrough M, Naftolin F. Brain Res. 1985;345:332–340. doi: 10.1016/0006-8993(85)91011-x. [DOI] [PubMed] [Google Scholar]
- 2.Clarke I J. Endocrinology. 1993;133:1624–1632. doi: 10.1210/endo.133.4.8404603. [DOI] [PubMed] [Google Scholar]
- 3.Wilson R C, Kesner J S, Kaufman J-M, Uemura T, Akema T, Knobil E. Neuroendocrinology. 1984;39:256–260. doi: 10.1159/000123988. [DOI] [PubMed] [Google Scholar]
- 4.Knobil E. Am J Obstet Gynecol. 1990;163:1721–1727. doi: 10.1016/0002-9378(90)91435-f. [DOI] [PubMed] [Google Scholar]
- 5.Kesner J S, Wilson R C, Kaufman J-M, Hotchkiss J, Chen Y, Yammamoto H, Pardo R R, Knobil E. Proc Natl Acad Sci USA. 1987;84:8745–8749. doi: 10.1073/pnas.84.23.8745. [DOI] [PMC free article] [PubMed] [Google Scholar]
- 6.Escalera G M, Choi A L H, Weiner R I. Proc Natl Acad Sci USA. 1992;89:1852–1855. doi: 10.1073/pnas.89.5.1852. [DOI] [PMC free article] [PubMed] [Google Scholar]
- 7.Wetsel W C, Valenca M M, Merchenthaler I, Liposits Z, Lopez F J, Weiner R I, Mellon P L, Negro-Vilar A. Proc Natl Acad Sci USA. 1992;89:4149–4153. doi: 10.1073/pnas.89.9.4149. [DOI] [PMC free article] [PubMed] [Google Scholar]
- 8.Krsmanovic L Z, Stojilkovic S S, Merelli F, Dufour S M, Virmani M A, Catt K J. Proc Natl Acad Sci USA. 1992;89:8462–8466. doi: 10.1073/pnas.89.18.8462. [DOI] [PMC free article] [PubMed] [Google Scholar]
- 9.Krsmanovic L Z, Stojilkovic S S, Catt K J. Trends Endocrinol Metab. 1996;7:56–59. doi: 10.1016/1043-2760(96)00007-0. [DOI] [PubMed] [Google Scholar]
- 10.Bosma M M. J Membr Biol. 1993;136:85–96. doi: 10.1007/BF00241492. [DOI] [PubMed] [Google Scholar]
- 11.Kusano K, Fueshko S, Gainer H, Wray S. Proc Natl Acad Sci USA. 1995;92:3918–3922. doi: 10.1073/pnas.92.9.3918. [DOI] [PMC free article] [PubMed] [Google Scholar]
- 12.Charles A C, Hales T G. J Neurophysiol. 1994;73:56–64. doi: 10.1152/jn.1995.73.1.56. [DOI] [PubMed] [Google Scholar]
- 13.Matesic D F, Germak J A, Dupont E, Madhukar B V. Neuroendocrinology. 1993;58:485–492. doi: 10.1159/000126581. [DOI] [PubMed] [Google Scholar]
- 14.Liposits Z, Merchenthaler I, Wetsel W C, Reid J J, Mellon P L, Weiner R I, Negro-Vilar A. Endocrinology. 1991;129:1575–1583. doi: 10.1210/endo-129-3-1575. [DOI] [PubMed] [Google Scholar]
- 15.Wickman K, Clapham D E. Physiol Rev. 1995;75:865–885. doi: 10.1152/physrev.1995.75.4.865. [DOI] [PubMed] [Google Scholar]
- 16.Hille B. Trends Neurosci. 1994;17:531–536. doi: 10.1016/0166-2236(94)90157-0. [DOI] [PubMed] [Google Scholar]
- 17.Krsmanovic L Z, Stojilkovic S S, Mertz L M, Tomic M, Catt K J. Proc Natl Acad Sci USA. 1993;90:3908–3912. doi: 10.1073/pnas.90.9.3908. [DOI] [PMC free article] [PubMed] [Google Scholar]
- 18.Krsmanovic L Z, Arora K K, Stojilkovic S S, Catt K J. 76th Annual Meeting Endocrine Society. Anaheim, CA: Endocr. Soc.; 1994. p. 120. [Google Scholar]
- 19.DeCastro J C B, Khorram O, McCann S M. Proc Soc Exp Biol Med. 1985;179:132–135. doi: 10.3181/00379727-179-1-rc2. [DOI] [PubMed] [Google Scholar]
- 20.Padmanabhan V, Evans N P, Dahl G E, McFadden K L, Mauger D T, Karsch F J. Neuroendocrinology. 1995;62:248–258. doi: 10.1159/000127011. [DOI] [PubMed] [Google Scholar]
- 21.Bourguignon J P, Gerard A, Franchimont P. Endocrinology. 1990;127:2884–2890. doi: 10.1210/endo-127-6-2884. [DOI] [PubMed] [Google Scholar]
- 22.Stojilkovic S S, Kukuljan M, Iida T, Rojas E, Catt K J. Proc Natl Acad Sci USA. 1992;89:4081–4085. doi: 10.1073/pnas.89.9.4081. [DOI] [PMC free article] [PubMed] [Google Scholar]
- 23.Tse A, Hille B. Science. 1992;255:462–464. doi: 10.1126/science.1734523. [DOI] [PubMed] [Google Scholar]
- 24.Jobin R M, Tomic M, Zheng L, Stojilkovic S S, Catt K J. Endocrinology. 1995;136:3398–3405. doi: 10.1210/endo.136.8.7628375. [DOI] [PubMed] [Google Scholar]
- 25.Zheng L, Stojilkovic S S, Hunyady L, Krsmanovic L Z, Catt K J. Endocrinology. 1994;134:1446–1454. doi: 10.1210/endo.134.3.8119185. [DOI] [PubMed] [Google Scholar]
- 26.Netiv E, Liscovitch M, Naor Z. FEBS Lett. 1991;295:107–109. doi: 10.1016/0014-5793(91)81396-p. [DOI] [PubMed] [Google Scholar]
- 27.Balla T, Sim S S, Baukal A J, Rhee S G, Catt K J. Mol Biol Cell. 1994;5:17–27. doi: 10.1091/mbc.5.1.17. [DOI] [PMC free article] [PubMed] [Google Scholar]
- 28.Bligh E G, Dyer W J. Can J Biochem Physiol. 1959;37:911–917. doi: 10.1139/o59-099. [DOI] [PubMed] [Google Scholar]
- 29.Preiss J, Loomis C R, Bishop W R, Stein R, Niedel J E, Bell R M. J Biol Chem. 1986;261:8597–8600. [PubMed] [Google Scholar]
- 30.Watson S P, Godfrey P P. Pharmacol Ther. 1988;38:387–417. doi: 10.1016/0163-7258(88)90011-3. [DOI] [PubMed] [Google Scholar]
- 31.Kukuljan M, Rojas E, Catt K J, Stojilkovic S S. J Biol Chem. 1994;269:4860–4865. [PubMed] [Google Scholar]
- 32.Liscovitch M. Biochem Soc Trans. 1991;19:402–407. doi: 10.1042/bst0190402. [DOI] [PubMed] [Google Scholar]
- 33.Billah M M, Anthes J C, Mullmann T J. Biochem Soc Trans. 1991;19:324–329. doi: 10.1042/bst0190324. [DOI] [PubMed] [Google Scholar]
- 34.Cesnjaj M, Zheng L, Catt K J, Stojilkovic S S. Mol Biol Cell. 1995;9:1037–1047. doi: 10.1091/mbc.6.8.1037. [DOI] [PMC free article] [PubMed] [Google Scholar]
- 35.Liscovitch M, Amsterdam A. J Biol Chem. 1989;264:11762–11767. [PubMed] [Google Scholar]
- 36.Eldar H, Ben-Av P, Schmidt U-S, Livneh E, Liscovitch M. J Biol Chem. 1993;268:12560–12564. [PubMed] [Google Scholar]
- 37.Balboa M A, Firestein B L, Godson C, Bell K S, Insel P A. J Biol Chem. 1994;269:10511–10516. [PubMed] [Google Scholar]
- 38.Conricode K M, Brewer K A, Exton J H. J Biol Chem. 1992;267:7199–7202. [PubMed] [Google Scholar]
- 39.Nishizuka Y. Science. 1992;258:607–614. doi: 10.1126/science.1411571. [DOI] [PubMed] [Google Scholar]
- 40.Billah M M, Eckel S, Mullmann T J, Egan R W, Siegel M I. J Biol Chem. 1989;264:17069–17077. [PubMed] [Google Scholar]
- 41.Lavie Y, Piterman O, Liscovitch M. FEBS Lett. 1990;277:7–10. doi: 10.1016/0014-5793(90)80796-l. [DOI] [PubMed] [Google Scholar]
- 42.Carnero A, Dolfi F, Lacal J C. J Cell Biochem. 1994;54:478–486. doi: 10.1002/jcb.240540415. [DOI] [PubMed] [Google Scholar]
- 43.Canteros G, Rettori V, Franchi A, Genaro A, Cebral E, Faletti A, Gimeno M, McCann S M. Proc Natl Acad Sci USA. 1994;92:3416–3420. doi: 10.1073/pnas.92.8.3416. [DOI] [PMC free article] [PubMed] [Google Scholar]
- 44.Hiney J K, Dees L. Endocrinology. 1991;128:1404–1408. doi: 10.1210/endo-128-3-1404. [DOI] [PubMed] [Google Scholar]
- 45.Ramirez V D, Pickle R L, Lin W W. J Steroid Biochem Mol Biol. 1991;40:143–154. doi: 10.1016/0960-0760(91)90177-7. [DOI] [PubMed] [Google Scholar]
- 46.Kalra S P. Endocr Rev. 1993;14:507–538. doi: 10.1210/edrv-14-5-507. [DOI] [PubMed] [Google Scholar]
- 47.Stojilkovic S S, Krsmanovic L Z, Spergel D J, Catt K J. Trends Endocrinol Metab. 1994;5:201–209. doi: 10.1016/1043-2760(94)90078-7. [DOI] [PubMed] [Google Scholar]
- 48.Terasawa E. Cell Mol Neurobiol. 1995;15:141–164. doi: 10.1007/BF02069563. [DOI] [PMC free article] [PubMed] [Google Scholar]
- 49.O’Byrne K T, Thalabard J C, Grosser P M, Wilson R C, Williams C L, Chen M D, Ladendorf D, Hotchkiss J, Knobil E. Endocrinology. 1991;129:1207–1214. doi: 10.1210/endo-129-3-1207. [DOI] [PubMed] [Google Scholar]
- 50.Mitsushima D, Hei D L, Terasawa E. Proc Natl Acad Sci USA. 1994;91:395–399. doi: 10.1073/pnas.91.1.395. [DOI] [PMC free article] [PubMed] [Google Scholar]
- 51.Ping L, Mahesh V B, Brann D W. Endocrinology. 1994;135:113–118. doi: 10.1210/endo.135.1.7912182. [DOI] [PubMed] [Google Scholar]
- 52.Moretto M, Lopez F J, Negro-Vilar A. Endocrinology. 1993;133:2399–2402. doi: 10.1210/endo.133.5.8104781. [DOI] [PubMed] [Google Scholar]
- 53.Bonavera J J, Sahu A, Kalra P S, Kalra S P. Endocrinology. 1993;133:2481–2487. doi: 10.1210/endo.133.6.8243268. [DOI] [PubMed] [Google Scholar]
- 54.Olcese J, Middendorff R, Munker M, Schmidt C, McArdle C A. J Neuroendocrinol. 1994;6:127–130. doi: 10.1111/j.1365-2826.1994.tb00562.x. [DOI] [PubMed] [Google Scholar]
- 55.Bourguignon J P, Franchimont P. Endocrinology. 1984;114:1941–1943. doi: 10.1210/endo-114-5-1941. [DOI] [PubMed] [Google Scholar]
- 56.Fisher S K. Eur J Pharmacol. 1995;288:231–250. doi: 10.1016/0922-4106(95)90035-7. [DOI] [PubMed] [Google Scholar]


