

Abstract
In the calculation of partial atomic charges, for use in molecular mechanics or dynamics simulations, it is common practice to select only a single conformation for the molecule of interest. For molecules that contain rotatable bonds, it is preferable to compute the charges from several relevant conformations. We present here results from a charge derivation protocol that determines the partial charges by averaging charges computed for conformations selected from explicitly solvated MD simulations, performed under periodic boundary conditions. This approach leads to partial charges that are weighted by a realistic population of conformations and that are suitable for condensed phase simulations. This protocol can, in principle, be applied to any class of molecule and to nonaqueous solvation. Carbohydrates contain numerous hydroxyl groups that exist in an ensemble of orientations in solution, and in this report we apply ensemble averaging to a series of methyl glycosides. We report the extent to which ensemble averaging leads to charge convergence among the various monosaccharides and among the constituent atoms within a given monosaccharide. Due to the large number of conformations (200) in our ensembles, we are able to compute statistically relevant standard deviations for the partial charges. An analysis of the standard deviations allows us to assess the extent to which equivalent atom types may, nevertheless, require unique partial charges. The configurations of the hydroxyl groups exert considerable influence on internal energies, and the limits of ensemble averaged charges are discussed in terms of these properties.
Keywords: AMBER, carbohydrate, partial charges, GLYCAM, molecular dynamics simulations
Introduction
In computing partial atomic charges for use in classical mechanics or dynamics simulations two issues immediately arise. First, the method for computing the charges must be selected from a large number of possible protocols. And second, the extent to which internal motions affect the computed charges must be established. Despite the importance of partial charges in modeling and in rationalizing electrostatic properties and reactivities of molecules and complexes, there is no unique protocol for determining the partial charge of an atom in a molecule. Partial charges are not experimentally observable; thus, they cannot be unambiguously determined by quantum mechanical methods. Consequently, one has to construct methods for determining partial charges that reproduce desirable molecular properties, such as, inter- and intramolecular energies.
There exist several different methods for deriving partial charges. Some of these methods are purely empirical, making use of experimental quantities (e.g., enthalpy of vaporization, density of liquids, or crystal properties),1 – 6 whereas many current methods employ quantum mechanics.
Mulliken population analysis,7 which involves a partitioning of overlap integral contributions equally between directly bonded atoms, is one of the oldest of the quantum-based methods. Although straightforward, the resultant charges from a Mulliken analysis have been shown to be highly basis set dependent, and are unsatisfactory for deriving electrostatic potentials and intermolecular interaction energies.8 Other partitioning protocols, which are less basis set dependent, include modifications to the Mulliken approach,9 as well as Löwdin population analysis10 and natural population analysis.11 Alternatives to arbitrarily partitioning the wave function between nuclei include the elegant approach proposed by Bader,12 which involves the direct computation of the electron density associated with each atom, using a critical point analysis to determine atomic boundaries.
Methods for computing partial charges, based on fitting to quantum mechanical molecular electrostatic potentials (ESPs), offer several advantages when applied to polar molecules. Although partial charges are a fictitious concept, ESPs are an experimental observable, and can be directly obtained from a quantum mechanical wavefunction. ESP charges (q) are derived by optimizing the fit (χ2esp) between the classical Coulomb model for the electrostatic potential (V̂) and the quantum mechanical molecular electrostatic potential (V) evaluated at points (i) around the molecule.
| (1) |
where
| (2) |
Because the ESP depends to some extent on basis set and theoretical level (HF, MP2, etc.), this approach does not entirely eliminate these issues. Further, ESP charges are sensitive to the number and location of the points used in sampling the molecular ESP.13, 14 Several methods for selecting the points around a molecule at which the ESPs are computed have been proposed, including the Merz–Kollman scheme,15 CHELP,16 and CHELPG13 and PDQP.14 A characteristic feature of ESP partial charges is that they are more sensitive to molecular conformation than are charges from methods based on partitioning of the wavefunction. The conformational dependency is reduced, but not eliminated even with a high sampling density of ESP points,14, 17, 18 suggesting that it is a genuine molecular property.
ESP charges are generally able to reproduce intermolecular interaction energies between polar molecules. Further, they lead to reasonable values for the energetics of hydrogen bond interactions, without the need to introduce additional interaction potentials. This is a considerable advantage over other methods. Nevertheless, ESP charges are recognized to lead to overestimation of intermolecular forces, bond polarities, and the dipole moments.19 While this behavior may be desirable for reproducing the bulk properties of condensed phase simulations of solvents, in which the effect of polarization is included approximately in the ESP charges, as Bayly et al. have noted,19 there is no reason to expect that the solute should be as polarized as the solvent. In cases where conformational properties depend on a delicate balance between solvent–solute and solute–solute interactions, ESP charges may inaccurately favor inter- over intramolecular interactions or vice versa. An example of such sensitivity to charge is found in solvated carbohydrates simulations, in which the conformations and dynamics are highly sensitive to the balance of forces between water–sugar and sugar–sugar interactions, both of which involve hydrogen bonds between hydroxyl groups.20
A refinement of the ESP method is offered by the restrained electrostatic potential (RESP) fit model.21 This method employs a hyperbolic restraint function during the least-squares fitting of the partial charges to the molecular ESP. The result is a set of partial charges of reduced magnitudes, which more accurately predict the strengths of short-range intermolecular interactions.6, 21 Although the magnitudes of the largest partial charges are reduced, the molecular dipole moments are unaffected, and thus, RESP charges maintain correct long-range behavior. A further advantage of the RESP approach is that it does not result in a nonintegral net charge for ionic molecules.
The issue of the influence of internal motion on computed charge has received considerably less attention than has the choice of protocol for computing charges. For essentially rigid molecules the choice of molecular conformation is trivial; however, for molecules that contain rotatable bonds it is not always straightforward to compute a set of partial atomic charges that reasonably represents each conformation, or even the average conformation. Computing the charges from a representative ensemble of structures, followed by charge averaging (ensemble averaging) is a logical approach. For molecules that exist in the gas-phase it is possible to select the conformers from quantum mechanical calculations and weight the individual contribution for a given conformer by its Boltzman population. This may even extend to flexible molecules whose conformational populations are not solvent dependent.22 Boltzman-weighted ESP charges have been shown to give improved free energies in simulations of alcohols in water and carbon tetra-chloride, compared to ESP charges from a single conformation.23
However, when the conformational distribution is highly solvent dependant, Boltzman weighting based on the gas-phase conformational energies is a poor approximation. Molecules that fall into this last category include polar molecules, such as many biomolecules and particularly carbohydrates.
The high number of rotatable bonds in carbohydrates, associated with hydroxyl and hydroxymethyl groups, makes it difficult to determine a representative ensemble of conformations. Moreover, in carbohydrates, the gas-phase conformational energies are dominated by the formation of internal hydrogen bonds between hydroxyl groups. The persistence of such hydrogen bonds in solution is unknown, but it is reasonable to suppose that water molecules disrupt, if not destroy, these internal interactions. Consequently, we believe that Boltzman averaging based on gas-phase conformational energies is inappropriate.
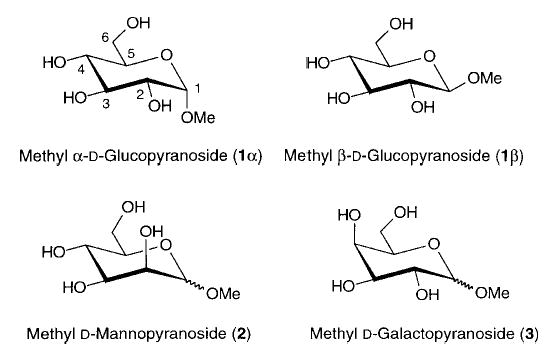
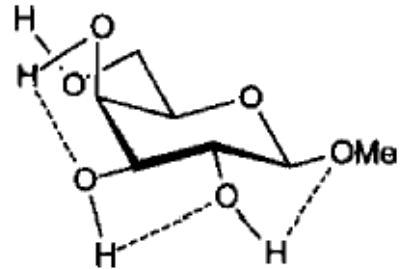
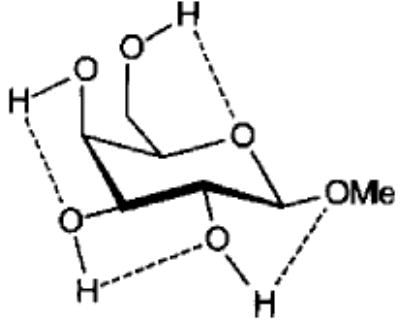
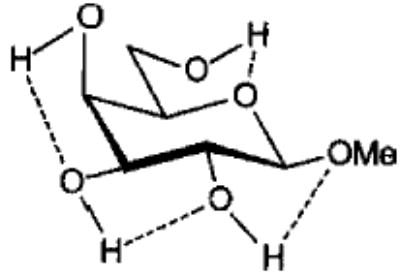
In this article we present a practical protocol for deriving a set of partial charges for use in solvated simulations of carbohydrates. By computing the partial charges from an ensemble of conformations extracted from solvated molecular dynamics (MD) simulations it is possible to satisfy the need for the charge set to represent the average behavior of the molecule in solution. We report here ensemble-averaged (EA) ESP, RESP, and Mulliken charges, all computed at the HF/6-31G* level, for each anomer of three common methyl glycosides (see Scheme 1).
SCHEME 1.
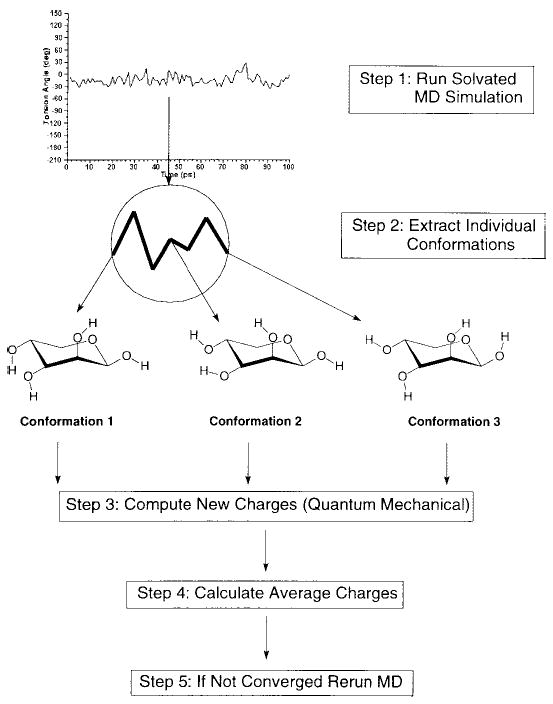
The approach outlined in Scheme 2 has the clear benefit that the weighting of the conformations is a direct outcome of the statistical populations of the conformers in solution. Nonetheless, issues of sensitivity to conformation and configuration, charge variation as a function of atom type, and the dependency of the resultant charges on the initial charge set employed in the simulations, must be considered. Similarities and differences between the glycosides and between the α-and β-anomers of each are discussed with regard to the effect of EA charges on the relative conformational energies for low energy conformations. Due to the large number of conformations in our ensembles (200), we are able to compute statistically relevant standard deviations for the partial charges. An analysis of the standard deviations allows us to determine the extent to which the charges show conformational and configurational dependency as well as the extent to which equivalent atom types may nevertheless require unique partial charges.
SCHEME 2.
Computational Details
All quantum mechanical calculations were performed with the Gaussian94 program.24 Electrostatic potentials were computed at the Hartree–Fock (HF) level with the 6-31G* basis set, at points around the solvent accessible surface of the molecules as determined using the CHELPG13 protocol. All molecular dynamics (MD) simulations were performed with the SANDER module of the AMBER 5.0 program25 using the all-atom GLYCAM parameter set for oligosaccharides and glycoproteins.26 All calculations were performed on a Silicon Graphics R10000 Octane computer.
The initial conformations of the methyl pyranosides was obtained from neutron diffraction data retrieved from the Cambridge Crystallographic Database.27 The initial partial charges for the solute were computed from the crystal geometry. In a typical simulation, the methyl glycoside was solvated by 270 TIP3P water molecules in a theoretical box with approximate dimensions 23 × 23 × 20 Å. This starting configuration was subjected to 1800 cycles of steepest decent energy minimization followed by 200 cycles of conjugate gradient minimization. All minimization and MD simulations used a dielectric constant of unity and a cutoff distance of 8 Å for solute–solvent interactions, while no cutoff was employed within the solute. Following standard practice with AMBER, all 1–4 electrostatic and van der Waals interactions were scaled by 0.83 and 0.5, respectively. The MD simulations were performed under periodic boundary conditions. The system was coupled to an external temperature bath at 298 K and to a pressure bath at 1 atm. Initial velocities were assigned from a Maxwellian distribution at 5 K. All the bonds involving hydrogen atoms were constrained to their equilibrium values using the SHAKE option, consistent with the use of the TIP3P water model. After equilibration for 50 ps the simulations were run for an additional 1000 ps, using an integration time step of 2 fs.
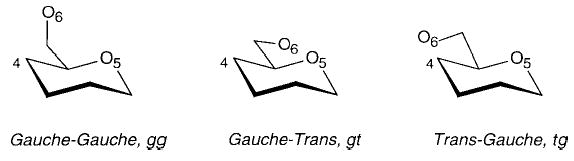
Over the time course of these simulations, it was impossible to obtain sufficient conformational sampling of the rotameric distributions of the C5–C6 bonds to generate populations that were in good agreement with the established experimental values for methyl d-gluco-, d-galacto-, and d-mannopyranoside.28 We have recently found that a simulational time of 20–50 ns is required to correctly determine these rotational distributions.20 Thus, during the MD simulations, rotation about the C5–C6 bond was constrained to yield the correct ratio of the three possible rotamers, termed gg (gauche–gauche), gt (gauche–trans), and tg (trans–gauche).
These terms describe the orientation of O6 relative to the O5 and C4 positions, for example, in the tg conformation, O6 is trans to O5 and gauche to C4 (see Scheme 3). Experimental NMR studies employing stereospecifically deuterated glycosides28 showed that for gluco- and mannopyranosides the gg and gt rotamers were dominant in solution, in nearly equal populations. Thus, charge averaging for the gluco- and mannopyranosides was performed on 200 solute conformations (100 for each of the gg and gt rotamers of each anomer) that were collected from the MD trajectories at 10 ps intervals. All three rotamers are reported to exist in galactopyranosides in solution, in a gt:tg:gg ratio of approximately 60:25:15.28 and for the galactopyranosides, 120, 50, and 30 conformations were selected, respectively, for the gt, tg, and gg rotamers of each anomer.
SCHEME 3.
The ESP charges are sensitive not only to the orientation of rotatable bonds, but also to variations in bond length and valence angle. To isolate the variation associated with hydroxyl and hydroxymethyl group orientations from that arising from other sources, we elected to compute the partial charges, not for each snapshot as taken directly from the MD simulation, but for a geometry-optimized conformation. A quantum mechanical geometry optimization was performed once for each glycoside, at the HF/6-31G* level. Thereafter, the dihedral angles defining the rotatable bonds were replaced by those extracted from the MD simulations. Full optimization was not performed, as it would have resulted in alteration of the orientation of the rotatable bonds, and would have led to conformations exhibiting only internal hydrogen bonds.
Partial charges were then computed for each conformation and arithmetically averaged for each sugar as discussed in the text. Restrained electrostatic potential (RESP) charges were derived using a restraint value of 0.01. We have shown recently that this restraint weight achieves satisfactory results in condensed-phase simulations of carbohydrates.6
Results and Discussion
CONFORMATIONAL SENSITIVITY
Ensemble averaging provides a mechanism to compute not only the average charge on an atom, but also the standard deviation in that charge. This latter quantity is a very useful measurement of the sensitivity of the charge to conformational variation. The differences in the average charges between carbon atoms in equivalent positions in other glycosides provide complimentary insight into the effects of atomic configuration. Lastly, using the standard deviations as an error estimate, it is possible to assess the extent to which related atom types are actually distinct from one another, in terms of their partial charge.
The EA-ESP and EA-RESP charges for the methyl pyranosides are presented in Tables I and II. The general trends in the values of the partial charges are in agreement with those previously reported from calculations performed on single conformations.6 As expected, the most positive atoms are the hydroxyl protons, whereas aliphatic protons carry the least positive charges. The most negative atoms are the hydroxyl oxygens. The ring oxygen (O5) and the anomeric oxygen (O1) atoms are less negative than the hydroxyl oxygen atoms. These trends are independent of the glycosides studied. The relative ordering of the charges on the ring carbon atoms are almost the same for all three sugars, differing only slightly from methyl glucopyranoside at the epimeric sites (C2 for methyl mannopyranoside, C4 for methyl galactopyranoside).
TABLE I.
EA-ESP Charges (a.u.) for the α- and β-Anomers of 1–3.
| Atom | 1α | 1β | 2α | 2β | 3α | 3β | 〈overall〉 |
|---|---|---|---|---|---|---|---|
| C1 | 0.28 (0.17)a | 0.48 (0.16) | 0.45 (0.11) | 0.36 (0.15) | 0.36 (0.17) | 0.49 (0.14) | 0.40 (0.15) |
| C2 | 0.16 (0.11) | 0.09 (0.11) | 0.07 (0.12) | 0.03 (0.13) | 0.22 (0.11) | 0.15 (0.10) | 0.12 (0.11) |
| C3 | 0.39 (0.13) | 0.40 (0.12) | 0.41 (0.12) | 0.41 (0.11) | 0.44 (0.13) | 0.42 (0.11) | 0.41 (0.12) |
| C4 | 0.22 (0.14) | 0.21 (0.14) | 0.27 (0.14) | 0.32 (0.14) | 0.06 (0.16) | 0.12 (0.12) | 0.20 (0.14) |
| C5 | 0.17 (0.16) | 0.12 (0.15) | 0.24 (0.16) | 0.09 (0.17) | 0.23 (0.16) | 0.12 (0.12) | 0.16 (0.15) |
| C6 | 0.37 (0.10) | 0.42 (0.10) | 0.28 (0.10) | 0.31 (0.12) | 0.36 (0.10) | 0.41 (0.08) | 0.36 (0.10) |
| Cme | 0.12 (0.04) | 0.13 (0.04) | 0.18 (0.04) | 0.10 (0.03) | 0.11 (0.03) | 0.15 (0.03) | 0.13 (0.03) |
| O1 | −0.41 (0.04) | −0.44 (0.03) | −0.52 (0.03) | −0.40 (0.03) | −0.42 (0.03) | −0.46 (0.03) | −0.44 (0.03) |
| O2 | −0.67 (0.03) | −0.69 (0.03) | −0.70 (0.02) | −0.66 (0.02) | −0.71 (0.02) | −0.70 (0.02) | −0.69 (0.02) |
| O3 | −0.73 (0.03) | −0.73 (0.03) | −0.76 (0.02) | −0.74 (0.02) | −0.75 (0.03) | −0.72 (0.03) | −0.74 (0.03) |
| O4 | −0.71 (0.03) | −0.73 (0.03) | −0.75 (0.03) | −0.74 (0.03) | −0.68 (0.04) | −0.70 (0.03) | −0.72 (0.03) |
| O5 | −0.53 (0.08) | −0.51 (0.08) | −0.52 (0.05) | −0.39 (0.07) | −0.54 (0.07) | −0.46 (0.06) | −0.49 (0.07) |
| O6 | −0.71 (0.03) | −0.73 (0.03) | −0.70 (0.03) | −0.71 (0.04) | −0.73 (0.03) | −0.73 (0.03) | −0.72 (0.03) |
| H1 | 0.10 (0.03) | 0.02 (0.03) | 0.08 (0.03) | 0.01 (0.04) | 0.07 (0.03) | 0.01 (0.03) | 0.05 (0.03) |
| H2 | 0.06 (0.03) | 0.06 (0.02) | 0.05 (0.02) | 0.07 (0.02) | 0.05 (0.03) | 0.07 (0.02) | 0.06 (0.02) |
| H3 | −0.01 (0.03) | −0.01 (0.02) | −0.01 (0.02) | −0.02 (0.02) | −0.03 (0.03) | −0.04 (0.03) | −0.02 (0.03) |
| H4 | 0.03 (0.03) | 0.03 (0.03) | 0.03 (0.03) | 0.02 (0.03) | 0.05 (0.03) | 0.05 (0.02) | 0.04 (0.03) |
| H5 | 0.04 (0.03) | 0.02 (0.03) | 0.03 (0.03) | 0.03 (0.03) | −0.01 (0.04) | −0.01 (0.03) | 0.02 (0.03) |
| H61 | −0.01 (0.04) | −0.02 (0.03) | 0.01 (0.03) | 0.01 (0.05) | 0.01 (0.04) | −0.01 (0.03) | 0.00 (0.04) |
| H62 | −0.01 (0.04) | −0.01 (0.04) | 0.01 (0.04) | 0.01 (0.04) | −0.01 (0.04) | −0.02 (0.03) | −0.01 (0.04) |
| Hmeb | 0.04 (0.01) | 0.03 (0.01) | 0.02 (0.02) | 0.04 (0.01) | 0.04 (0.01) | 0.03 (0.01) | 0.04 (0.01) |
| HO2 | 0.42 (0.03) | 0.45 (0.02) | 0.46 (0.02) | 0.45 (0.02) | 0.43 (0.02) | 0.44 (0.02) | 0.44 (0.02) |
| HO3 | 0.44 (0.02) | 0.44 (0.03) | 0.45 (0.02) | 0.45 (0.02) | 0.45 (0.02) | 0.44 (0.03) | 0.45 (0.02) |
| HO4 | 0.44 (0.03) | 0.45 (0.03) | 0.45 (0.02) | 0.44 (0.02) | 0.45 (0.03) | 0.46 (0.03) | 0.45 (0.03) |
| HO6 | 0.43 (0.02) | 0.44 (0.02) | 0.43 (0.02) | 0.44 (0.02) | 0.44 (0.02) | 0.44 (0.02) | 0.44 (0.02) |
Standard deviations in parenthesses.
Average value for the methyl hydrogen atoms.
TABLE II.
EA-RESP Charges (a.u.) for the α- and β-Anomers of 1–3.
| Atom | 1α | 1β | 2α | 2β | 3α | 3β | 〈overall〉 |
|---|---|---|---|---|---|---|---|
| C1 | 0.08 (0.07)a | 0.16 (0.10) | 0.13 (0.06) | 0.09 (0.06) | 0.11 (0.08) | 0.17 (0.08) | 0.12 (0.07) |
| C2 | 0.13 (0.04) | 0.09 (0.05) | 0.12 (0.05) | 0.06 (0.05) | 0.17 (0.06) | 0.13 (0.05) | 0.12 (0.05) |
| C3 | 0.21 (0.10) | 0.21 (0.07) | 0.20 (0.07) | 0.22 (0.07) | 0.25 (0.08) | 0.22 (0.07) | 0.22 (0.08) |
| C4 | 0.16 (0.10) | 0.16 (0.08) | 0.21 (0.08) | 0.21 (0.08) | 0.08 (0.06) | 0.12 (0.06) | 0.16 (0.08) |
| C5 | 0.08 (0.06) | 0.07 (0.06) | 0.10 (0.07) | 0.04 (0.06) | 0.09 (0.06) | 0.06 (0.04) | 0.07 (0.06) |
| C6 | 0.24 (0.08) | 0.26 (0.07) | 0.17 (0.07) | 0.18 (0.11) | 0.23 (0.08) | 0.25 (0.07) | 0.22 (0.08) |
| Cme | 0.03 (0.02) | 0.05 (0.02) | 0.06 (0.02) | 0.04 (0.01) | 0.02 (0.01) | 0.06 (0.02) | 0.04 (0.02) |
| O1 | −0.32 (0.02) | −0.34 (0.02) | −0.40 (0.02) | −0.31 (0.02) | −0.32 (0.02) | −0.35 (0.02) | −0.34 (0.02) |
| O2 | −0.63 (0.02) | −0.64 (0.02) | −0.66 (0.02) | −0.62 (0.02) | −0.65 (0.02) | −0.65 (0.02) | −0.64 (0.02) |
| O3 | −0.67 (0.02) | −0.66 (0.02) | −0.68 (0.02) | −0.68 (0.02) | −0.67 (0.02) | −0.65 (0.02) | −0.67 (0.02) |
| O4 | −0.66 (0.02) | −0.68 (0.03) | −0.70 (0.02) | −0.68 (0.02) | −0.62 (0.04) | −0.64 (0.03) | −0.66 (0.03) |
| O5 | −0.40 (0.04) | −0.36 (0.06) | −0.36 (0.03) | −0.26 (0.05) | −0.39 (0.04) | −0.31 (0.04) | −0.35 (0.04) |
| O6 | −0.67 (0.03) | −0.68 (0.02) | −0.66 (0.02) | −0.67 (0.04) | −0.68 (0.02) | −0.67 (0.02) | −0.67 (0.03) |
| H1 | 0.15 (0.01) | 0.11 (0.02) | 0.15 (0.02) | 0.08 (0.02) | 0.14 (0.02) | 0.10 (0.02) | 0.12 (0.02) |
| H2 | 0.10 (0.03) | 0.10 (0.02) | 0.08 (0.02) | 0.10 (0.02) | 0.11 (0.03) | 0.12 (0.03) | 0.10 (0.02) |
| H3 | 0.06 (0.03) | 0.07 (0.03) | 0.07 (0.03) | 0.06 (0.03) | 0.05 (0.03) | 0.04 (0.03) | 0.06 (0.03) |
| H4 | 0.08 (0.03) | 0.08 (0.03) | 0.09 (0.03) | 0.09 (0.03) | 0.07 (0.02) | 0.07 (0.02) | 0.08 (0.03) |
| H5 | 0.09 (0.03) | 0.06 (0.02) | 0.10 (0.02) | 0.07 (0.02) | 0.06 (0.02) | 0.03 (0.01) | 0.07 (0.02) |
| H61 | 0.03 (0.04) | 0.02 (0.03) | 0.04 (0.03) | 0.04 (0.04) | 0.05 (0.03) | 0.04 (0.03) | 0.04 (0.03) |
| H62 | 0.03 (0.04) | 0.03 (0.03) | 0.05 (0.04) | 0.04 (0.03) | 0.03 (0.04) | 0.02 (0.03) | 0.04 (0.03) |
| Hmeb | 0.06 (0.01) | 0.05 (0.01) | 0.05 (0.01) | 0.06 (0.01) | 0.06 (0.01) | 0.05 (0.01) | 0.06 (0.01) |
| HO2 | 0.41 (0.02) | 0.43 (0.02) | 0.44 (0.02) | 0.43 (0.02) | 0.43 (0.01) | 0.42 (0.02) | 0.43 (0.02) |
| HO3 | 0.43 (0.02) | 0.43 (0.02) | 0.43 (0.02) | 0.44 (0.02) | 0.43 (0.02) | 0.43 (0.02) | 0.43 (0.02) |
| HO4 | 0.43 (0.02) | 0.44 (0.02) | 0.44 (0.02) | 0.43 (0.02) | 0.43 (0.03) | 0.43 (0.02) | 0.43 (0.02) |
| HO6 | 0.42 (0.02) | 0.42 (0.02) | 0.42 (0.02) | 0.43 (0.02) | 0.42 (0.02) | 0.42 (0.02) | 0.42 (0.02) |
Standard deviations in parenthesses.
Average value for the methyl hydrogen atoms.
A benefit of the ensemble-averaging approach is that it permits the determination of the extent to which the charge on a given atom is sensitive to conformation. This sensitivity is reflected in the values for the standard deviations in the charges, also listed in Tables I and II. The charges on the ring carbon atoms have the highest standard deviations. The origin of this variability is threefold; certainly it reflects sensitivity to the hydroxyl group orientations. However, these atoms are also the furthest from the molecular surface, and are essentially nonpolar. These latter two properties result in difficulty in assigning partial charges to these atoms during the fitting procedure. We,14 and others,13 have shown that the variations in the charges on tetrahedral carbon atoms are extremely sensitive to factors such as grid point density and choice of van der Waals radii. In fact, the molecular electrostatic potential can be well reproduced without the need to include charges on all of the nonpolar atoms.29 The implication is that the high variability in the charges on the carbon atoms is an artifact of the fitting procedure. The large charge fluctuations on these atoms are compensated by smaller variations in the more polar atoms, and so have little or no impact on the molecular electrostatic potentials for the glycosides. However, the artificially high sensitivity of the carbon atom partial charges has a large effect on properties such as relative conformational energies (see discussion below).
As reported previously, the RESP methodology brings an improvement over the raw ESP derived charges, by lowering the magnitude of the charges. This is particularly evident for the ring carbon atoms for which the RESP charges are, on average, 40% smaller than the ESP charges. Although the conformational dependency of the RESP charges appeared to be less than for the ESP charges, the charges on the ring atoms continued to show the largest fluctuations. In contrast, the average RESP charges, for the oxygen and hydrogen atoms of the hydroxyl groups, were reduced by only 7 and 3%, respectively, from the ESP values.
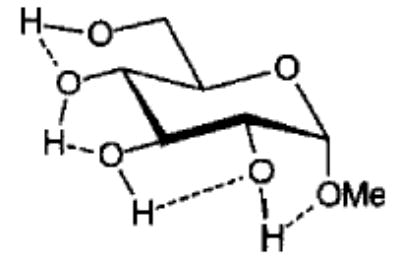
It is interesting to note that the charges on the hydroxyl groups show the lowest sensitivity to conformation (as evidenced by the small standard deviations), despite the fact that the hydroxyl hydrogen atoms undergo the largest changes in conformation. In fact, the only oxygen atom with significant fluctuations in charge is the ring oxygen atom, O5. It should be noted that throughout all the simulations the pyranosyl rings remained in the 1C4 conformations, as illustrated in Scheme 1.
An examination of the EA-Mulliken charges (see Table III) indicates that they are much less sensitive to conformation or configuration than either the EA-ESP or EA-RESP charges. The ring carbon atoms again display somewhat larger variations than do the other atoms; however, the largest variation is only approximately 0.03 a.u. Although many of the same general trends in the charges are present, certain differences between the Mulliken and the potential-fitted charges may be seen. With the exception of the anomeric center, the Mulliken partial charges on the aliphatic hydrogen atoms appear to be larger than those on the carbon atoms to which they are attached. This indicates a reversal of the bond dipoles relative to the ESP and RESP charges. This is most evident for the methyl and hydroxymethyl groups.
TABLE III.
EA-Mulliken Charges (a.u.) for the α- and β-Anomers of 1–3
| Atom | 1α | 1β | 2α | 2β | 3α | 3β | 〈overall〉 |
|---|---|---|---|---|---|---|---|
| C1 | 0.45 (0.01)a | 0.52 (0.02) | 0.47 (0.01) | 0.51 (0.04) | 0.44 (0.02) | 0.52 (0.02) | 0.48 (0.02) |
| C2 | 0.15 (0.02) | 0.13 (0.03) | 0.10 (0.03) | 0.10 (0.03) | 0.16 (0.03) | 0.12 (0.02) | 0.13 (0.03) |
| C3 | 0.12 (0.03) | 0.13 (0.03) | 0.13 (0.03) | 0.14 (0.03) | 0.13 (0.04) | 0.15 (0.03) | 0.13 (0.03) |
| C4 | 0.14 (0.03) | 0.14 (0.03) | 0.14 (0.03) | 0.14 (0.03) | 0.11 (0.03) | 0.12 (0.03) | 0.13 (0.03) |
| C5 | 0.11 (0.02) | 0.10 (0.02) | 0.12 (0.02) | 0.12 (0.03) | 0.11 (0.03) | 0.10 (0.03) | 0.11 (0.02) |
| C6 | 0.01 (0.02) | 0.02 (0.02) | 0.01 (0.02) | 0.01 (0.04) | 0.02 (0.03) | 0.02 (0.02) | 0.01 (0.02) |
| Cme | −0.18 (0.00) | −0.18 (0.00) | −0.18 (0.00) | −0.18 (0.02) | −0.18 (0.00) | −0.17 (0.01) | −0.18 (0.01) |
| O1 | −0.65 (0.01) | −0.64 (0.01) | −0.65 (0.00) | −0.64 (0.01) | −0.64 (0.02) | −0.63 (0.01) | −0.64 (0.01) |
| O2 | −0.76 (0.01) | −0.76 (0.01) | −0.75 (0.01) | −0.75 (0.02) | −0.76 (0.01) | −0.76 (0.02) | −0.76 (0.01) |
| O3 | −0.76 (0.01) | −0.76 (0.01) | −0.78 (0.01) | −0.77 (0.01) | −0.77 (0.01) | −0.76 (0.01) | −0.77 (0.01) |
| O4 | −0.76 (0.01) | −0.77 (0.01) | −0.76 (0.01) | −0.76 (0.01) | −0.77 (0.01) | −0.77 (0.01) | −0.77 (0.01) |
| O5 | −0.68 (0.01) | −0.68 (0.01) | −0.68 (0.01) | −0.67 (0.02) | −0.67 (0.01) | −0.67 (0.01) | −0.68 (0.01) |
| O6 | −0.74 (0.01) | −0.75 (0.01) | −0.75 (0.01) | −0.74 (0.02) | −0.76 (0.01) | −0.75 (0.01) | −0.75 (0.01) |
| H1 | 0.18 (0.01) | 0.14 (0.01) | 0.18 (0.01) | 0.13 (0.01) | 0.18 (0.01) | 0.13 (0.01) | 0.16 (0.01) |
| H2 | 0.18 (0.02) | 0.18 (0.01) | 0.18 (0.01) | 0.18 (0.02) | 0.19 (0.02) | 0.20 (0.02) | 0.19 (0.02) |
| H3 | 0.18 (0.02) | 0.17 (0.02) | 0.20 (0.02) | 0.17 (0.02) | 0.19 (0.02) | 0.16 (0.02) | 0.18 (0.02) |
| H4 | 0.18 (0.02) | 0.18 (0.02) | 0.19 (0.02) | 0.19 (0.02) | 0.18 (0.01) | 0.18 (0.01) | 0.18 (0.02) |
| H5 | 0.18 (0.01) | 0.17 (0.01) | 0.18 (0.01) | 0.16 (0.01) | 0.17 (0.01) | 0.16 (0.01) | 0.17 (0.02) |
| H61 | 0.17 (0.02) | 0.17 (0.01) | 0.17 (0.02) | 0.17 (0.02) | 0.18 (0.01) | 0.17 (0.01) | 0.17 (0.02) |
| H62 | 0.17 (0.02) | 0.17 (0.01) | 0.17 (0.01) | 0.17 (0.02) | 0.16 (0.02) | 0.17 (0.01) | 0.17 (0.02) |
| Hmeb | 0.17 (0.01) | 0.17 (0.01) | 0.17 (0.00) | 0.17 (0.01) | 0.17 (0.01) | 0.17 (0.01) | 0.17 (0.01) |
| HO2 | 0.45 (0.01) | 0.45 (0.01) | 0.45 (0.01) | 0.46 (0.01) | 0.45 (0.01) | 0.45 (0.01) | 0.45 (0.01) |
| HO3 | 0.45 (0.01) | 0.45 (0.01) | 0.45 (0.01) | 0.45 (0.01) | 0.45 (0.01) | 0.45 (0.01) | 0.45 (0.01) |
| HO4 | 0.45 (0.01) | 0.45 (0.01) | 0.45 (0.01) | 0.45 (0.01) | 0.46 (0.01) | 0.47 (0.01) | 0.46 (0.01) |
| HO6 | 0.45 (0.01) | 0.45 (0.01) | 0.45 (0.01) | 0.45 (0.01) | 0.46 (0.01) | 0.46 (0.01) | 0.45 (0.01) |
Standard deviations in parenthesses.
Average value for the methyl hydrogen atoms.
Included in Table IV are the dipole moments computed from the partial atomic charges as well as those computed directly from the HF/6-31G* wave functions. It is well known that dipole moments computed from ESP and RESP charges reproduce the quantum mechanical dipoles very accurately. For example, the average ESP–dipole moments, computed by averaging the dipole for each conformation, were within 0.01 debye of the averaged quantum mechanical values. Moreover, both the ESP and RESP methods lead to dipole moments in excellent agreement with each other, despite the variations in the ESP and RESP partial charges discussed above. In contrast, the average dipole moment computed from the Mulliken charges for each conformation differed from the quantum mechanical values by as much as 3 debye. Thus, despite the desirable property of being relatively insensitive to conformational changes, the Mulliken charges poorly reproduce the molecular electrostatic properties. For comparison, we computed the dipole moments by assigning the EA charges to the individual molecular conformations. Although the EA-ESP and EA-RESP charges still performed well, all EA charge sets led to a degradation in accuracy of the computed dipole moments. The variation between the dipoles computed from the EA charges relative to those computed from individual charge sets suggests that there may be cases in which EA charges may not be appropriate. Specifically, in instances where the carbohydrate exists in what is essentially a single conformation, it may be preferable to employ the charges for that conformation. This is most likely to occur when the carbohydrate exists in a crystalline lattice, either alone or complexed with a receptor such as a lectin or antibody. However, in cases in which the carbohydrate is free in solution, the EA charges are the better approximation.
TABLE IV.
Average Dipole Moments (Debye) and Average Dipole Moments (〈μ〉) Derived from EA Charges for the α- and β-Anomers of 1–3.
| Charge Protocol | 1α | 1β | 2α | 2β | 3α | 3β | |
|---|---|---|---|---|---|---|---|
| ESP | 〈μ〉 | 3.17 | 3.07 | 3.57 | 3.54 | 3.63 | 3.88 |
| 〈μ from EA charges〉 | 3.86 | 3.86 | 4.29 | 4.18 | 4.32 | 4.60 | |
| RESP | 〈μ〉 | 3.15 | 3.06 | 3.56 | 3.53 | 3.61 | 3.88 |
| 〈μ from EA charges〉 | 3.77 | 3.75 | 4.22 | 4.12 | 4.14 | 4.45 | |
| Mulliken | 〈μ〉 | 4.30 | 4.16 | 5.23 | 6.32 | 5.35 | 6.98 |
| 〈μ from EA charges〉 | 4.78 | 4.68 | 5.70 | 6.66 | 5.85 | 7.45 | |
| SCFa 〈μ〉 | 3.17 | 3.07 | 3.57 | 3.53 | 3.63 | 3.88 |
Computed from the HF/6-31G* wave function.
CONFIGURATIONAL EFFECTS
Not surprisingly, the largest effect on the charges from changes in anomeric configuration was observed for C1 and the directly attached atoms (C2, O1, H1, and O5). This was generally true for all of the charge calculation protocols. Due to the large standard deviations associated with the EA-ESP and EA-RESP charges, there were few general trends observable in the charges. However, in the case of the Mulliken charges, the charges on the carbon atoms could be ranked from largest to smallest, for all glycosides in the following order: C1 > C2 ~ C3 ~ C4 ~ C5 > C6 > Cme. This ranking was independent of the anomeric configuration. Further, in each system the charge on C1 in the β-anomer was found to be larger than in the α-anomer. The more positive the carbon atom, the more it would be expected to be deshielded in the NMR spectrum, and it is interesting to note that the trends in charge are in excellent agreement with the 13C chemical shifts for these molecules.30 An analysis of the Mulliken charges vs. 13C chemical shifts gave rise to an average correlation coefficient of 0.96.
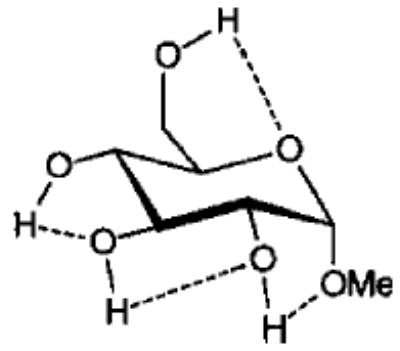
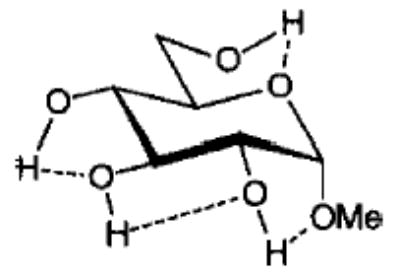
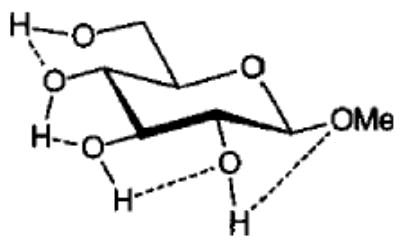
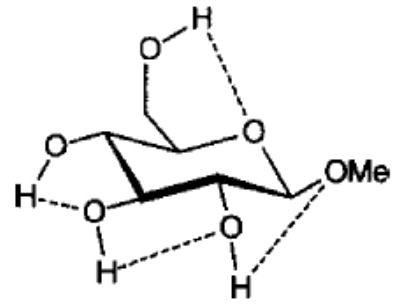
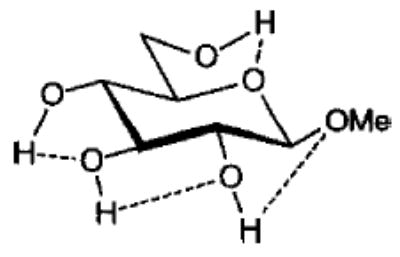
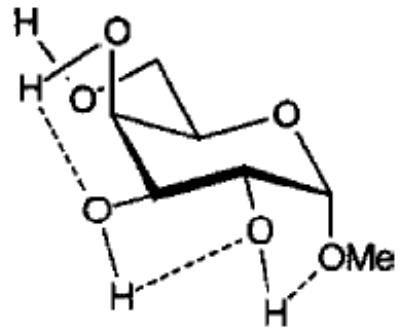
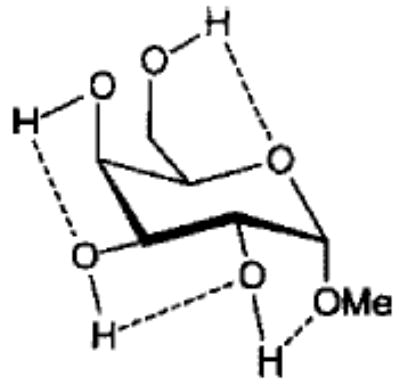
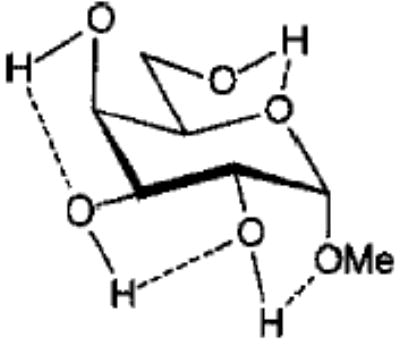
In contrast, the potential-fitted charges, while giving an excellent description of the molecular electrostatic potentials and resultant intermolecular interaction energies,31 showed no statistically significant correlation with intramolecular properties, such as 13C chemical shifts. This raised a question as to the ability of the ESP or RESP charges to reproduce conformational energies, which are highly dependent on internal electrostatic interactions. To explore this issue, we computed the relative energies of several low energy conformers32, 33 of the methyl glycosides 1 and 3 at the HF/6-31G* level. Using our GLYCAM parameters for carbohydrate simulations within the AMBER force field we were able to examine the effect of charge on the relative conformational energies (see Table V). The quantum mechanical relative energies are included for comparison.
TABLE V.
Influence of Charge Protocol on Conformational Relative Energies (Erel) for the α- and β-Anomers of 1 and 3.
|
Erel |
|||||
|---|---|---|---|---|---|
| Charge Protocol
|
|||||
| Glycoside Conformation | (HF/6-31G*//6-31G*) | EA-RESPb | EA-RESPc 〈 α,β〉 | EA-RESPd 〈 overall 〉 | |
| 1α1 |
|
0.00a
0.00a, e |
0.00a
0.00a |
0.00a
0.15a |
0.00a
0.24a |
| 1α2 |
|
0.11
0.11 |
0.39
0.39 |
0.47
0.62 |
0.50
0.74 |
| 1α3 |
|
0.00
0.00 |
0.07
0.07 |
0.30
0.45 |
0.29
0.54 |
| 1β1 |
|
0.07
1.30 |
0.00
0.47 |
0.00
0.00 |
0.00
0.00 |
| 1β2 |
|
0.00
1.23 |
0.59
1.07 |
0.52
0.52 |
0.55
0.55 |
| 1β3 |
|
0.23
1.46 |
0.42
0.89 |
0.18
0.18 |
0.17
0.17 |
| 3α1 |
|
1.62
1.62 |
1.71
8.85 |
1.66
1.80 |
1.03
1.03 |
| 3α2 |
|
1.18
1.18 |
2.41
9.55 |
1.98
2.12 |
2.08
2.08 |
| 3α3 |
|
0.00
0.00f |
0.00
7.14 |
0.00
0.15 |
0.00
0.00 |
| 3β1 |
|
1.36
3.24 |
1.42
1.42 |
1.47
1.47 |
0.83
1.14 |
| 3β2 |
|
1.02
2.90 |
1.96
1.96 |
2.38
2.38 |
2.49
2.81 |
| 3β3 |
|
0.00
1.88 |
0.00
0.00 |
0.00
0.00 |
0.00
0.31 |
Upper value is relative to the lowest energy conformation for each anomer, lower value is relative to the lowest energy conformation for each glycoside. All values are in kcal/mol.
Unique charges for each anomer.
Charges computed by averaging the EA charges of the α- and β-anomers.
Charges computed by averaging the EA charges for all glycosides.
SCF energy = −722.3613723 hartrees.
SCF energy = −722.3612507 hartrees.
From the data presented in Table V it is apparent that the RESP charges are able to reproduce the relative conformational energies for each glycoside, generally to within 0.5 kcal mol−1. It is important to note that for each charge-averaging protocol the same GLYCAM parameter set was used to compute the data presented in Table V. Better agreement with the quantum mechanical energies could be achieved if the GLYCAM parameters were reoptimized for use with each charge protocol. However, the overall effects arising from alterations in the partial charges are more evident when a common set of parameters is employed. It is most notable that the use of individual charge sets for each anomer could lead to a excessively large energy gap between the α- and β-anomers. For example, in the case of 3, this gap is approximately 7.5 kcal mol−1. In contrast, in the gluco- series (1) there is a much smaller difference between the energies of the α- and β-anomers. This energy gap is dependant primarily on the charges, and not on the GLYCAM parameters. This is clearly shown by the fact that relative energies computed using an average charge set for each anomer (RESP 〈α, β〉 in Table V) removes the excessive energy gap and leads to relative energies in accord with the quantum mechanical data. This approach could be extended to generate a common set of charges for all of the pyranosides (RESP 〈overall〉 in Table V), however, in doing so, the uniqueness of each charge set would be removed. Although this would enhance the ability of the charges to reproduce intramolecular interactions, it would detract from the accuracy of the molecular electrostatic potentials. A poor description of the potentials would, in turn, lead to inaccurate intermolecular interaction energies. Nonetheless, in the case where the charges would be used in solvated MD simulations, rather than in free energy simulations, the use of average charges may be satisfactory. These charges are presented in Tables I and II.
CONVERGENCE OF EA-CHARGES
To establish the extent to which the EA charges were sensitive to the initial charge set, we performed a second simulation of 2α employing the EA charges from the first MD simulation. The average values for the resultant charges from the second simulation were within the standard deviations of the first charge set (data not shown). From this we were able to conclude that conformational ensembles were more dependent on interactions with solvent than on initial charge choice. This is particularly interesting given that many of the charges computed from the crystal conformation of each glycoside, which were employed in the primary MD simulations, fall outside the standard deviations of the EA charges. The largest differences between the EA charges and those computed from the crystal conformations were observed for the aliphatic hydrogen and ring carbon atoms (see Fig. 1). It appears that ensemble averaging is able to absorb some level of inaccuracy in the initial charge set. This has the practical advantage of allowing a relatively crude initial charge set, perhaps computed from a single energy minimized, or crystalographically determined structure, to be used to initiate the EA protocol.
FIGURE 1.
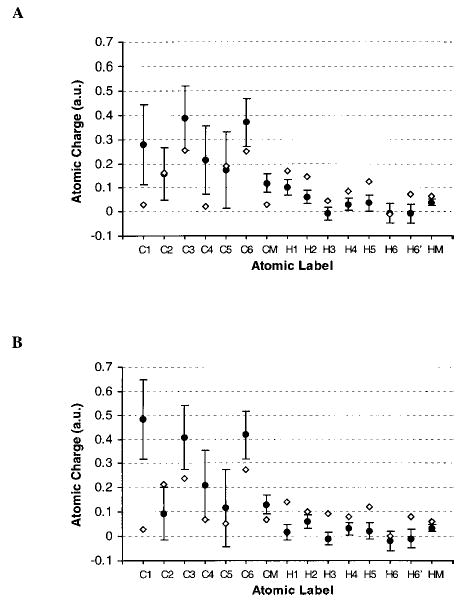
Selected EA-ESP charges (black circles) and standard deviations (shown as error bars), and single point charges (open diamonds) computed from the neutron diffraction crystal structures, for 1α34 (A) and 1β35 (B).
Conclusions
We have computed partial charges from an ensemble of conformations collected from long simulations performed in the presence of explicit solvent. This approach ensures that the conformations represent the populations present in solution, in contrast to ensembles from adiabatic mapping or gas-phase MD simulations. The resulting EA charges were employed in subsequent simulations from which new EA charges were computed. This iterative approach confirmed that a single cycle of simulation-charge calculation was sufficient to reach convergence in the computed charges.
A benefit of the EA protocol is that it provides estimates of the standard deviations in the atomic charges. These, in turn, provide insight into the conformational and configurational sensitivity of the charge fitting protocol. We have shown that the EA-RESP and EA-ESP approaches lead to excellent reproduction of average electrostatic properties, such as dipole moments, in contrast to the poor behavior of EA charges derived from a Mulliken population analysis.
Internal conformational energies may also be well reproduced by the EA-RESP or EA-ESP charges, for any given sugar configuration. However, these charges, by virtue of their sensitivity to chirality at the carbon nuclei, overestimate the relative energy differences between the α- and β-anomers of the glycosides studied. This inaccuracy is removed if the charges are averaged over the anomeric configurations. Based on the results of this work we intend to incorporate EA charges into the GLYCAM parameters for carbohydrate simulations.
Supplementary Material
EA-RESP charge sets for the methyl glycosides of xylose, fucose, and N-acetylglucosamine (Table S1). Optimized geometries (HF/6-31G*//6-31G*) for the structures presented in Table V (Tables S2–S13). The GLYCAM parameters are freely available by contacting Dr. Woods.
Supplementary Material
Footnotes
Contract/grant sponsor: National Institutes of Health; contract/grant number: GM-55230
This article includes Suplementary Material available from the authors upon request or via the Internet at ftp.wiley.com/public/journals/jcc/suppmat/22/11 or http://www.interscience.wiley.com/jpages/0192-8651/suppmat/v22.1125.html
References
- 1.Jorgensen WL, Maxwell DS, Tirado-Rives J. J Am Chem Soc. 1996;118:11225. [Google Scholar]
- 2.Maple JR, Hwang MJ, Stockfisch TP, Dinur U, Waldman M, Ewig CS, Hagler AT. J Comput Chem. 1994;15:162. [Google Scholar]
- 3.Pearlman DA, Kim SH. Biopolymers. 1985;24:327. doi: 10.1002/bip.360240204. [DOI] [PubMed] [Google Scholar]
- 4.Rappé AK, Goddard WA., III J Phys Chem. 1991;95:3358. [Google Scholar]
- 5.Coppens P. Annu Rev Phys Chem. 1992;43:663. [Google Scholar]
- 6.Woods RJ, Chappelle R. J Mol Struct (Theochem) 2000;527:149. doi: 10.1016/S0166-1280(00)00487-5. [DOI] [PMC free article] [PubMed] [Google Scholar]
- 7.Mulliken RS. J Chem Phys. 1955;23:1833. [Google Scholar]
- 8.Williams, D. E.; Yan, J.-M. In Advances in Atomic and Molecular Physics; Bates, D.; Bederson, B., Eds.; Academic Press: San Diego, 1987; p. 87.
- 9.Gussoni M, Ramos MN, Castiglioni C, Zerbi G. Chem Phys Lett. 1987;142:515. [Google Scholar]
- 10.Löwdin PO. Adv Quantum Chem. 1970;5:185. [Google Scholar]
- 11.Reed AE, Weinstock RB, Weingold F. J Chem Phys. 1985;83:735. [Google Scholar]
- 12.Bader RFW, MacDougall PJ, Lau CDH. J Am Chem Soc. 1984;106:1594. [Google Scholar]
- 13.Breneman CM, Wiberg KB. J Comput Chem. 1990;11:361. [Google Scholar]
- 14.Woods RJ, Khalil M, Pell W, Moffat SH, Smith VH., Jr J Comput Chem. 1990;11:297. [Google Scholar]
- 15.Besler BH, Merz KM, Kollman PA. J Comput Chem. 1990;11:431. [Google Scholar]
- 16.Chirlian LE, Francl MM. J Comput Chem. 1987;8:894. [Google Scholar]
- 17.Stouch TR, Williams DE. J Comput Chem. 1992;13:622. [Google Scholar]
- 18.Williams DE. Biopolymers. 1990;29:1367. [Google Scholar]
- 19.Bayly CI, Cieplak P, Cornell WD, Kollman PA. J Phys Chem. 1993;97:10269. [Google Scholar]
- 20.Kirschner, K. N.; Woods, R. J. Proc Natl Acad Sci, submitted.
- 21.Cornell WD, Cieplak P, Bayly CI, Kollman PA. J Am Chem Soc. 1993;115:9620. [Google Scholar]
- 22.Reynolds CA, Essex JW, Richards WG. J Am Chem Soc. 1992;114:9075. [Google Scholar]
- 23.Essex JW, Reynolds CA, Richards WG. J Am Chem Soc. 1992;114:3634. [Google Scholar]
- 24.Frisch, M. J.; Trucks, G. W.; Schlegel, H. B.; Gill, P. M. W.; Johnson, B. G.; Robb, M. A.; Cheeseman, J. R.;Keith, T. A.; Peterssen, G. A.; Montgomery, J. A.; Raghavachari, K.; Al-Laham, M. A.; Zakrzewski, V. G.; Ortiz, J. V.; Foresman, B. G.; Cioslowski, J.; Stefanov, B.; Nanayakkara, A.; Challacombe, M.; Peng, C. Y.; Ayala, P. Y.; Chen, W.; Wong, M. W.; Andres, J. L.; Replogle, E. S.; Gomperts, R.; Martin, R. L.; Fox, D. J.; Binkley, J. S.; Defrees, D. J.; Baker, J.; Stewart, J. J. P.; Head-Gordon, M.; Gonzalez, C.; Pople, J. A. Gaussian 94; Gaussian, Inc.: Pittsburgh, PA, 1995.
- 25.Case, D. A.; Pearlman, D. A.; Caldwell, J. W.; Cheatham, T. E., III; Ross, W. S.; Simmerling, C. S.; Darden, T. A.; Merz, K. M.; Stanton, R. V.; Cheng, A. L.; Vincent, J. J.; Crowley, M.; Ferguson, D. M.; Radmer, R. J.; Seibel, G. L.; Singh, U. C.; Weiner, P. K.; Kollman, P. A. AMBER 5.0 (5.0); University of California: San Francisco, 1997.
- 26.Woods RJ, Dwek RA, Edge CJ, Frase-Reid B. J Phys Chem. 1995;99:3832. [Google Scholar]
- 27.Allen FH, Davies JE, Galloy JJ, Johnson O, Kennard O, Macrae CF, Mitchell EM, Mitchell GF, Smith JM, Watson DG. J Chem Inf Comput Sci. 1991;31:187. [Google Scholar]
- 28.Nishida Y, Ohrui H, Meguro H. Tetrahedron Lett. 1984;25:1575. [Google Scholar]
- 29.Carey C, Chirlian LE, Gange DM, Francl MM. J Comput Chem. 1996;17:367. [Google Scholar]
- 30.Bock K, Pedersen C. Adv Carbohydr Chem Biochem. 1983;41:27. [Google Scholar]
- 31.Pathiaseril A, Woods RJ. J Am Chem Soc. 2000;122:331. doi: 10.1021/ja9914994. [DOI] [PMC free article] [PubMed] [Google Scholar]
- 32.Cramer CJ, Truhlar DG. J Am Chem Soc. 1993;115:5745. [Google Scholar]
- 33.Damm W, Frontera A, Tirado-Rives J, Jorgensen WL. J Comput Chem. 1997;18:1955. [Google Scholar]
- 34.Jeffrey GA, McMullan RK, Takagi S. Acta Crystallogr. 1977;B33:728. [Google Scholar]
- 35.Jeffrey GA, Takagi S. Acta Crystallogr. 1977;B33:738. [Google Scholar]
Associated Data
This section collects any data citations, data availability statements, or supplementary materials included in this article.