

Summary
T7 RNA polymerase is the best-characterized member of a widespread family of single-subunit RNA polymerases. Crystal structures of T7 RNA polymerase initiation and elongation complexes have provided a wealth of detailed information on RNA polymerase interactions with the promoter and transcription bubble, but the absence of DNA downstream of the melted region of the template in the initiation complex structure, and the absence of DNA upstream of the transcription bubble in the elongation complex structure means that our picture of the functional architecture of T7 RNA polymerase transcription complexes remains incomplete. Here we use the site-specifically tethered chemical nucleases and functional characterization of directed T7 RNAP mutants to both reveal the architecture of the duplex DNA that flanks the transcription bubble in the T7 RNAP initiation and elongation complexes, and to define the function of the interactions made by these duplex elements. We find that downstream duplex interactions made with a cluster of lysines (K711/K713/K714) are present during both elongation and initiation where they contribute to stabilizing a bend in the downstream DNA that is important for promoter opening. The upstream DNA in the elongation complex is also found to be sharply bent at the upstream edge of the transcription bubble, thereby allowing formation of upstream duplex:polymerase interactions that contribute to elongation complex stability.
Keywords: RNA polymerase, T7 RNA polymerase, DNA melting, DNA bending, transcription
Introduction
In enzymes that use nucleic acids as substrates, interactions that are not localized to, and may even be distant from, the active site can nevertheless be important for function through their roles in determining the overall architecture of the enzyme:nucleic acid complex1; 2; 3; 4. In particular, DNA bending and melting are often concerted events that serve both to determine the track of a DNA molecule within a macromolecular complex and to expose the DNA bases for active site reactions5; 6.
For example, the crystal structure of an elongation complex (EC) of the phage T7 RNA polymerase reveals a sharp bend at the downstream edge of the transcription bubble that would allow the duplex DNA up to 10–15 nts downstream of the bubble to interact with a positively charged patch of residues (K711/K712/K713; fig. 1a)7; 8. Whether a similar set of interactions could be made in the initiation complex (IC) is unclear because the crystal structure of the IC contains no DNA downstream of the transcription bubble9. However, recent FRET studies have shown that bending of the downstream DNA and promoter opening are concerted events during T7RNAP transcription initiation and indicate that the downstream DNA is similarly bent in the IC and EC10; 11; 12. However, these studies do not reveal the role of these downstream DNA interactions in polymerase function during either initiation or elongation. Are they important for inducing the bend in the downstream DNA and is this important for promoter opening during initiation or transcription bubble stabilization during elongation?
Figure 1.
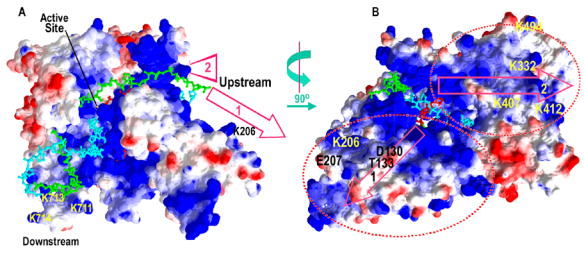
Putative paths for up- and downstream DNA in the T7RNAP transcription complex. A: Accessible surface representation of the T7RNAP EC (pdb 1MSW) with positively and negatively charged regions on the RNAP colored blue and red, respectively, and the T, NT, and RNA strands in cyan, green, and red. A cluster of positively charged residues (K711/K713/K714: the ‘downstream positive patch’) that could interact with DNA 5–15 nts downstream of the RNA 3′-end are indicated, as are 2 possible paths (arrows “1” and “2”) for DNA upstream of the transcription bubble. B: The model from A rotated 90°, as indicated. Residues mutated to allow mapping of upstream DNA interactions are labeled.
The persistence of a similar set of interactions for the downstream DNA during initiation and elongation is reasonable in light of the observation that the region of the polymerase involved in these interactions has a similar conformation during both initiation and elongation. This is not true for the interactions made with DNA upstream of the transcription bubble. The region of the polymerase involved in interactions with the upstream DNA undergoes a massive conformational rearrangement during the transition from initiation to elongation coupled to loss of promoter interactions and changes in how the upstream DNA is bound in the transcription complex7; 8. While the interactions made by the DNA upstream of the transcription bubble during initiation are 3 clear from the IC crystal structure, in the EC structure the DNA extends only 6–8 nts upstream of the base that is paired with the RNA 3′-end, corresponding only to the transcription bubble portion of the EC. However, DNAseI footprints of T7RNAP ECs reveal strong protection of the T strand up to 15 nts upstream of the RNA 3′-end, and both enhancement and weaker protection extending 20 nts upstream13; 14; 15. Exo III digestion patterns similarly indicate that up to 15 nts of DNA upstream of the RNA 3′-end are protected in the elongation complex, and another 5 nts are weakly protected13; 14; 15. The transcription bubble in the T7RNAP EC extends 7–8 nts upstream of the RNA 3′-end16; 17, so the DNAse I and Exo III footprinting data indicate that there are RNAP interactions with the 7–12 nts of duplex DNA immediately upstream of the transcription bubble. Currently we have no information on the RNAP contacts or function of these interactions.
Here site-specifically tethered chemical nucleases are used to define the nucleic acid architecture of the T7RNAP transcription complex during initiation and elongation. Characterization of mutant enzymes is used to identify the roles that interactions distant from the active site or transcription bubble have in determining this architecture and in polymerase function. We find that an interaction made by the far downstream DNA with a cluster of positively charged amino acids is important for forming the downstream bend in the DNA and for opening the promoter during initiation. We find that the upstream DNA in the EC is also sharply bent. However, mutation of residues expected to be in contact with the upstream DNA has only a modest effect on polymerase function. Though unexpected, the latter result is consistent with observations that DNA upstream of the transcription bubble is dispensable for formation of functional ECs from synthetic RNA/DNA scaffolds18.
Results
Downstream DNA interacts with K711/K713/K714 in the IC as it does in the EC
Fig. 1A shows the crystal structure of the T7RNAP EC that contains a 10 nt RNA; 10 and 7 nts of, respectively, non-complementary template (T) and nontemplate (NT) strands that correspond to the transcription bubble, and a 10 b.p. duplex element downstream of this unpaired sequence7. The most downstream elements of the duplex approach a positively charged patch on the RNAP surface that includes residues K711, K713, and K714. In the crystal structure of the T7RNAP IC the T and NT strands extend to only +5 and −4, respectively 9, and therefore provide no information on the location of the duplex DNA downstream of the transcription bubble. To ask if the 711/713/714 positive patch interacts with the duplex DNA in the IC, we substituted a cysteine at residue 711 and conjugated it with Fe-BABE, a chemical nuclease that cleaves DNA through the generation of diffusible hydroxyl radicals upon addition of ascorbate and peroxide19. ICs with 4 and 7 nt RNAs, and an EC with a 13 nt RNA were then formed with this conjugated enzyme and the regions of cleavage in these transcription complexes on the NT strand were mapped. Fig. 2A (lanes 1–4) shows that the nuclease at 711 generates two sets of cuts, spaced ~10 nts apart, and located ~3 and ~13 nts downstream of the 3′-end of the RNA in the IC4, IC7, and EC13 complexes. These cleavage sites are consistent with the EC structure in fig 2B, which shows that the two centers of NT strand cleavage in EC13 would correspond to the 2 regions of this strand which face residue 711. The observation that the cleavage patterns in IC4, IC7, and EC13 are similar, except for differences in position which track the translocation of the complex, indicates that the downstream duplex DNA is positioned similarly relative to residue 711 in both the IC and EC.
Figure 2.
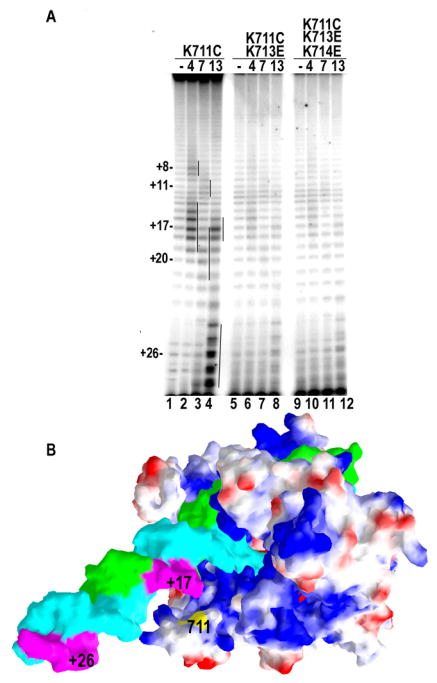
Effects of downstream positive patch mutation on DNA architecture in the T7RNAP IC and EC. A: 5′-end labeled T strand cleavage patterns by RNAPs with Fe-BABE conjugated to residue 711 and in which the RNA has been extended to 4, 7, or 13 nts, as indicated (“-”= no cleavage control). Numbering of cut sites is relative to the +1 transcription start. Lanes 1–4: Fe-BABE conjugated K711C RNAP; lanes 5–8: Fe-BABE conjugated K711C/K713E RNAP; lanes 9–12: Fe-BABE conjugated K711/K713E/K174E RNAP. B: Surface representation of T7RNAP EC colored as in fig. 1. The downstream DNA has been extended by 10 nts of duplex. The positions of cuts generated by a conjugate at residue 711 (indicated) are highlighted in magenta and numbered assuming the RNA 3′-end is at +13 relative to the transcription start.
However, Fe-BABE cleavage is a low-resolution technique and would not reveal subtle changes in the position of the DNA, nor does it reveal whether interactions with residues 711/713/714 are important for DNA bending in either or both, the IC and EC. To ask this question we introduced multiple mutations at this site by mutating residue 713 or both 713 and 714 to glu in the K711C background, leading to a net charge change of −3 or −5 relative to the WT sequence. All of the mutants described were constructed in a ‘cys-minimized’ T7RNAP in which 7 of the 12 endogenous cysteines were mutated to serines. The activity of this enzyme is indistinguishable from WT 20; 21; 22 and is here referred to as WT for simplicity. Cleavage by Fe-BABE conjugated to 711C nuclease was then assessed in these mutant backgrounds. As seen in lanes 5–8 and 9–12 of fig. 2A, the K713E and K714E mutations weaken the intensity of cutting by the nuclease conjugated to residue 711. This suggests that these mutations disrupt interactions with the downstream DNA and allow it to move away from the 711/713/714 positive patch. Since these mutations have similar effects in both the ICs and the EC, this also suggests that these residues make similar interactions during both initiation and elongation.
Multiple substitutions in the 711/713/714 patch slow transcription initiation
An alternative explanation for the weak cutting seen with the K711C/K713E and K711C/K713E/K714E mutants in fig. 2A is not that these mutants form complexes with altered architecture, but that they fail to quantitatively form either ICs or ECs. Measurement of duplex melting with KMnO4, however, revealed that the WT and mutant RNAPs exhibited quantitatively indistinguishable levels of open complex or EC formation (fig. 3A), indicating that the mutant RNAPs are as capable of forming transcription complexes as the WT enzyme. Transcription reactions run under conditions that allowed transcript extension to13 nts also revealed similar levels of halted transcript synthesis by the WT and mutant enzymes (fig. 3B), corresponding to synthesis of a 1:1 ratio of transcript to template and indicating quantitative EC formation with the mutant enzymes.
Figure 3.
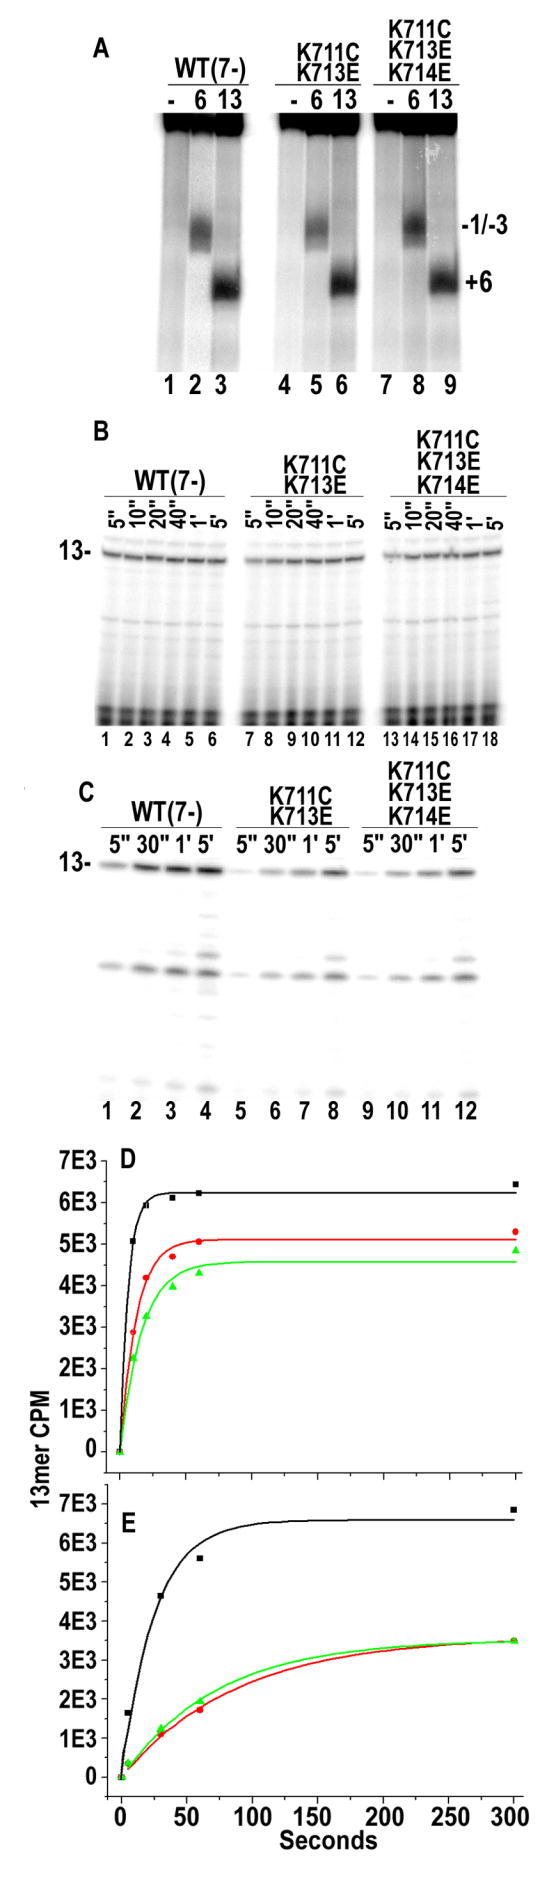
Transcriptional activity of downstream positive patch mutants. A: KMnO4 probing of 5′-T strand labeled promoters in complexes with RNA extended to 6 or 13 nts, as indicated (“-”=no RNAP). Lanes 1–3: WT (“7-”20: designates that 7 of 12 endogenous cysteines have been mutated to serines in this ‘WT’ and in all mutants used in this study); lanes 4–6: K711C/K713E; lanes 7–9: K711C/K713E/K714E. B: Transcription reaction run for indicated times without UTP so that transcript extension is limited to 13 nts. Lanes 1–6: WT (7-); lanes 7–12: K711C/K713E; lanes 13–18: K711C/K713E/K714E. C: As in (B) but with GTP reduced from 500 to 20 μM to slow initiation. D. Plot of amount of 13mer vs. time for reactions carried out at high (500 mM) GTP concentrations and fit to: A(1−e−kt), where A is the amount of 13mer at long time points and k is time constant for productive transcription initiation (as measured by appearance of the 13mer). Black line: WT; Red line: K711C/K713E; Green line: K711C/K713E/K714E; E: As in D, but with GTP at 0.02 mM.
However, in the latter experiments it is seen that there is a delay in the quantitative appearance of the 13mer with the mutant enzymes in comparison to the WT enzyme (compare lanes 7 or 13 to lane 1 in fig. 3B). Plots of 13mer vs. time (fig. 3D) show that productive initiation is 50% complete in 3.9±0.25, 7.0±0.4 and 9.0±1.3 sec. (±s.e. for n=3) for the WT, K711C/K713E, and K711C/K713E/K714E enzymes, respectively. This indicates that the mutants are 2–3 fold slower in initiating transcription, but the difficulties in manually measuring differences for such rapid reactions prompted us to characterize these enzymes under more stringent conditions, where functional differences might be more apparent. Because initiating NTP binding drives T7RNAP open complex formation23; 24, reduction of the GTP concentration can slow initiation. When reactions like those in fig. 3B are run with GTP reduced from 500 to 20 μM, initiation rates are reduced and the differences between the WT and mutant enzymes are more apparent over the time range accessible to manual sampling (fig. 3C), and the time for 50% completion of initiation is found to be 17, 49, and 63 sec. for the WT, K711C/K713E, and K711C/K713E/K714E enzymes, respectively (fig. 3E).
Reaction stringency can also be enhanced by running reactions in the presence of NaCl, and when we ran multiple turnover reactions in the presence of 100 mM NaCl, we observed both a 4–5 fold retardation in the rate of initial appearance and subsequent accumulation of a short runoff (“R.O.”) transcript with the mutant enzymes as compared to the WT enzyme on a duplex template (fig. 4A). However, on a ‘pre-melted’ partially single-stranded (PSS) template we observed no difference between the rate of run-off transcript appearance and only a 1.5 fold reduction in the rate of accumulation of the runoff transcript (fig. 4B), suggesting that the defect in the mutant enzymes reflected reduced duplex melting activity. To test this directly, we used KMnO4 footprinting of reactions carried out in the presence of 100 mM NaCl (fig. 4C). All 3 enzymes could form transcription bubbles in reactions allowing transcript extension to 13 nts (fig. 4C: lanes 3, 6, 9), although the mutant enzymes did so at a modestly reduced level, however in the reaction in which transcript extension is limited to 6 nts (lanes 2, 5, 8), the mutant enzymes exhibited a sharp decrease in formation of open complexes, with the triple mutant having the greater effect.
Figure 4.
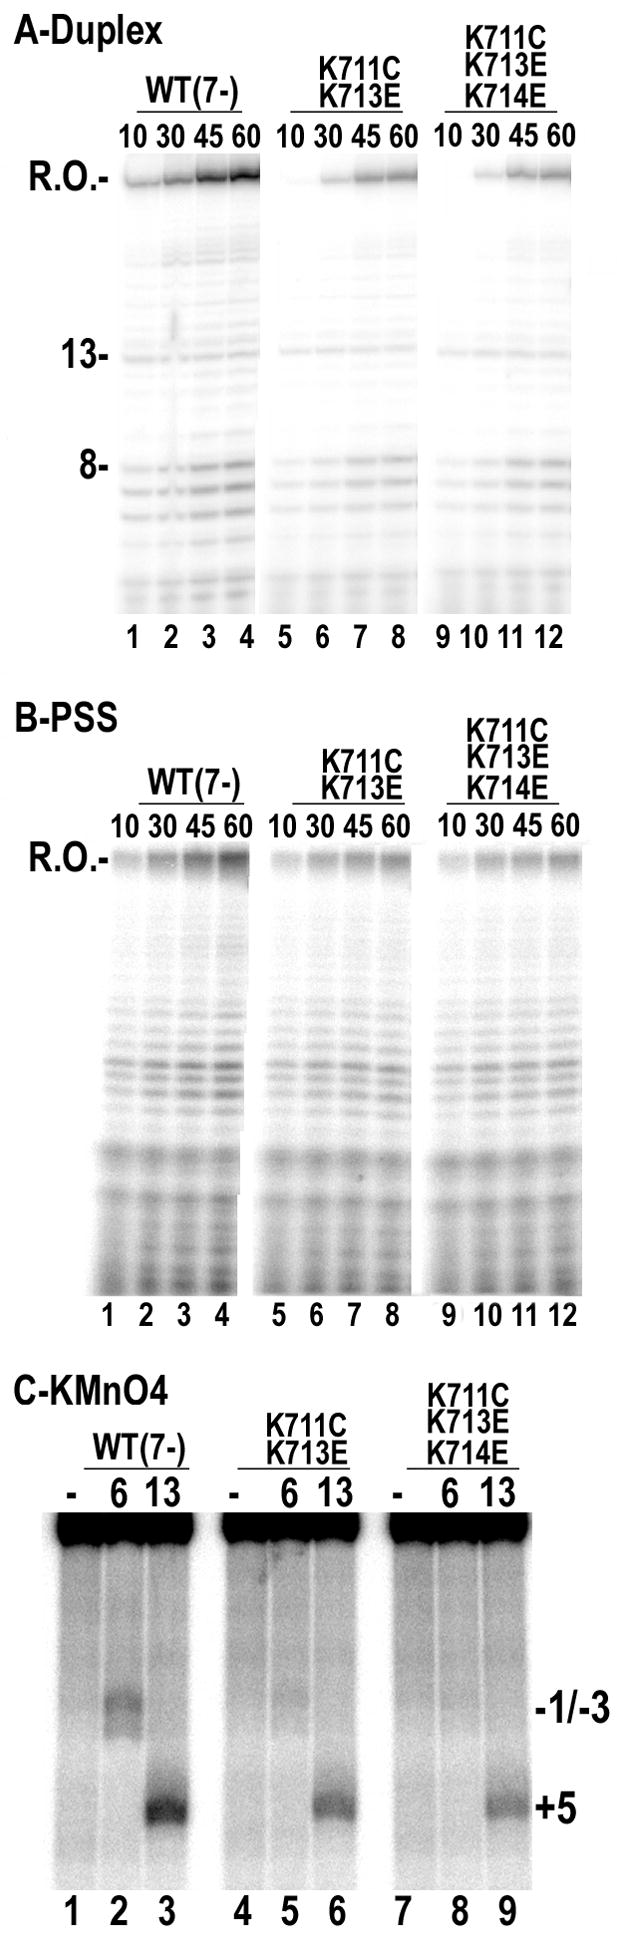
Transcriptional activity of downstream positive patch mutants in the presence of 100 mM NaCl. A: Multiple turnover runoff transcription reactions run for the indicated times (in seconds) on a duplex synthetic promoter. Lanes 1–4: WT (7-); lanes 5–8: K711C/K713E; lanes 9–12: K711C/K713E/K714E. B: As in A, but with a partially single-stranded (PSS) promoter that lacks NT strand downstream of −5. C: KMnO4 probing of 5′-T strand labeled promoters in complexes with RNA extended to 6 or 13 nts, as indicated (“-”=no RNAP).
Placement of upstream DNA in the T7RNAP EC
RNAP interactions with the duplex DNA immediately upstream of the transcription bubble are not sequence specific and could be expected to be primarily ionic in character. Inspection of the upstream face of the RNAP in the EC crystal structure reveals 2 positively charged regions that could form interaction surfaces for the upstream duplex. One of these includes residue K407 and K412 and is identified by the arrow labeled 2 in figs. 1A and 1B. Binding of DNA to this surface would require a sharp bend immediately upstream of the transcription bubble. The other positively charged region includes residue K206 and is indicated by the arrow labeled 1 in fig. 1. Binding of the upstream DNA to this region would not require as severe a bend as needed for binding to region 2.
To determine where on the RNAP the upstream DNA is bound we analyzed cleavage patterns of nucleases tethered to residues 207, 239, 133, 407 or 412 on both the T and NT strands in halted ECs. Residues 207, 239, and 133 are within region 1. If the duplex DNA binds to this region, then nucleases tethered to these residues should give strong cutting up to as much as ~30 nts upstream of the 3′-end of the RNA with cut sites separated by ~10 nts and offset by ~5 nts on each strand, as has been observed when a duplex DNA element lies opposite a source of hydroxyl radicals such as a tethered Fe-BABE molecule20; 22. However, if the upstream DNA binds to region 2, then a single set of cuts on each strand is expected at the sites where the T and NT strands first emerge from the RNAP and become accessible to hydroxyl radicals generated at residues 207, 239 and 133. As seen in fig. 5D, the conjugates at these positions generate single sets of cuts ~11 and ~14 nts upstream of the 3′-end of the RNA on, respectively, the NT and T strands. As modeled in fig. 5A this would be consistent with the upstream DNA binding to region 2 so that the cleavage sites (highlighted in magenta) would correspond to the regions on the T and NT strands accessible to the hydroxyl radicals generated at residues 133/207/239.
Figure 5.
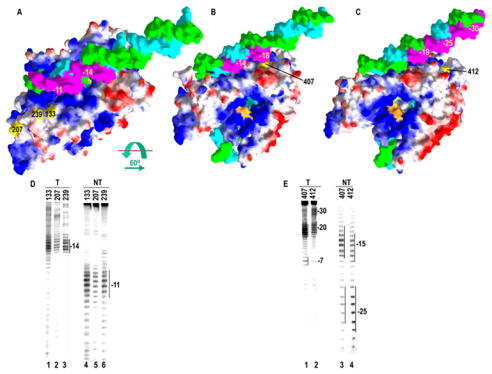
Location of upstream DNA in the T7RNAP EC. A: Model of T7RNAP EC in which the EC crystal structure has been extended by addition of 20 nts of duplex DNA upstream of the transcription bubble and placed as suggested by ‘arrow 2’ in fig. 1. The model is colored as in fig. 1, and the regions of DNA cleavage by Fe-BABE conjugates at residues 207, 239, or 133 (panel D) are highlighted in magenta and numbered relative to the RNA 3′-end. B: Model from A rotated 60° as indicated and with the centers of strongest DNA cleavage by an Fe-BABE conjugate at residue 407 (panel E) highlighted and numbered. C: As in B, but with the centers of strongest DNA cleavage by an Fe-BABE conjugate at residue 412 (panel E) highlighted and numbered. D: Cleavage on the T (lanes 1–3) or NT (lanes 4–6) strands by Fe-BABE conjugated to residues 133, 207, or 239 as indicated. E: Cleavage on the T (lanes 1, 2) or NT (lanes 3,4 ) strands by Fe-BABE conjugated to residues 407 or 412, as indicated
If the upstream duplex DNA binds near region 2 then nucleases at 407/412 should cleave the DNA well upstream of the transcription bubble with cut sites ~10 nts apart on each strand but offset by ~5 nts on the T vs. NT strands. However, if the DNA binds to region 1, then the nucleases at 407/412 should cleave the upstream DNA weakly or not at all, since region 1 is far from residues 407/412. In particular, if the DNA follows the path defined by arrow 1 in fig. 1, then more upstream DNA would be farther from 412 than 407 and the nuclease at 412 should cleave the more upstream DNA more weakly than the nuclease at 407. However, if the DNA follows the path suggested by arrow 2, the exact opposite is expected: the more upstream DNA would be placed closer to residue 412 than 407 and the relative intensity of cleavage of the far upstream DNA should reflect this. The cleavage patterns of the 407/412 conjugates therefore provide strong discrimination between the 2 models for placement of the upstream DNA. As shown in fig. 5E, these cleavage patterns indicate that the model in which the upstream DNA is near region 2 is correct: the 407/412 conjugates exhibit cleavage across one face of the first 2 full turns of duplex DNA that are immediately upsteam of the transcription bubble in the EC. Cuts are seen centered ~20 and ~30 nts upstream of the RNA 3′-end on the T strand (fig. 5E, lanes 1, 2), and ~15 and ~25 nts upstream on the NT strand (lanes 3, 4). Moreover, these cut sites show that the more upstream DNA is closer to residue 412 than 407. First, we see that centers of the cut sites are shifted 1–2 nts upstream for 412 vs. 407 but, more importantly, we observe that on the T strand the 407 conjugate cuts intensely at a single site centered ~18 nts upstream of the RNA 3′-end (fig. 5E, lane 1), indicating that this conjugate is closest to this region of the T strand. The 412 conjugate, however, shows 2 weaker cut sites centered ~20 and ~30 nts upstream of the RNA 3′-end (lane 2), indicating that this residue sits between these two positions on the T-strand. This is consistent with the cleavages seen on the NT-strand, where the 412 conjugate exhibits a strong set of cuts centered 25 nts upstream of the RNA 3′-end and a weaker set 15 nts upstream (lane 4), while 407 displays the reverse: strong cutting 14 nts upstream and weaker cutting 24 nts upstream. The locations of the strongest sets of cuts on each strand are highlighted in magenta for the 407 and 412 conjugates in fig. 5B and 5C, respectively, on models in which the DNA is shown interacting with region 2. While these cleavage patterns provide for only an approximate placement of the DNA, we conclude that the upstream DNA in the EC more nearly follows the path described in fig. 1 by arrow 2, rather than by arrow 1.
Mutations in the upstream positively charged region do not alter EC architecture and have only modest effects on RNAP function
To determine if interactions made by the DNA with the upstream positively charged region on the RNAP are important for function we tested single site substitutions in this region in a battery of assays to detect effect on EC stability (measurement of EC turnover rates and RNA release), processivity in long transcript synthesis, and termination on class I (classical hairpin) as well as class II (PTH or concatemer junction-type terminators: see accompanying manuscript). Assays were carried under both low-salt, and stringent (+100 mM NaCl), conditions. However, these assays did not identify any strong effects on EC stability or processivity (not shown). We therefore prepared enzymes in which multiple positively charged residues in the upstream region were mutated to neutral or negatively charged residues to maximally disrupt interactions with the upstream DNA (mutants constructed: K407C, K412C, K407E, K407C/K412C, K407E/K412E, K332E, K332E/K494E, K332E/K412C, K332E/K494E/K412C, K407E/K332E/K494E/K412C).
The effects of these mutations on EC architecture were assessed by comparing cleavage patterns by Fe-BABE conjugated to residue 412 in either WT or mutant backgrounds. Data is presented in fig. 6A for the multiply mutated enzymes that have large net charge changes in the positively charged region (negative charge increases of −3 and −7). Surprisingly, the singly substituted (412C, lanes 1–4), doubly substituted (407E/412C, lanes 5–8), and quadruply substituted (332E/494E/407E/412C) enzymes all show similar cleavage patterns, indicating that the mutations are not altering upstream DNA architecture in the EC. When we tested the effects of these mutations on initiation and rates of transcript synthesis on duplex templates we also found that there was no difference in the rate of appearance of runoff transcripts between WT and multiply substituted enzymes (fig. 6B: compare 10 sec. reaction time point in lanes 1, 4, 7), nor between the rate of accumulation of runoff transcripts (compare 1 and 10 min. time points in lanes 2 and 3 vs. 5 and 6 vs. 8 and 9). Identical results were obtained in reactions with 100 mM NaCl (not shown). This result is consistent with the observation that residues from the upstream positive patch are not involved in DNA or RNA interaction in the IC9, so their mutation should not affect initiation rates. The only detectable effect of the mutations on the transcript patterns is an increase in the amounts of transcripts shorter than the runoff, suggesting that the mutant ECs are spontaneously dissociating at a greater rate than the WT enzyme.
Figure 6.
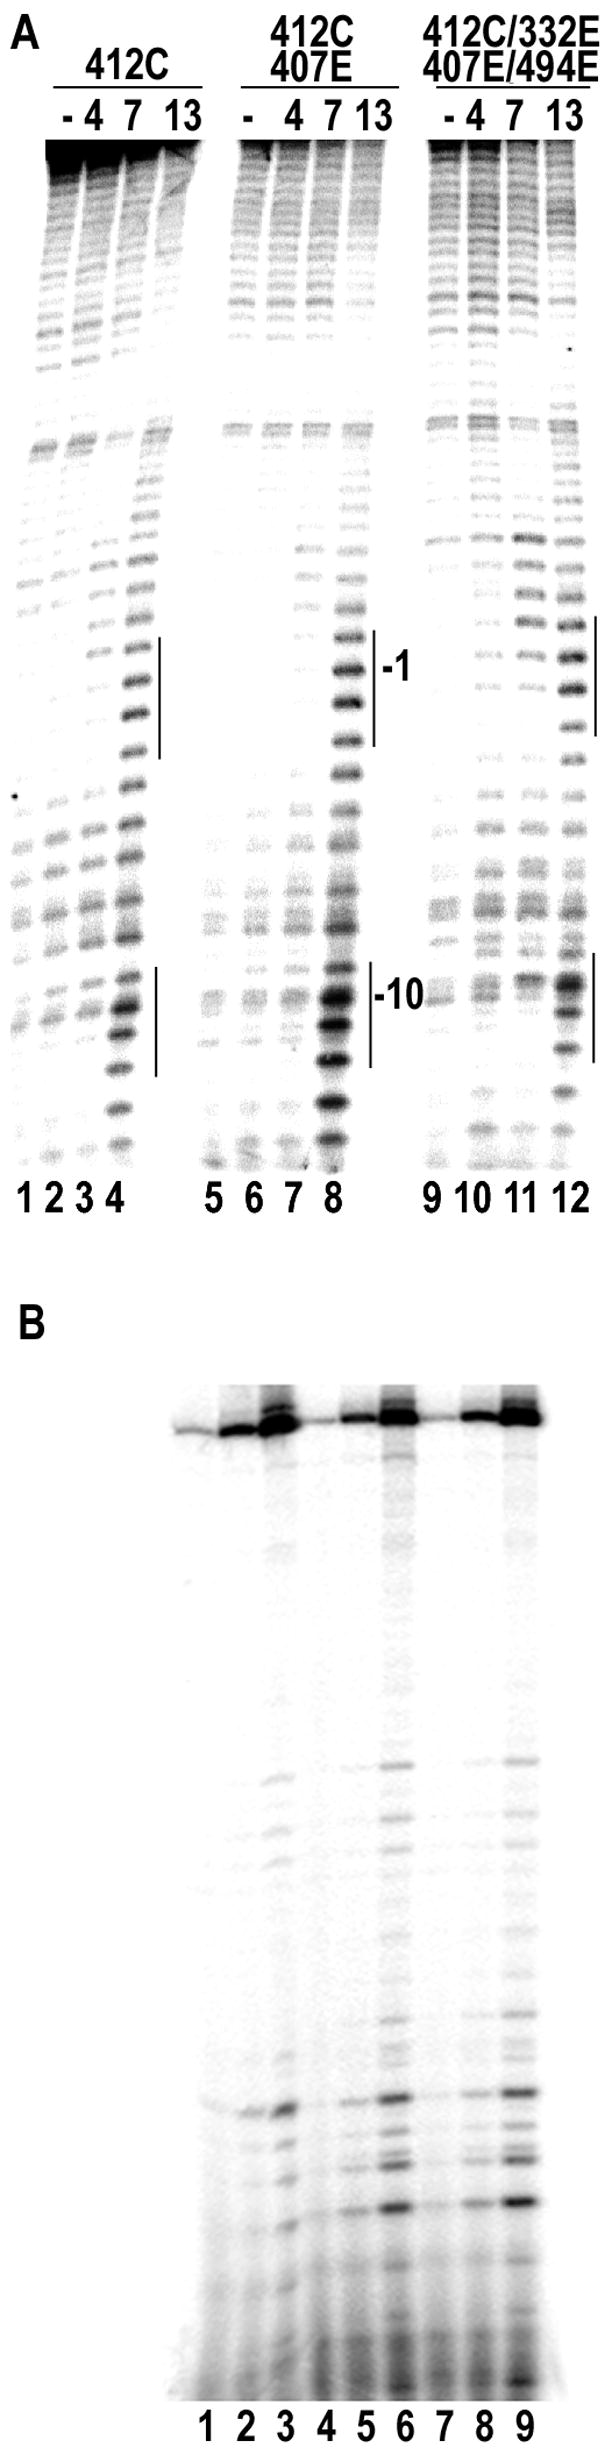
Effects of mutations in upstream positively charged region on EC architecture and function. A: Cleavage of 5′-end labeled NT strand by Fe-BABE conjugates to residue 412 in a WT (lanes 1–4), K407E (lanes 5–8), or K332E/K407E/K494E (lanes 9–12) background in transcription complexes with RNAs 4, 7, or 13 nts in length, as indicated (lanes 1, 5, 9 are no cleavage controls. B. Transcript patterns in multiple-turnover runoff transcription reactions run for 10 sec. (lanes 1, 4, 7), 1 minute (lanes 2, 5, 8), or 10 minutes (lanes 3, 6, 9) with WT (lanes 1–3), K332E/K407E/K494E/K412C mutant (lanes 4–6), or K412C/K407E (lanes 7–9).
To test this directly, we formed halted ECs with the WT and mutant enzymes and then incubated them in the presence of varying NaCl concentrations, following which they were subjected to ultrafiltration to separate transcripts associated with halted ECs from those that had been released into solution. For the WT enzyme, only ~50% of transcripts were released from ECs even after a 2 hr. incubation in reactions with either 0 or 100 mM NaCl (lanes 1–4; fig. 7A), though addition of 800 mM NaCl led to release of most of transcripts (lanes 5–6). An enzyme mutated in the downstream positive patch behaved like the WT RNAP in the 100 and 800 mM NaCl conditions (lanes 9–12), but reproducibly exhibited less transcript release in 0 mM NaCl (lanes 7–8). Enzymes mutated in the upstream positively charged region showed increased transcript release, with a quadruply substituted enzyme releasing most transcripts under all 3 NaCl conditions (lanes 13–18) and a doubly substituted enzyme releasing most of the transcripts in the 100 and 800 mM NaCl reactions (lanes 19–24)
Figure 7.

Effects of mutations in up- and downstream positively charged regions on EC stability. A: Transcripts (13mers) retained (“R”) or freed (“F”) from halted ECs formed with WT (lanes 1–6), K711C/K713E/K714E (lanes 7–12), K407E/K494E/K332E/K412C (lanes 13–18), or K407E/K412E (lanes 19–24) mutant T7RNAPs in the presence of 0 mM (lanes 1, 2, 7, 8, 13, 14, 19, 20), 100 mM (lanes 3, 4, 9, 10, 15, 16, 21, 22), or 800 mM (lanes 5, 6, 11, 12, 17, 18, 23, 24) NaCl. B: Ratio of Free/Retained transcripts from the experiment in A plotted vs. enzyme and NaCl concentration (error bars give ranges from n=2).
Discussion
During T7 RNAP transcription initiation a sharp bend is induced in the downstream DNA in concert with opening of the promoter10; 11; 12. We find that far downstream interactions with the K711/K713/K714 cluster are important for inducing this bend and for promoter opening. Comparatively, however, these lysines are less important for promoter opening than is the intercalating hairpin (residues 231–242) which stabilizes the upstream edge of the open promoter by inserting between the nts at −4. Deletion or mutation of the intercalating hairpin severely reduces transcription from duplex promoters25; 26, while multiple mutations in the 711/713/714 cluster reduce initiation on duplex promoters only ~4 fold. This may be because the bending and opening of the upstream DNA involves multiple additional residues, including other positively charged groups on the RNAP surface (fig. 1a) and the side-chain of F644, which inserts between the T and NT strands at the upstream edge of the bubble27; 28 and may play a role analogous to the intercalating hairpin at the downstream edge.
Our analysis of the cleavage patterns of Fe-BABE nucleases tethered to residues on the upstream face of the RNAP also provides information on the placement of the upstream DNA in the EC. Some of this cleavage data was published previously in a cataloguing of cleavage patterns of 23 distinct Fe-BABE conjugated mutant T7RNAPs22. However, here this data is analyzed in terms of defining the architecture of the up- and downstream DNA in the EC, and we present new data on the effects of mutations in disrupting this architecture. These data indicate that the upstream DNA in the EC approaches a positively charged surface of the RNAP that encompasses K407/K412 (fig. 1B). To approach this surface the DNA would have to be sharply bent at the upstream edge of the transcription bubble.
Somewhat unexpectedly the introduction of multiple charge-altering mutations into the upstream positively charged region did not have any marked effects on EC architecture and only modestly affected EC stability. Since Fe-BABE is a low-resolution technique it is possible that, while the proposed placement of the upstream DNA is approximately correct, we have not identified and mutated the specific side-chains with which the upstream DNA interacts. It is also possible that these interactions are only functionally important in special contexts that we have not examined, i.e. transcription through regions of DNA with bound proteins or through G:C rich stretches of DNA that are resistant to bending/opening. However, it may also be the case that polymerase interactions with the upstream DNA are intrinsically weak, perhaps to facilitate translocation of the EC, and therefore partially dispensable. Indeed, characterization of synthetic RNA/DNA scaffolds used to assemble T7 RNAP ECs for crystallization revealed that scaffolds in which DNA extended only 8 nts upstream of the RNA 3′-end were more active than scaffolds in which the T-strand DNA extended 18 nts upstream18. Furthermore, the addition of an NT strand to the extended upstream T-strand resulted in non-functional scaffolds unless the NT strand was also extended into the transcription bubble. Therefore, it appeared that the upstream DNA actually engaged in non-productive interactions that impaired functional EC assembly unless the transcription bubble portion of the NT strand was also present, possibly to guide the upstream DNA away from such nonproductive interactions.
Methods and Materials
Preparation and purification of mutant polymerases
Mutant RNAPs were constructed in a “cys-minimized” T7RNAP in which 7 of the 12 endogenous cysteine residues had been mutated to serine using a PCR site directed mutagenesis kit (Stratagene) and following manufacturer’s instruction. Multiple substitution mutants were prepared by the sequential introduction of single residue changes into the cys-minimized T7RNAP background. Expression and purification of mutant polymerases were carried out as described 20. Purified RNAPs were stored at −20° C in 10 mM Tris-HCl; pH-8.0, 0.5 M NaCl, 1 mM EDTA, 5 mM DTT, 50% glycerol.
Template preparation
A 59 base oligonucleotide (SPT34 (T-strand) 5′-AGGATCCCCGGGCGAGCTCGAATTCCGGTCTCCCTATAGTGAGTCGTATTAATTTCGAT-3′) was synthesized and PAGE purified by Operon Biotechnologies. This oligonucleotide was annealed to either a complementary 59 base oligonucleotide (SPT34-NT) to generate a duplex (DS) promoter template or to a 21 base oligonucleotide (SPT34-PNT: 5′-ATCGAAATTAATACGACTCAC-3′) corresponding to the segment of the T7 promoter from position −25 to −5, to generate a partially single-stranded (PSS) template as described14. Where indicated, synthetic oligos were labeled at the 5′-end of either the T or NT strand with [γ-32P]ATP (4000 Ci/mmol; ICN) by T4 polynucleotide kinase (Invitrogen) as described.
Transcription reactions
Transcription reactions were carried out at room temperature in a volume of 10 μl in 10 mM Tris-Cl (pH-8.0), 10 mM NaCl, 6 mM MgCl2, 5 mM DTT, 2 mM spermidine 20, 0.5 mM ATP, GTP, CTP and UTP (Trilink), 0.1 μM of either DS or PSS template and 0.3 μM RNAP. Transcripts were labeled by inclusion of 1% (v/v) [α-32 P]GTP (3000 ci/mM, 10 mCi/ml; ICN). ECs halted at +13 were formed by adding GTP, ATP, CTP and 3′-dUTP (0.5 mM) to reaction mixes containing DS template at 0.1 μM and RNAP at 0.3 μM. In some cases NaCl was added at concentrations indicated in individual figure legends. RNA synthesis was initiated by addition of RNAP. Reaction samples were taken out at indicated time intervals as reflected in the figure legends and quenched by addition of an equal volume of stop buffer (95% formamide, 20 mM EDTA, 0.01% xylene cyanol). Transcription products were resolved by electrophoresis in 20% (w/v) polyacrylamide gels (19% acrylamide, 1% bis-acrylamide, 7 M urea) in 1X TBE buffer and analyzed with a Molecular Dynamics Phosphorimager.
DNA cleavage with Fe-BABE conjugated RNAP mutants
Fe-BABE [Iron (S)-1-(p-bromoacetamidobenzyl) EDTA] (Dojindo Laboratories) was conjugated to cysteine substituted RNAPs as described 21. ICs halted at +4, +6, or +7, or ECs halted at +13 were formed at room temperature in transcription buffer containing labeled DS template at 0.01 μM and Fe-BABE conjugated RNAP at 0.03 μM. After a 10 min incubation with varying NTP mixes to form complexes halted at different positions, cleavage was initiated by addition of sodium ascorbate and H2O2 as described 21. Cleavage reactions were quenched after 5 s by addition of one reaction volume of stop buffer (95% formamide, 20 mM EDTA, 0.1% xylene cyanol). Cleavage products were analyzed by electrophoresis in denaturing 15% polyacrylamide gels (14.2% acrylamide, 0.8% bisacrylamide, and 7 M urea) and visualized by phosphorimaging. Cleavage positions were mapped in reference to Maxam-Gilbert G+A ladder prepared as described 29.
Template melting as assessed by KMnO4 foot printing
Transcription reactions were halted at +6 or +13 by inclusion of appropriate NTPs in transcription reactions (with no DTT) containing labeled DS template at 0.1 μM and RNAP at 0.3 μM. KMnO4 was then added to a concentration of 1.5 mM and allowed to react for 1 min before being quenched by addition of 1/10 reaction volume of 50% β-mercaptoethanol. Cleavage of modified nucleotides was carried out as described25. In some experiments NaCl was added to concentrations indicated in individual figure legends.
Measurement of EC stability
ECs halted +13 (EC13) were formed by adding 0.5 mM of GTP, ATP, CTP and 5μM of 3′-dUTP in transcription buffer containing DS template at 0.1 μM and RNAP at 0.3 μM. After a 5min incubation at room temperature, heparin was added to 0.2 mg/ml to prevent re-initiation. NaCl was then added to final conc. of 0, 100, or 800 mM and reactions were incubated for 2 hrs at room temperature. 30 μl of each reaction was then applied to a centricon ultrafiltration unit (Amicon) with a 100 kD MW cutoff, and centrifuged at 12 K rpm for 5 min. The filtrates and retenates were mixed with equal volumes of stop buffer and resolved by denaturing PAGE (19% acrylamide, 1% bis-acrylamide, 7 M urea) in 1X TBE buffer and analyzed with Molecular Dynamics Phosphorimager.
Acknowledgments
Supports by NIH GM52522 and Welch Grant AQ-1486 (to R.S.).
Abbreviations used
- RNAP
RNA polymerase
- nt
nucleotide or nucleotides
- T-strand
template strand
- NT-strand
Non-template strand
- IC
Initiation complex
- EC
Elongation complex
- Fe-BABE
iron (S)-1-(p-bromoacetamidobenzyl)ethylenediamine-tetraacetate
Footnotes
Publisher's Disclaimer: This is a PDF file of an unedited manuscript that has been accepted for publication. As a service to our customers we are providing this early version of the manuscript. The manuscript will undergo copyediting, typesetting, and review of the resulting proof before it is published in its final citable form. Please note that during the production process errors may be discovered which could affect the content, and all legal disclaimers that apply to the journal pertain.
References
- 1.Radman-Livaja M, Biswas T, Mierke D, Landy A. Architecture of recombination intermediates visualized by in-gel FRET of lambda integrase-Holliday junction-arm DNA complexes. Proc Natl Acad Sci U S A. 2005;102:3913–20. doi: 10.1073/pnas.0500844102. [DOI] [PMC free article] [PubMed] [Google Scholar]
- 2.Biswas T, Aihara H, Radman-Livaja M, Filman D, Landy A, Ellenberger T. A structural basis for allosteric control of DNA recombination by lambda integrase. Nature. 2005;435:1059–66. doi: 10.1038/nature03657. [DOI] [PMC free article] [PubMed] [Google Scholar]
- 3.Watson J, Hays FA, Ho PS. Definitions and analysis of DNA Holliday junction geometry. Nucleic Acids Res. 2004;32:3017–27. doi: 10.1093/nar/gkh631. [DOI] [PMC free article] [PubMed] [Google Scholar]
- 4.Van Duyne GD. Lambda integrase: armed for recombination. Curr Biol. 2005;15:R658–60. doi: 10.1016/j.cub.2005.08.031. [DOI] [PubMed] [Google Scholar]
- 5.Ramstein J, Lavery R. Energetic coupling between DNA bending and base pair opening. Proc Natl Acad Sci U S A. 1988;85:7231–5. doi: 10.1073/pnas.85.19.7231. [DOI] [PMC free article] [PubMed] [Google Scholar]
- 6.Seibert E, Ross JB, Osman R. Contribution of opening and bending dynamics to specific recognition of DNA damage. J Mol Biol. 2003;330:687–703. doi: 10.1016/s0022-2836(03)00598-9. [DOI] [PubMed] [Google Scholar]
- 7.Yin YW, Steitz TA. Structural basis for the transition from initiation to elongation transcription in T7 RNA polymerase. Science. 2002;298:1387–95. doi: 10.1126/science.1077464. [DOI] [PubMed] [Google Scholar]
- 8.Tahirov TH, Temiakov D, Anikin M, Patlan V, McAllister WT, Vassylyev DG, Yokoyama S. Structure of a T7 RNA polymerase elongation complex at 2.9 A resolution. Nature. 2002;420:43–50. doi: 10.1038/nature01129. [DOI] [PubMed] [Google Scholar]
- 9.Cheetham GM, Steitz TA. Structure of a transcribing T7 RNA polymerase initiation complex. Science. 1999;286:2305–9. doi: 10.1126/science.286.5448.2305. [DOI] [PubMed] [Google Scholar]
- 10.Tang GQ, Patel SS. T7 RNA polymerase-induced bending of promoter DNA is coupled to DNA opening. Biochemistry. 2006;45:4936–46. doi: 10.1021/bi0522910. [DOI] [PubMed] [Google Scholar]
- 11.Tang GQ, Patel SS. Rapid binding of T7 RNA polymerase is followed by simultaneous bending and opening of the promoter DNA. Biochemistry. 2006;45:4947–56. doi: 10.1021/bi052292s. [DOI] [PubMed] [Google Scholar]
- 12.Turingan RS, Liu C, Hawkins ME, Martin CT. Structural confirmation of a bent and open model for the initiation complex of T7 RNA polymerase. Biochemistry. 2007;46:1714–23. doi: 10.1021/bi061905d. [DOI] [PMC free article] [PubMed] [Google Scholar]
- 13.Shi YB, Gamper H, Hearst JE. Interaction of T7 RNA polymerase with DNA in an elongation complex arrested at a specific psoralen adduct site. J Biol Chem. 1988;263:527–34. [PubMed] [Google Scholar]
- 14.Guo Q, Sousa R. Multiple roles for the T7 promoter nontemplate strand during transcription initiation and polymerase release. J Biol Chem. 2005;280:3474–82. doi: 10.1074/jbc.M412287200. [DOI] [PubMed] [Google Scholar]
- 15.Guo Q, Sousa R. Weakening of the T7 promoter-polymerase interaction facilitates promoter release. J Biol Chem. 2005;280:14956–61. doi: 10.1074/jbc.M500518200. [DOI] [PubMed] [Google Scholar]
- 16.Temiakov D, Mentesana PE, Ma K, Mustaev A, Borukhov S, McAllister WT. The specificity loop of T7 RNA polymerase interacts first with the promoter and then with the elongating transcript, suggesting a mechanism for promoter clearance. Proc Natl Acad Sci U S A. 2000;97:14109–14. doi: 10.1073/pnas.250473197. [DOI] [PMC free article] [PubMed] [Google Scholar]
- 17.Huang J, Sousa R. T7 RNA polymerase elongation complex structure and movement. J Mol Biol. 2000;303:347–58. doi: 10.1006/jmbi.2000.4150. [DOI] [PubMed] [Google Scholar]
- 18.Temiakov D, Anikin M, McAllister WT. Characterization of T7 RNA polymerase transcription complexes assembled on nucleic acid scaffolds. J Biol Chem. 2002;277:47035–43. doi: 10.1074/jbc.M208923200. [DOI] [PubMed] [Google Scholar]
- 19.Greiner DP, Miyake R, Moran JK, Jones AD, Negishi T, Ishihama A, Meares CF. Synthesis of the protein cutting reagent iron (S)-1-(p-bromoacetamidobenzyl)ethylenediaminetetraacetate and conjugation to cysteine side chains. Bioconjug Chem. 1997;8:44–8. doi: 10.1021/bc9600731. [DOI] [PubMed] [Google Scholar]
- 20.Mukherjee S, Brieba LG, Sousa R. Structural transitions mediating transcription initiation by T7 RNA polymerase. Cell. 2002;110:81–91. doi: 10.1016/s0092-8674(02)00815-2. [DOI] [PubMed] [Google Scholar]
- 21.Mukherjee S, Brieba LG, Sousa R. Discontinuous Movements and Conformational Isomerizations During Pausing and Termination by T7 RNA Polymerase. Embo J. 2003;22:6483–93. doi: 10.1093/emboj/cdg618. [DOI] [PMC free article] [PubMed] [Google Scholar]
- 22.Guo Q, Nayak D, Brieba LG, Sousa R. Major conformational changes during T7RNAP transcription initiation coincide with, and are required for, promoter release. J Mol Biol. 2005;353:256–70. doi: 10.1016/j.jmb.2005.08.016. [DOI] [PubMed] [Google Scholar]
- 23.Villemain J, Guajardo R, Sousa R. Role of open complex instability in kinetic promoter selection by bacteriophage T7 RNA polymerase. J Mol Biol. 1997;273:958–77. doi: 10.1006/jmbi.1997.1358. [DOI] [PubMed] [Google Scholar]
- 24.Stano NM, Levin MK, Patel SS. The +2 NTP binding drives open complex formation in T7 RNA polymerase. J Biol Chem. 2002;277:37292–300. doi: 10.1074/jbc.M201600200. [DOI] [PubMed] [Google Scholar]
- 25.Brieba LG, Sousa R. The T7 RNA polymerase intercalating hairpin is important for promoter opening during initiation but not for RNA displacement or transcription bubble stability during elongation. Biochemistry. 2001;40:3882–90. doi: 10.1021/bi002716c. [DOI] [PubMed] [Google Scholar]
- 26.Stano NM, Patel SS. The intercalating beta-hairpin of T7 RNA polymerase plays a role in promoter DNA melting and in stabilizing the melted DNA for efficient RNA synthesis. J Mol Biol. 2002;315:1009–25. doi: 10.1006/jmbi.2001.5313. [DOI] [PubMed] [Google Scholar]
- 27.Yin YW, Steitz TA. The structural mechanism of translocation and helicase activity in T7 RNA polymerase. Cell. 2004;116:393–404. doi: 10.1016/s0092-8674(04)00120-5. [DOI] [PubMed] [Google Scholar]
- 28.Temiakov D, Patlan V, Anikin M, McAllister WT, Yokoyama S, Vassylyev DG. Structural basis for substrate selection by t7 RNA polymerase. Cell. 2004;116:381–91. doi: 10.1016/s0092-8674(04)00059-5. [DOI] [PubMed] [Google Scholar]
- 29.Deep S, Im SC, Zuiderweg ER, Waskell L. Characterization and calculation of a cytochrome c-cytochrome b5 complex using NMR data. Biochemistry. 2005;44:10654–68. doi: 10.1021/bi050482x. [DOI] [PMC free article] [PubMed] [Google Scholar]