

Abstract
Background
Despite availability of several mapping technologies to investigate the electrophysiological mechanisms of atrial fibrillation (AF), an experimental tool enabling high resolution mapping of electrical impulse on the endocardial surface of the left atrium is still lacking.
Objective
To present a new optical mapping approach implementing a steerable cardio-endoscope in isolated hearts.
Methods
The system consists of a direct or side-view endoscope coupled to a 532 nm excitation Laser for illumination, and to a CCD camera for imaging of potentiometric dye fluorescence (DI-4-ANEPPS, 80×80 pixels, 200–800 frames/sec). The cardio-endoscope was aimed successively at diverse posterior left atrial (PLA) locations to obtain high resolution movies of electrical wave propagation, as well as detailed endocardial anatomical features, in the presence and the absence of atrial stretch.
Results
We present several examples of high resolution endoscopic PLA recordings of wave propagation patterns during both sinus rhythm and AF with signal-to-noise ratio similar to conventional optical mapping systems. We demonstrate the endoscope’s ability to visualize highly organized AF sources (rotors) at specific locations on the PLA and PLA-pulmonary vein junctions, and present video images of waves emanating from such sources as they propagate into pectinate muscles in the LA appendage. In particular, we demonstrate this approach to be ideally suited for studying the effects of atrial stretch on AF dynamics.
Conclusions
In isolated hearts, cardio-endoscopic optical mapping of electrical activity should enable comprehensive evaluation of atrial fibrillatory activity in the PLA, of the role of the local anatomy on AF dynamics and of the efficacy of pharmacological and ablative interventions.
INTRODUCTION
Atrial fibrillation (AF) is the most common sustained arrhythmia seen in clinical practice. Catheter-based radiofrequency ablation aimed at the posterior left atrium (PLA) has emerged as a potentially effective alternative therapy for patients with drug-refractory AF.1,2 Clinical studies in patients with either paroxysmal or permanent AF have demonstrated the curative potential of ablative lesions performed around and between anatomical markers such as pulmonary vein (PV) ostia, mitral isthmus, ridge between left superior pulmonary vein and left atrial appendage (LAA) and inter-atrial septum. However, the choice of optimal lesion lines and the underlying mechanisms of AF remain unclear. Animal experiments aiming at further investigating AF mechanisms have emphasized the role of spatiotemporally periodic patterns within or at the vicinity of the PLA as possible sources that sustain AF.3–5 However, those studies were performed using preparations that were either isolated or anatomically altered. As such, they could not allow a full evaluation of the role of various atrial regions during impulse propagation. To better understand the mechanisms underlying AF, and because of the existing experimental limitations described above, we have constructed a new endoscopic optical mapping approach that improves accessibility to all atrial regions in intact isolated hearts. Here, we demonstrate the feasibility of using this novel approach to correlate the patterns of electrical propagation with the atrial anatomy during both sinus rhythm (SR) and AF. We further exemplify the value of this approach to study AF dynamics in a well-established atrial stretch-related AF model.6;7 This new cardio-endoscopic approach stands optimally to yield high resolution mapping of wave propagation on the endocardial surface of the PLA.
MATERIAL AND METHODS
Stretch-Induced AF Model
Animals were used according to National Institutes of Health guidelines. Young sheep (18–25 kg) were anesthetized with pentobarbital (35 mg/kg IV). Hearts were removed, placed in cold cardioplegic solution, and connected to a Langendorff apparatus. The coronary arteries were continuously perfused at 200 mL/min via a cannula in the aortic root with warm (36 to 38° C) Tyrode’s solution (pH 7.4) equilibrated with 95% A well-characterized model of stretch-related AF was adapted to the sheep heart as described O2/5% CO2. previously.6;7 After perforation of the interatrial septum, all venous orifices were closed except for the inferior vena cava. Intra-atrial pressure was monitored by a digital pressure sensor connected through a T- cannula to an open-ended tube that was inserted into the inferior vena cava. By changing the height of the open end of the tube, we controlled the intra-atrial pressure.6 Ventricular fibrillation was induced and intra- atrial pressure was raised above 10 cm H2O. As previously reported, this approach yielded 100% AF inducibility and sustained episodes of AF (> 1 hour) without perfusion of acetylcholine.7 For mapping, boluses of a voltage sensitive fluorescence dye (Di-4-ANEPPS) and, in a subset of experiments 15 mM diacetyl-monoxime to abolish motion artifacts were injected into the perfusate as described previously.8
Endoscopic Fluorescence Mapping Set-up
The cardio-endoscopic mapping system is schematically described in Figure 1. Its principal component is a dual-channel flexible and steerable endoscope. To achieve fluorescence mapping of cardiac impulses the endoscope is coupled to an excitation 532 nm Laser (1–5 W, CW Diode-pumped, Millenia Pro 5sJ, Spectra Physics, Inc.) at the proximal end of the illuminating channel (green arrow) and to a 14 bit CCD camera (SciMeasure, Inc) with a 2×2 mm2 chip size. The camera is C-coupled with a 12 mm, 1:1.4 maximal N.A. and 2/3” diagonal field focusing lens to a 645±50 nm band-pass filter and to the eyepiece of the imaging channel (red arrow). The following endoscopes were chosen for mapping the different regions of the LA: (i) a sigmoidoscope (Pentax, Inc., FS-34P2) of 11.5 mm diameter, 120° field of view and 63 cm working length. This endoscope features a deflectable direct view tip (Figure 1, upper right panel) with angulations of 180°/180° (up/down) and 160°/160° (right/left) or (ii) a therapeutic duodenoscope (Olympus, Inc. JF1T) of 11.0 mm diameter, 80° field of view and 103 cm working length. This endoscope features a deflectable side view tip (Figure 1, lower right panel) with angulations of 130°/130° up/down and 90°/90° right/left. Endoscopes showed transmittance of about 13% and 11%, respectively, as assessed by a 532 nm laser input in the range of 0.2–5W with a digital power meter (FieldMaster-GS, Coherent, Inc.).
Figure 1.
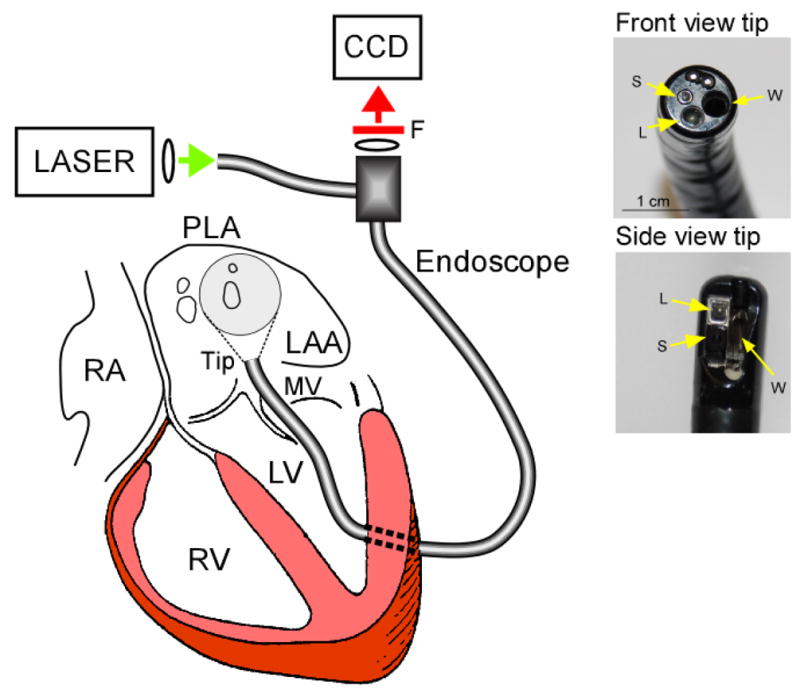
Left, Experimental set-up showing the dual-channel cardio-endoscope inserted in the LA though a minimal left ventricular opening and across the mitral valve (MV). Right, Deflectable direct-view and side-view tips and the corresponding working (W), light delivery (L) and acquisition (S) channels.
Mapping Protocols
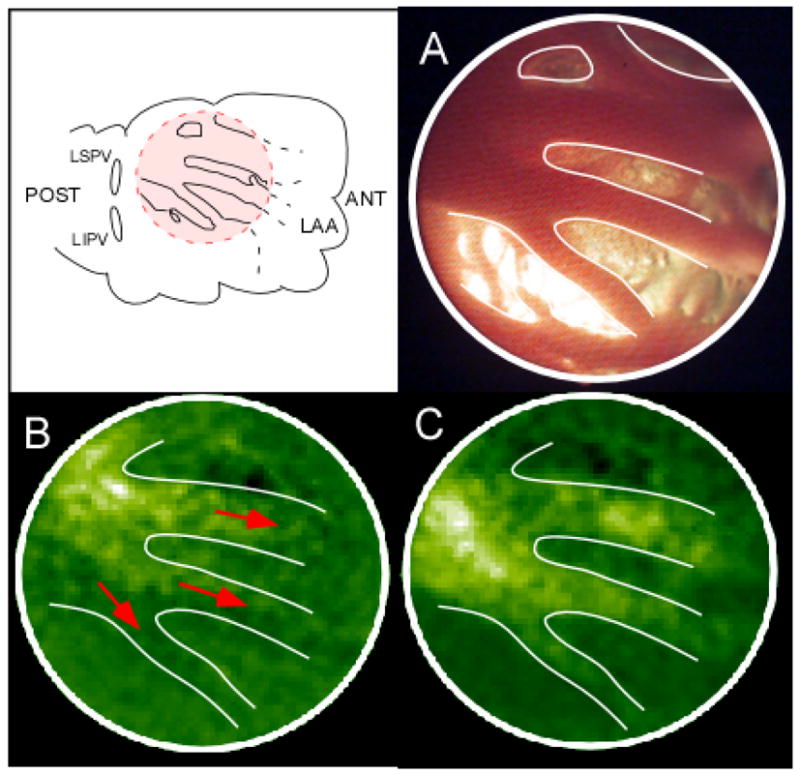
A small cut was made in the left ventricle, carefully avoiding any visible coronary branches, to introduce the endoscope into the left atrium (LA) through the mitral valve. A digital camera (Kodak Professional, DCS 300, Nikor 50 mm f 1.4 D) was connected to the recording port of the endoscope to adjust the endoscope tip and provide clear images of the mapped region inside the intact LA. For enhanced detection of the anatomical details we used external ambient illumination in addition to the internal white illumination that replaced the Laser light source as needed. In Figure 2 we show in realistic colors the still-camera registration of the endocardial anatomy as seen through the endoscope in 3 sample regions of the same heart: The PLA with a view of the PV ostia (Panel A), the roof (Panel B) and the LAA (Panel C). Five-sec movies (di-4-ANEPPS, 80×80 pixels, 200–800 frames/sec) were recorded during SR after the endoscope was aligned to visualize the PLA and other left atrial locations. Then, the intra-atrial pressure was set above 10 cm H2O and sustained AF was readily induced by burst pacing (10 Hz, 10 sec, 5 ms pulse duration, twice threshold). Thereafter the endoscope was steered to record 5-sec movies from the roof and the LAA. In most cases, the Kodak camera was subsequently connected to the eyepiece of the endoscope and color pictures were acquired using large opening times (1/3 to 1/30 sec). It was also possible to visualize the anatomy based upon the background fluorescence image created from the temporal average of the movies as previously described.9 For visualization of the electrical activation, movies were processed with background subtraction, 5-point spatiotemporal averaging, high-pass filtering, as previously described,3 and additional sequential frames subtraction for the AF movies. To correct for motion artifacts during AF and SR, we also applied a retrospective de-morphing algorithm based on a template-matching technique as described previously by Bagwe et al.9 (see Figure 2 in the online supplement of reference9). Online movie 1 shows the activity at the PLA during SR; comparison of the corrected and non-corrected movies demonstrates the efficient removal of most of the motion artifacts by this method. It should be noted that the presence of various endocardial anatomical structures, makes the template-matching algorithm for the endoscopic mapping more effective than for the epicardial mapping.
Figure 2.
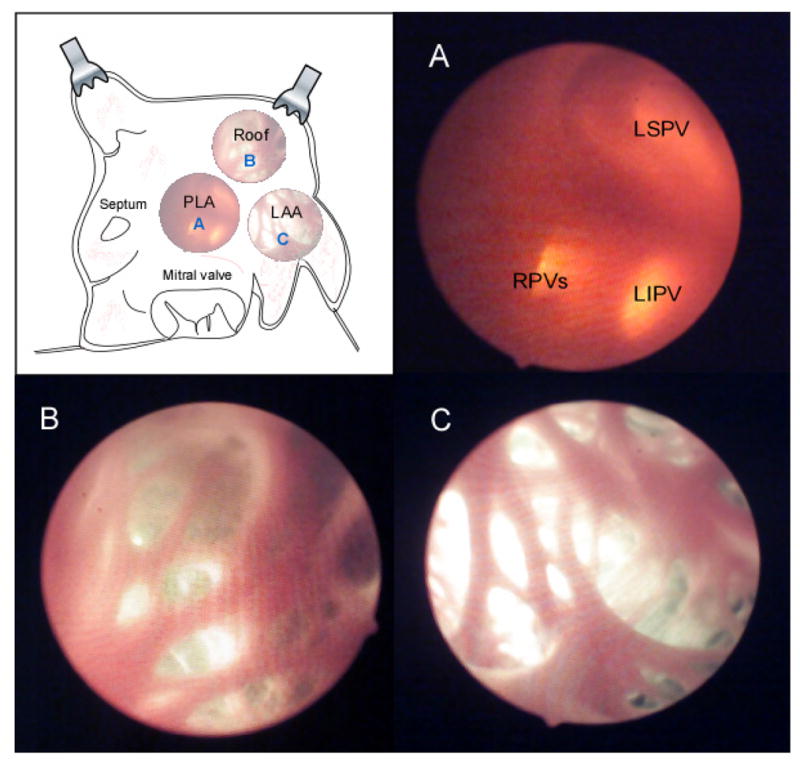
For illustration purposes, the areas that were imaged by the cardio-endoscope in intact atria, are represented after surgical opening and exposure of anatomical features. Three successive views of the PLA in the same heart were obtained by roving the deflectable tip of the endoscope. A: PLA view. B: Roof view. C: LAA view.
Signal-to-Noise Ratio Evaluation
The endoscopic mapping system was compared with the direct mapping system by evaluating their respective signal-to-noise ratios (SNRs) during SR and AF. The direct mapping system consisted of the same camera and light source used for the endoscope but arranged in a conventional epifluorescence setting to image the PLA through a minimal LAA incision.10 In both approaches, signal levels for the respective SR and AF movies were determined as the peak-to-peak amplitude minus twice the noise level. On the other hand, noise levels were calculated as the standard deviation of the peak-to-peak amplitude during quiescent episodes of background subtracted movies for SR, and of background and sequentially subtracted movies for AF.9 Pixel-by-pixel SNRs were combined in maps generated for both unfiltered and filtered (see above) background subtracted data. The SNR of the direct system was determined for movies during both SR and cholinergic AF (0.5 μM ACh) and analyzed as described above. SNR histograms for the pixels in the maps were generated and average SNR values were calculated for the full width half height (FWHH) range.
RESULTS
Representative cardio-endoscopic images of LA activation during SR are presented in Figure 3. The leftmost image in panel A shows a snapshot of the background fluorescence with the anatomical details of the posterior-lateral LA including the left inferior pulmonary vein ostium (LIPV), pectinate muscle (PM) and free wall and PLA junction (J). This field of view is located between those shown as A and C in Figure 2. However, unlike Figure 2, the anatomical picture in Figure 3 was obtained by the integral CCD camera. Frames 19 to 26 in Figure 3 are the average sinus activations taken every 3.33 ms from a fluorescence movie after background subtraction (see online movies 2 and 3 for averaged and non-averaged SR activation fluorescence recordings, respectively). The grey scale indicates membrane potential level; resting tissue appears in black and excited tissue in white. Labels a-c on frame 19 indicate the locations of the single pixel recordings shown in panel B. The excellent signal-to-noise ratio of such traces clearly allows detection of the membrane potential changes during SR. The SR color activation map, constructed by measuring the time at which the action potential upstroke reaches 50% amplitude at each pixel location is shown on the right side of Panel B. It shows the impulse traveling from the top right to the lower left edge of the field of view, in a general direction from the roof of the appendage towards the lower septal part of the PLA. This septal-bound propagation direction in the PLA is consistent with previous description of SR activation patterns in humans using a non-contact mapping system11 and supports the relevance of our mapping approach.
Figure 3.
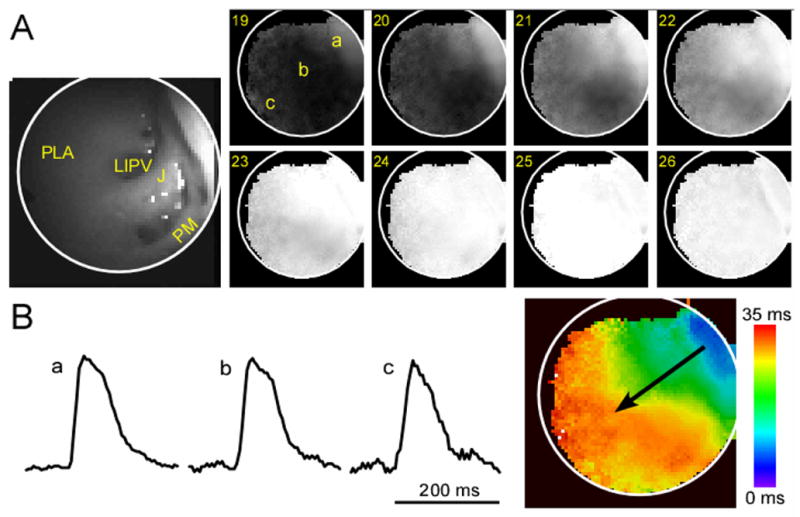
A: Fluorescence image of the lower PLA-appendage junction including the LIPV ostium and pectinate muscles (PM) and consecutively obtained frames of an ensemble-averaged movie of sinus impulse propagation. The increased fluorescence of the wavefront is depicted in white while the resting state is in black. Frame numbers are indicated on the upper left corner of each snapshot (300 fr/sec). B: Single pixel recordings at locations A, B and C (arbitrary units, a.u, of fluorescence) and activation map corresponding to the sinus wave propagation (the direction of activation is shown by a black arrow).
Figure 4 and online movie 4 show an example of left atrial impulse propagation during stretch-related AF. The tip of the endoscope was directed toward the PLA roof at its junction with the LAA (Figure 4A), in the vicinity of the ridge of the left superior PV (LSPV, similar to location B in Figure 2 but seen through the CCD in grayscale). Spatiotemporally organized waves were observed during most of the 5-sec movie. A phase movie (action potential phases were color coded according to the inset) snapshot depicts a micro-reentrant wave rotating counter-clockwise at a frequency of 11.7 Hz (Figure 4B). As shown by the single pixel recording in panel C, this rotor exhibited regular deflections. The rotational activity transformed into spatiotemporally organized waves traveling in the septal direction. Figure 4D shows 4 sequential patterns of activation with the same direction and averaged interbeat cycle length of 74 ms. In addition to being able to image spatiotemporally repetitive AF waves originating from the PLA-LAA junction, we could also record impulses emanating from this location and traveling into the pectinate muscles. In Figures 5B and 5C, we present an example of propagation of AF waves through LAA pectinate muscle bundles, at their connection with the PLA (diagram and panel A of Figure 5). As can also be observed in the online movie 5, most of the waves propagated in the direction PV-to-LAA (posterior to anterior) as we previously reported with a similar AF model and epicardial mapping.7 Also similar to that previous study is the finding that some of the waves propagated in the opposite direction (LAA-to-PV) or else traveled vertically from to top to bottom of the field-of-view (see online movie 5). Interestingly, some of the wavefronts were substantially delayed as they propagated through the lowest pectinate bundle in comparison with the 2 higher bundles in view. Overall, the endocardial data shown in Figures 4 and 5 add significantly to the epicardial data already published.7 They establish the fact that in addition to being a source for LAA-bound activity, as previously shown in epicardial recordings, 7 the PLA-LAA roof junction also generates oppositely PLA-bound activity, as shown endocardially in Figure 5.
Figure 4.
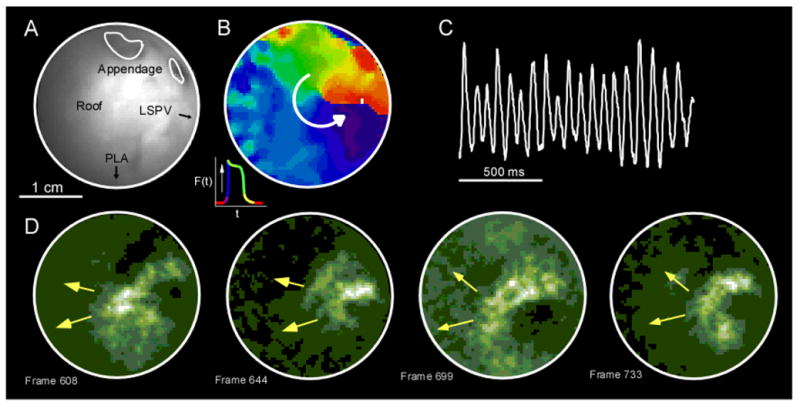
A: Endoscopic view of the junction between the roof, the LSPV ridge and the LAA (view B in Figure 2). B: Clockwise micro-reentrant activity in a snapshot from a phase movie (phases color coded according to the inset). C: A single pixel recording in this area exhibited very regular deflections. D: This activity transitioned into spatio-temporally organized waves traveling in the septal direction (fluorescent movie, lower panels).
Figure 5.
A: Propagation on pectinate muscles. The tip of the endoscope is focused on the red-shaded area at the junction between the PLA and LAA. B, C: Two consecutive florescence snapshots showing propagation of the wavefront through 3 neighboring pectinate muscles bundles. ANT, anterior; POST, posterior.
Radio-Frequency (RF) Ablation at the PLA
Direct visualization of the anatomical structure and the electrical activity through the same endoscope should improve guidance of ablation procedures. The left panel of Figure 6 shows the tip of an ablative catheter (4F, 105 cm, Biosense Webster, Inc.) introduced through the working channel and viewed through the optical channel of the endoscope. The center panel shows an isochrone map. Before the ablation catheter was inserted into the endoscope, activation of the PLA during SR consisted of an extended breakthrough that spanned from the center of the PLA, close to the LSPV ostium, to the septum.11 Thereafter, the catheter was introduced into the endoscope and following electrode-tissue contact verification, 30–35 W of RF energy was delivered for 30–60 sec while the tip was dragged on the upper part of the PLA (right panel; hatched area). As shown by the right panel, application of RF, dramatically changed the SR impulse propagation pattern. The activity appeared at the RIPV area and then traveled in the septum-to-LAA direction.
Figure 6.
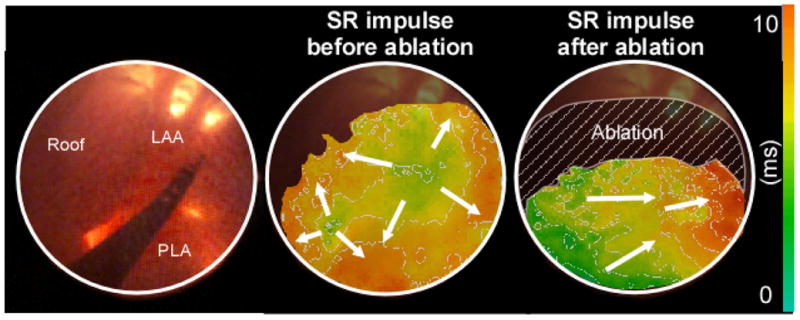
Visualization of the RF energy delivery effect on SR impulse propagation at the PLA. Left panel: ablation catheter introduced through the working channel of the endoscope and seen through its optical channel. Center panel: Activation map of a SR impulse before ablation. Right panel: Activation map of a SR impulse after RF delivery inside the hatched area.
SNR Evaluation
Figure 7A presents SNR maps constructed after pixel-by-pixel analysis during AF after filtration of the signal for the endoscopic system (left) and the direct mapping system (right) in 2 different hearts. In general, the SNR of the cardio-endoscopic recording is more homogeneous than the SNR of the direct mapping recording, except for the upper area that corresponds to the PLA-roof transition. This difference in distribution of SNR may be attributed to the different orientation of the excitation light beam relative to the optical axis of the objectives in the 2 systems. Figure 7B shows the SNR histogram for the 2 maps shown in Figure 7A and also from additional SNR maps obtained for unfiltered, raw movies (see Methods). Comparison between the histograms of the 2 systems shows that they generally overlap. The table in Figure 7C demonstrated that during AF the average unfiltered SNRs are 2.9 and 3.1 and 25.3 and 26.8 after filtration, respectively for the endoscopic and direct systems. Also shown in this table are data obtained during SR (unfiltered average SNRs were 4.1 vs. 8.8 for endoscopic and direct system, respectively, and 35 vs. 39.2 for filtered data). Overall, the SNR achieved for the cardio-endoscopic system is only slightly lower than the direct mapping system. In fact, during AF the difference is negligible. This demonstrates that the cardio-endoscopic device permits adequate conditions for mapping.
Figure 7.
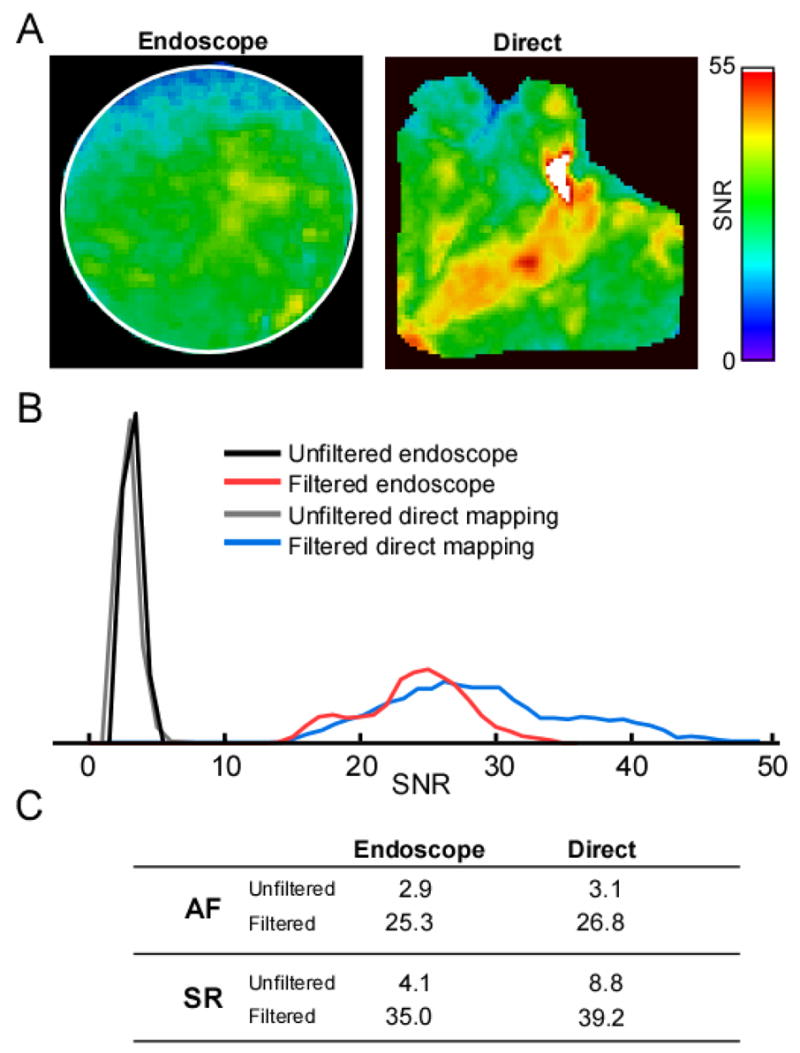
A: SNR maps for filtered AF movies recorded from the PLA with the endoscopic mapping device (left panel) and recorded using a conventional optical mapping system from a similar area after having opened the LAA (right panel). In the endoscopic map, black pixels represent pixels outside the circular field of view; in the direct map, black pixels are pixels outside the PLA and below 10% of maximal amplitude. B: SNR histograms during AF for unfiltered (maps not shown) and filtered data (maps in A; black pixels excluded) obtained for the endoscopic and direct mapping. C: Table listing the SNR averages calculated from the FWHH range in the histogram for each condition. SNR averages for AF correspond to data presented in panel B.
DISCUSSION
We have introduced a novel approach for mapping endocardial electrical activity during AF in the isolated but otherwise intact heart. The mapping system utilizes a flexible and steerable endoscope coupled to a high resolution CCD camera for fluorescence imaging in isolated sheep hearts. It allows simultaneous endocardial visualization of the anatomy and the spatiotemporal activation patterns. Its SNR is comparable to that of direct epifluorescence mapping, with the advantage that the endoscope allows the experimenter to scan the endocardial surface of the atria and focus on different regions to explore special areas of interest. We present strong evidence that this technique is a valuable tool to map cardiac electrical activity during both SR and AF in large animal atria with access to regions that are not accessible from the epicardium. Previously, angioscopes were evaluated for the recording of low resolution (nine-pixel array) fluorescence-related epicardial electrical activity.12 However, to the best of our knowledge this is the first time that an imaging approach enables anatomy and activation mapping on the endocardium with a spatiotemporal resolution that allows the study of wave propagation in the intact atria.
General Experimental Perspective
The use of a cardio-endoscopic device equipped with high-resolution potentiometric dye fluorescence mapping capabilities should prove useful as an investigative tool in the analysis and quantification of wave propagation at varying locations of the left atrial endocardium. It should complement existing epicardial experimental setups and make it possible to test hypotheses regarding mechanisms and therapy of AF. The new endoscopic approach makes use of readily available components with considerations of specific optical and mechanical properties. First, an endoscope should have a combination of optical properties including sufficient SNR and spatiotemporal resolving power to allow quantification of wave propagation. By using endoscopes with greater than 11% transmittance in the relevant ranges we were able to achieve a SNR greater than 25. This SNR is less than 10% smaller than the SNR of a direct mapping system using the same light source and camera, which demonstrates the endoscope’s excellent potential. One of the possible explanations that the endoscope’s SNR is comparable to the direct mapping system despite its marked reduced light transmittance is the significantly smaller distance (~1 cm) between the endoscopic objective lens and the tissue surface.. For better mechanical control we use endoscopes that are flexible and steerable, but also have a locking ability, which is important for stabilization. We introduce the endoscope to the LA via a minimal incision in the left ventricular free wall. It is foreseeable that additional engineering developments in the future should lead to the implementation of smaller diameter fluorescence endoscopes (4 to 6 mm, in comparison with the ~11 mm currently used) that could be introduced via a caval route and transeptal puncture to image the LA. The presence of a working channel for introduction of recording and ablation catheters helped maximize the applicability of the system used. Finally, we preferred to use endoscopes with as wide a field of view as possible for both the front and side view endoscopes with focal depth ranging from a few millimeters to a couple of centimeters. This is the typical distance range between the objective of the endoscope and the endocardial wall.
Notwithstanding some practical complexity, there are several clear advantages to the use of the endoscopic system over conventional direct epifluorescence mapping systems. First, the new approach allows studying impulse propagation in regions that are inaccessible to direct mapping. Second, the recordings are obtained in an intact heart that is significantly devoid of impaired perfusion and artificial boundaries and amenable for intra-atrial pressure and temperature control. Third, it enables the design of highly clinically relevant mapping studies that may correlate much better than conventional optical mapping with the common intracardiac electrophysiological studies done in patients. Fourth, because fat is less abundant on the endocardium than the epicardium, it is foreseeable that the endoscopic method will permit simultaneous electrical mapping from both surfaces. Finally because the complex endocardial anatomy provides better spatial markers, the endoscopic approach permits highly efficient retrospective motion correction.
New Mapping Approach: Relevance for the investigation of the Mechanisms of AF maintenance
Clinical and experimental results have suggested that AF is maintained by highly localized electrical sources that activate the atria at exceedingly high frequencies.3; 13; 14 At least in patients with paroxysmal AF, such sources seem to localize preferentially at or near the junctions between the pulmonary veins and the PLA. Since the initial work by Haïssaguerre and coworkers, 1; 2 catheter ablation in the area of the PLA has emerged has a therapeutic alternative for patients with drug-refractory AF. Nevertheless, the treatment has variable success and is not devoid of complications. 15 One of the major limitations of currently available ablation techniques is the difficulty of visualizing AF activity in real time or with sufficient spatial resolution to accurately determine the location of potential sources. For example, the electroanatomical approach (Carto®, Biosense Webster Inc.) has been successful in presenting electrical data on an approximated endocardial surface of the atria, but requires sequential mapping of the electrical activity and does not allow more than a few simultaneous recording sites. The non-contact mapping approach (Ensite®, Endocardial Solutions Inc), on the other hand, relies on multiple simultaneous recording points (64 unipolar non-contact electrodes) to superimpose virtual unipolar electrode data on a low resolution anatomical description of the endocardial surface. It does not permit localization of micro-reentrant sources. 16;17
Previously, experimental models associated with various electrical mapping modalities have contributed to a better understanding of AF mechanisms. For instance, Arora et al. have utilized an isolated biatrial model to investigate wave dynamics at the endocardial junction between the pulmonary veins and the atria.5 Also, Hocini et al, used an isolated heart with incised pulmonary veins to show that fiber orientation changes at the PV-LA junction play a key role in the occurrence of conduction disturbances.4 In addition, open chest or isolated heart experiments utilizing epicardial mapping technologies have also markedly contributed to AF understanding. For instance, the presence of micro-reentrant activity in the pulmonary vein area and some of the mechanisms of stretch-related AF and calcium-related spontaneous activity were investigated using these models3; 17;18As useful as the aforementioned preparations have been in providing new insight into mechanisms of left atrial AF initiation and maintenance, one of their major limitations is the impossibility of exploring impulse propagation in realistic anatomical conditions. Thus, an experimental model that allows imaging of the electrical impulse propagation in the intact LA, with relevant anatomical and pressure conditions, is highly desirable. Here, we present for the first time a cardio-endoscopic optical mapping system that greatly increases accessibility to all atrial regions in the isolated but otherwise intact heart. This should enable us to better correlate the patterns of electrical propagation with the corresponding anatomical structures and could help evaluate ablative or pharmacological interventions at the LA. For instance, the SR patterns of propagation appearing as a right PVs ostium breakthrough (as shown figure 6) or as a retrograde left atrial appendage impulse confirm previous data presented in humans.11 Similarly, the presence of micro-reentrant activity during stretch-related AF at the PLA-LAA junction is in good accordance with a previous work that mapped the corresponding region on the epicardium.7
Endoscopic Mapping and Stretch-Related AF Model
While we obtained movies from the LA during AF and SR in conventional Langendorff-perfused sheep hearts in the unstretched atria, the application of stretch in this model yielded 2 major positive outcomes. First, increasing the left atrial pressure above 10 cm H2O rendered AF readily inducible without the utilization of acetylcholine. Second, the resultant anatomical expansion facilitated the process of repositioning the endoscope to visualize various areas of the LA through maneuvering the endoscopic deflection and orientation. Further, the increased intra-atrial pressure forced most air bubbles out of the LA, hence reducing optical distortion. Thus, we consider that this cardio-endoscopic approach is ideally suited to investigate stretch-related arrhythmias.
Limitations
At the moment, available technology precludes optical mapping of cardiac electrical activity in-situ. While some components of the technology are now available,19; 20 notably the absence of voltage sensitive dye that is not photo-toxic and satisfies the optical requirements is a critical factor. Certainly cardio-endoscopic optical mapping of electrical activity in whole animals and in humans will require a research effort of significant proportions.
Supplementary Material
Acknowledgments
Supported by grants from the NHLBI (P01-HL39707; R01-HL70074; R01-HL60843, J.J.), American Heart Association post-doctoral fellowship (J.K) and SDG (0230311N, O.B). We thank Jianling Deng and Jiang Jiang for their technical assistance.
Footnotes
Publisher's Disclaimer: This is a PDF file of an unedited manuscript that has been accepted for publication. As a service to our customers we are providing this early version of the manuscript. The manuscript will undergo copyediting, typesetting, and review of the resulting proof before it is published in its final citable form. Please note that during the production process errors may be discovered which could affect the content, and all legal disclaimers that apply to the journal pertain.
REFERENCE LIST
- 1.Jais P, Haissaguerre M, Shah DC, Chouairi S, Gencel L, Hocini M, Clementy J. A focal source of atrial fibrillation treated by discrete radiofrequency ablation. Circulation. 1997;95:572–6. doi: 10.1161/01.cir.95.3.572. [DOI] [PubMed] [Google Scholar]
- 2.Haissaguerre M, Jais P, Shah DC, Takahashi A, Hocini M, Quiniou G, Garrigue S, Le Mouroux A, Le Metayer P, Clementy J. Spontaneous initiation of atrial fibrillation by ectopic beats originating in the pulmonary veins. N Engl J Med. 1998;339:659–66. doi: 10.1056/NEJM199809033391003. [DOI] [PubMed] [Google Scholar]
- 3.Mandapati R, Skanes A, Chen J, Berenfeld O, Jalife J. Stable microreentrant sources as a mechanism of atrial fibrillation in the isolated sheep heart. Circulation. 2000;101:194–9. doi: 10.1161/01.cir.101.2.194. [DOI] [PubMed] [Google Scholar]
- 4.Hocini M, Ho SY, Kawara T, Linnenbank AC, Potse M, Shah D, Jais P, Janse MJ, Haissaguerre M, De Bakker JM. Electrical conduction in canine pulmonary veins: electrophysiological and anatomic correlation. Circulation. 2002;105:2442–8. doi: 10.1161/01.cir.0000016062.80020.11. [DOI] [PubMed] [Google Scholar]
- 5.Arora R, Verheule S, Scott L, Navarrete A, Katari V, Wilson E, Vaz D, Olgin JE. Arrhythmogenic Substrate of the Pulmonary Veins Assessed by High- Resolution Optical Mapping. Circulation. 2003;107:1816–21. doi: 10.1161/01.CIR.0000058461.86339.7E. [DOI] [PMC free article] [PubMed] [Google Scholar]
- 6.Ravelli F, Allessie M. Effects of atrial dilatation on refractory period and vulnerability to atrial fibrillation in the isolated Langendorff-perfused rabbit heart. Circulation. 1997;96:1686–95. doi: 10.1161/01.cir.96.5.1686. [DOI] [PubMed] [Google Scholar]
- 7.Kalifa J, Jalife J, Zaitsev AV, Bagwe S, Warren M, Moreno J, Berenfeld O, Nattel S. Intra-atrial pressure increases rate and organization of waves emanating from the superior pulmonary veins during atrial fibrillation. Circulation. 2003;108:668–71. doi: 10.1161/01.CIR.0000086979.39843.7B. [DOI] [PubMed] [Google Scholar]
- 8.Baxter WT, Davidenko JM, Loew LM, Wuskell JP, Jalife J. Technical features of a CCD video camera system to record cardiac fluorescence data. Ann Biomed Eng. 1997;25:713–25. doi: 10.1007/BF02684848. [DOI] [PubMed] [Google Scholar]
- 9.Bagwe S, Berenfeld O, Vaidya D, Morley GE, Jalife J. Altered right atrial excitation and propagation in connexin40 knockout mice. Circulation. 2005;112:2245–53. doi: 10.1161/CIRCULATIONAHA.104.527325. [DOI] [PMC free article] [PubMed] [Google Scholar]
- 10.Kalifa J, Tanaka K, Zaitsev AV, Warren M, Vaidyanathan R, Auerbach D, Pandit S, Vikstrom KL, Ploutz-Snyder P, Talkachou A, Atienza F, Guiraudon G, Jalife J, Berenfeld O. Mechanisms of wave fractionation at boundaries of high frequency excitation in the posterior left atrium of the isolated sheep heart during atrial fibrillation. Circulation. 2006;113:626–33. doi: 10.1161/CIRCULATIONAHA.105.575340. [DOI] [PubMed] [Google Scholar]
- 11.Markides V, Schilling RJ, Ho SY, Chow AW, Davies DW, Peters NS. Characterization of left atrial activation in the intact human heart. Circulation. 2003;107:733–9. doi: 10.1161/01.cir.0000048140.31785.02. [DOI] [PubMed] [Google Scholar]
- 12.Sau S, Bassen HI, Krauthamer V. Method for evaluating optical characteristics of endoscopes for recording fluorescence-related cardiac electrical activity. Appl Opt. 2002;41:6725–30. doi: 10.1364/ao.41.006725. [DOI] [PubMed] [Google Scholar]
- 13.Jalife J, Berenfeld O, Skanes A, Mandapati R. Mechanisms of atrial fibrillation: mother rotors or multiple daughter wavelets, or both? J Cardiovasc Electrophysiol. 1998;9:S2–12. [PubMed] [Google Scholar]
- 14.Sanders P, Berenfeld O, Hocini M, Jais P, Vaidyanathan R, Hsu LF, Garrigue S, Takahashi Y, Rotter M, Sacher F, Scavee C, Ploutz-Snyder R, Jalife J, Haissaguerre M. Spectral analysis identifies sites of high-frequency activity maintaining atrial fibrillation in humans. Circulation. 2005;112:789–97. doi: 10.1161/CIRCULATIONAHA.104.517011. [DOI] [PubMed] [Google Scholar]
- 15.Cappato R, Calkins H, Chen SA, Davies W, Iesaka Y, Kalman J, Kim YH, Klein G, Packer D, Skanes A. Worldwide survey on the methods, efficacy, and safety of catheter ablation for human atrial fibrillation. Circulation. 2005;111:1100–5. doi: 10.1161/01.CIR.0000157153.30978.67. [DOI] [PubMed] [Google Scholar]
- 16.Schilling RJ, Peters NS, Davies DW. Noncontact mapping of cardiac arrhythmias. J Electrocardiol. 1999;32 (Suppl):13–5. doi: 10.1016/s0022-0736(99)90027-4. [DOI] [PubMed] [Google Scholar]
- 17.Schilling RJ, Kadish AH, Peters NS, Goldberger J, Davies DW. Endocardial mapping of atrial fibrillation in the human right atrium using a non-contact catheter. Eur Heart J. 2000;21:550–64. doi: 10.1053/euhj.1999.1851. [DOI] [PubMed] [Google Scholar]
- 18.Chou CC, Nihei M, Zhou S, Tan A, Kawase A, Macias ES, Fishbein MC, Lin SF, Chen PS. Intracellular calcium dynamics and anisotropic reentry in isolated canine pulmonary veins and left atrium. Circulation. 2005;111:2889–97. doi: 10.1161/CIRCULATIONAHA.104.498758. [DOI] [PubMed] [Google Scholar]
- 19.Matiukas A, Mitrea BG, Pertsov AM, Wuskell JP, Wei MD, Watras J, Millard AC, Loew LM. New near-infrared optical probes of cardiac electrical activity. Am J Physiol Heart Circ Physiol. 2006;290:H2633–43. doi: 10.1152/ajpheart.00884.2005. [DOI] [PubMed] [Google Scholar]
- 20.Knight BP, Burke MC, Hong TE, McAuley A, Amundson D, Hanlin J, Blankenship L, Ferguson TB, Jr, Nazarian S, Berger RD. Direct imaging of transvenous radiofrequency cardiac ablation using a steerable fiberoptic infrared endoscope. Heart Rhythm. 2005;2:1116–21. doi: 10.1016/j.hrthm.2005.07.010. [DOI] [PubMed] [Google Scholar]
Associated Data
This section collects any data citations, data availability statements, or supplementary materials included in this article.