Abstract
The right kidney of anaesthetized rats was imaged with intermittent diagnostic ultrasound (1.5 MHz; 1 sec trigger interval) under exposure conditions simulating those encountered in human perfusion imaging. The rats were infused intravenously with 10 μl/kg/min Definity® while being exposed to Mechanical Index (MI) values of up to 1.5 for 1 min. Suprathreshold MI values ruptured glomerular capillaries resulting in blood filling Bowman’s space and proximal convoluted tubules of many nephrons. The re-establishment of a pressure gradient following hemostasis caused the uninjured portions of the glomerular capillaries to resume the production of urinary filtrate which washed some or all of the erythrocytes out of Bowman’s space and cleared blood cells from some nephrons into urine within six hours. However, many of the injured nephrons remained plugged with tightly packed red cell casts 24 hours after imaging and also showed degeneration of tubular epithelium indicative of acute tubular necrosis. The additional damage caused by the extravasated blood amplified that caused by the original cavitating gas body. Human nephrons are virtually identical to those of the rat and so it is probable that similar glomerular capillary rupture followed by transient blockage and/or epithelial degeneration will occur following clinical exposures using similar high MI intermittent imaging with gas body contrast agents. The detection of blood in post-imaging urine samples using standard hematuria tests would confirm whether or not clinical protocols need to be developed to avoid this potential for iatrogenic injury.
Keywords: diagnostic ultrasound adverse effects, bioeffects, safety, glomerular hemorrhage, ultrasound contrast agent, ultrasound perfusion imaging, flash replenishment
INTRODUCTION
Ultrasound gas body contrast agents (GBCA) consist of suspensions of stabilized microbubbles, which persist in the circulation after venous injection and produce intense echoes for ultrasound image enhancement in many applications (Goldberg et al. 2001). However, single image-exposures of high Mechanical Index (MI, the on-screen measure of the ultrasound exposure related to cavitation potential) can activate the gas bodies leading to destabilization and dissolution of the gas. This phenomenon can clear the GBCA from tissue being imaged, which can be exploited for the display of tissue perfusion at the capillary level. In order to destroy all gas bodies within the imaged volume, high MI levels are used to achieve the maximum differential between the images before, during and after reperfusion with unexposed blood containing GBCA (Averkiou, et al. 2003). Perfusion may be displayed by the difference in these images as a function of increasing intervals between GBCA clearance, or by using low MI imaging to watch the tissue re-fill with GBCA between high MI clearance bursts. This clearance-reperfusion imaging technique with contrast ultrasound can be used in many tissues including heart (Mulvagh et al. 2000), liver (Albrecht et al. 2002) and kidney (Robbin et al. 2003). Factors favoring contrast aided diagnostic ultrasound imaging of perfusion, relative to other cardiology and radiology methods, include the possible replacement of more expensive x-ray or magnetic resonance procedures and the reduction of the use of nephrotoxic iodinated contrast agents.
However, the gas body destruction is a form of acoustic cavitation, which is a well-known mechanism for injury of cells and tissues (NCRP, 2002). High MI diagnostic ultrasound imaging with gas body destruction has been shown to cause injury in skeletal muscle (Skyba et al. 1998; Miller and Quddus, 2000), heart (Ay et al. 2001; Li et al. 2004; Miller et al. 2005), mesentery (Kobayashi et al. 2002), liver (Shigeta et al. 2004), and kidney (Wible et al. 2002; Miller et al. 2007) tissues. The injury involves capillary rupture with hemorrhage, and death of endothelial and adjacent parenchymal cells within localized micro-lesions, which are scattered throughout the tissue. The mechanism for bioeffects of diagnostic ultrasound interacting with contrast-agent gas bodies differs from the pharmacological side effects associated with contrast agents for x ray (Brinker 2003) or magnetic resonance (Shellock and Kanal 1999) imaging. Separately administered, the diagnostic ultrasound and the gas-body contrast agents appear to be virtually free of bioeffects risk. In combination, the resulting potential for tissue injury depends on a complex interplay of user-controlled parameters including MI, GBCA dose, dose rate of administration, scanning duration and the image inter-frame interval. Relevant research information is needed to describe the initial bioeffects, to follow sequelae and to identify means to detect and avoid any significant clinical consequences of this potential iatrogenic injury.
Research information on this injury is urgently needed for kidney due to the high blood flow and unique structure of this organ. The specialized glomerular capillaries contain blood at 60 mmHg (four to five times the pressure inside other capillaries)(Conger, 1995), which is essential for their role as a high efficiency filter. Rupture of glomerular capillaries therefore results in copious hemorrhage into Bowman’s space and proximal tubules from which blood is normally excluded. This effect was first observed by Wible et al. (2002) who acoustically coupled a diagnostic imaging transducer to the depilated skin of rats and showed that three different classes of prototype GBCAs caused similar amounts of capillary rupture. However, they concluded that this effect was unlikely to occur in humans because of the extra attenuation of intervening tissues. Miller et al. (2007) interposed an attenuator between the transducer and the rat so that the dimensions and attenuation simulated those encountered during clinical investigations. They observed that Definity® (similar to MP-1950 in the Wible et al. 2002 study) caused glomerular capillary rupture when infused at the clinically recommended dose rate and imaged with high MI diagnostic ultrasound. The present study extends these observations and examines the effects of the blood shed into Bowman’s space on the histology and functional capacity of the rest of the nephron.
METHODS
Animal preparation
This investigation was conducted with the approval of the University Committee on the Use and Care of Animals, University of Michigan. For this study, a total of 37 rats (CD hairless, Charles River Laboratories, Wilmington MA) weighing 344±39 gm were anesthetized by intramuscular injection of pentobarbital (50 mg/kg). A 24 gauge cannula was inserted into a tail vein for GBCA injections. The rats were mounted with the ventral surface against a plastic holder, which was placed vertically in a water bath filled with 37°C degassed water.
Ultrasound Contrast Agent
A new vial of Definity® (Bristol-Myers Squibb Medical Imaging, Inc., N. Billerica, MA USA) GBCA was prepared each day according to the manufacturer’s instructions. According to the package insert, each ml of activated Definity® suspension contains 1.2×10¹⁰ perflutren lipid microspheres (lipid-stabilized octofluoropropane gas bodies) with a 1.1–3.3 μm mean diameter range. For injection via tail vein, 60 μl of the agent first was diluted with sterile saline in a 3 ml syringe. A 30 cm extension tube (12 inch Microbore Extension Set no. 6451, Abbott Laboratories, N. Chicago IL, USA) was filled with the diluted GBCA, and was connected between the tail vein cannula and the syringe. The syringe was mounted in a syringe pump (model 11 plus, Harvard Apparatus, Holliston MA USA) set to deliver 0.5 ml/kg/min. The normal dosage during scanning was 10 μl/kg delivered over 1 min, as recommended in the package insert.
Diagnostic Ultrasound
A GE Vingmed System V (General Electric Co., Cincinnati OH) with a phased array probe (FPA2.5, 2.5 MHz center frequency) was employed as the diagnostic ultrasound source, as described previously (Miller et al. 2007). The probe was clamped in the water bath with the right kidney located 3.5–4.5 cm from the transducer face, which placed the position of the peak rarefactional pressure amplitude of the field within the kidney. At this position, the -6 dB scan plane thickness (beam width) was 4.6 mm. The right kidney was located using a 3.6 MHz frequency setting, and then exposed using a 1.5 MHz setting with 5 cm focus and 10 cm depth. The right kidney was used for testing because it was more clearly imaged than the left kidney (which was not imaged or sampled). A 2.5 cm thick tissue-mimicking absorber with 0.3 dB/cm/MHz attenuation was inserted between the probe and the rat to simulate the attenuating effects of additional tissues which would have been present for human kidney imaging (Miller et al. 2007). The peak rarefactional pressure amplitude in the scan plane was measured as described previously (Miller et al. 2007) with the phantom in place, but without the rat. After correction for the attenuation between the skin and kidney (−0.45 dB), the peak rarefactional pressure amplitude was 1.8 MPa, which corresponds to a measured MI=1.5 (actual on-screen MI=1.7). The guideline upper limit for diagnostic ultrasound in the USA is MI=1.9. A 1 s intermittent trigger interval was used to allow contrast refill, as for perfusion imaging. For exposure, the contrast infusion was started and the scanning timed for 1 min after the contrast agent appeared in the image (typically 15 sec after starting the infusion). In two rats used for electron microscopy of kidney samples, an increased image-exposure was used for 5 min with 2 s dual frame trigger interval and 4 μl/kg/min GBCA infusion (total dose 20 μl/kg). For sham exposure, the rat was scanned at the maximum MI, and then the ultrasound was switched off during infusion of the contrast agent.
This imaging-exposure protocol was intended to fall within the range of clinically relevant parameters and to simulate features of high MI diagnostic ultrasound imaging with GBCA reported in the literature (Wei et al. 2001; Schlosser et al. 2001). However, it should be noted that actual clinical imaging of humans involves individualized scanning performed to obtain accurate diagnosis, while this basic research involved replicate tests designed to acquire reproducible data for accurate analysis.
Measured Endpoints
After scanning, the rats were removed from the water bath and mounting board, and the kidney was removed under anesthesia (followed by euthanasia by bilateral pneumothorax) after a selected delay period (see below). A total of 37 rats were grouped into three experiments.
To test the duration of capillary hemorrhage and rate of clearance of blood from Bowman’s space, five samples were obtained at 10, 20 and 30 min each (15 rats total) after scanning at the maximum MI of 1.5 for 1 min with 10 μl/kg/min infusion of GBCA. In addition, these were compared to a five-rat group with kidney removal 5 min after exposure from the previous study (Miller et al. 2007). The percentage of glomeruli with red blood cells in the Bowman’s space was determined by histological examination, as described previously (Miller et al. 2007). Briefly, a 5 mm thick transverse slab containing the scan plane was cut from the kidney and fixed in neutral buffered formalin. Histological processing, sectioning at 5 μm, and hematoxylin and eosin staining were performed at the Research Histology and Immunoperoxidase Laboratory of the University of Michigan Comprehensive Cancer Center Tissue Core. Slides were made each 0.5 mm cutting into the sample and the slide from each sample with the maximum apparent glomerular hemorrhage was then scored by an observer blinded to the test conditions. Bowman’s spaces with and without red blood cells present were counted and the percentage containing extravasated blood cells was calculated as the number with red blood cells divided by the total number counted over the entire section, times 100. The averaged number of glomeruli counted over the entire sections of each kidney was 285±15.
Twenty rats were housed in urine collection cages for 18 hr prior to exposure, and replaced into these cages for 24 hr after exposure to a range of MI values. Groups of 5 rats each were exposed at MIs of 0.65, 1.0 and 1.5 during contrast infusion. A sham group of 5 rats was imaged for 1 min at MI=1.5, and then infused with contrast agent with the ultrasound off. Urine samples were collected for the 18 hr pre-exposure, 6 hr post exposure and for an additional 18 hr period. The rats were euthanized 24 hr after exposure and the exposed kidney was removed for histology. The urine samples were assessed for hematuria and proteinuria using urinalysis test strips (Hemastix® or Albustix®, Bayer Corp., Elkhart IN). The measurements made using such test strips are somewhat subjective, but are quite sensitive and specific for hemoglobin. The Hemastix® test strip had graded positive indications of trace, +, ++, and +++. Testing with a rat blood sample indicated that the positive indication steps of the test strip differed by approximately a factor of two in blood concentration (approximately 0.006% blood for a +++ reading). A numerical score was used to characterize each sample with the trace reading designated one unit with each higher reading doubling the value (e. g. +++ corresponded to 8 units). Off-scale samples (obtained at the highest MI) were diluted serially until the reading was within the test-strip scale. A final score was obtained by multiplying the number of units by the sample volume and dividing by the hours of collection.
Finally, two rats were exposed for 5 min at MI=1.5 with a 4 μl/kg/min contrast infusion (total dose of 20 μl/kg), and the kidneys used for transmission electron microscopy. The extended exposure and larger dose were used to increase the probability of finding injured nephrons in the electron microscope. These kidney samples were obtained by perfusion fixation in situ via the aorta with PLP (Paraformaldehyde, Lysine, Periodate) fixative 30 min after imaging. Small samples (about 1–2 mm blocks) were fixed in 2% gluteraldehyde in 0.05M cacodylate buffer pH 7.4 before being dehydrated and embedded in Epon resin. One micron sections were stained with toulidine blue. Thin sections were then cut from selected areas, stained with uranyl acetate and lead citrate, and studied using an electron microscope (Philips 400 T, Philips Electron Optics, Eindhoven, NL).
Statistics
Groups of 5 rats were tested and numerical results are presented as the mean plus/minus the standard deviation, or plotted as the mean with standard error bars. For statistical analysis, Mann-Whitney rank sum tests were used to compare means of the measured parameters, with statistical significance assumed at P=0.05.
RESULTS
Observations shortly after imaging
Figure 1a shows a band of scattered blood-filled tubules on the surface of the kidney (approximately the -6 dB width of the ultrasound scan plane of the stationary transducer) following 60 intermittent images at a measured MI of 1.5 from the previous study (Miller et al. 2007). This kidney was removed 5 min after imaging and clearly shows that numerous superficial nephrons had suffered glomerular capillary hemorrhage within the ultrasound scan plane. This hemorrhage filled Bowman’s space and proximal tubules causing “flea-bite” swellings on the kidney surface, and red markings which were grossly visible on the freshly excised kidneys.
Figure 1.
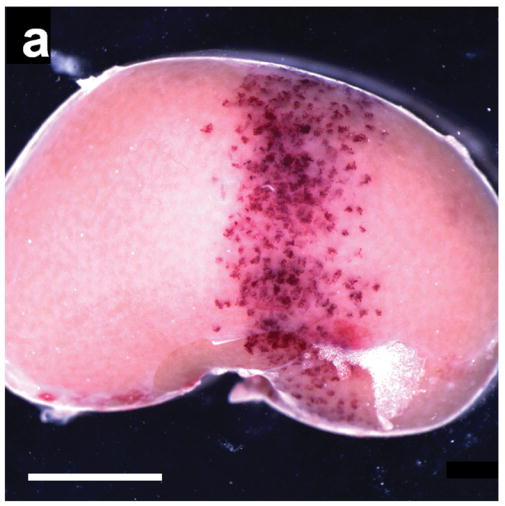
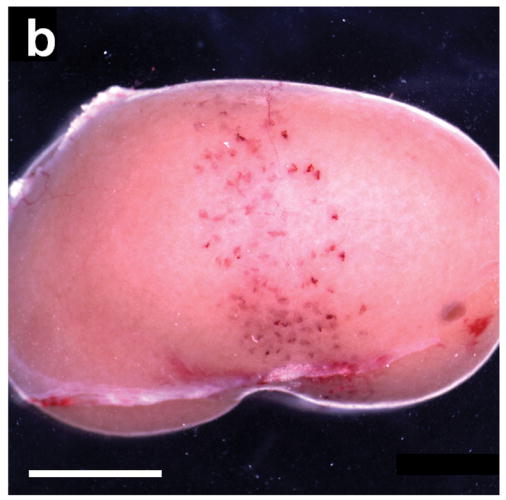
(a) A typical example of a kidney removed 5 min after being scanned at an equivalent MI of 1.5 with 60 images triggered at 1 s intervals during injection of 10 μl/kg/min of contrast agent from Miller et al. (2007). The 4.6 mm wide scan plane generated by the stationary transducer is evident from the band of blood-filled tubules, which are normally filled with clear glomerular filtrate: scale bar 5 mm. (b) A kidney scanned under the same conditions as in a), but not removed until 24 hr after scanning from this study. Some nephrons have apparently cleared the blood from their tubules whereas others remained filled with blood: scale bar 5 mm.
Histologically, glomeruli having ruptured glomerular capillary loops with hemorrhage into the urinary space and the surrounding blood filled tubules were scattered throughout the cortex, as shown in Fig. 2. Fibrinous masses were focally present within Bowman’s space, which were indicative of hemostatic plug formation, and sometimes extended into the neck, or further, into the proximal tubules as shown by light microscopy in Fig. 3a. Although the exact points of capillary injury were not identifiable, the resulting thrombus-like clots were seen as a lightly stained fibrinous material within Bowman’s space, which lacked cell nuclei and sometimes trapped erythrocytes. Electron microscopy revealed that the capillary rupture and hemorrhage into the urinary space appeared to have dislodged podocytes, as shown in Fig. 4a. In addition, the electron microscopic identification of fibrin (Fig. 4a) confirmed the light microscopy observation of fibrin in Bowman’s space (Fig. 3a). Many proximal tubules were also packed with erythrocytes (close packing was evident from the distorted shape of the erythrocytes), as shown in Fig. 4b. This indicates that the liquid portion of the tubular contents had been resorbed by the epithelial cells, causing obstruction of the tubule.
Figure 2.
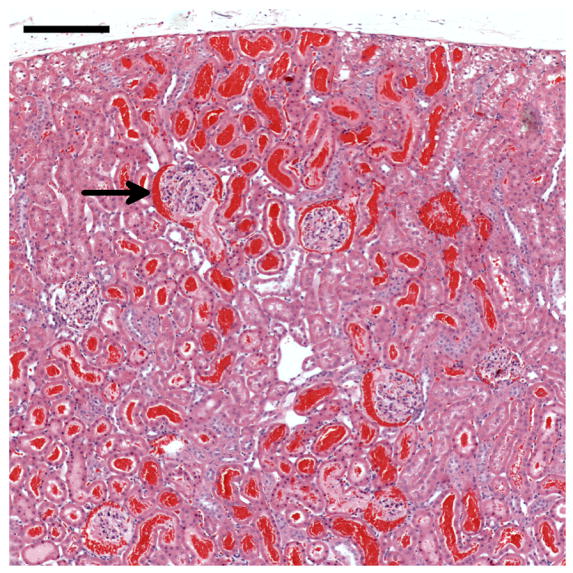
Histology of a kidney removed 5 min after contrast ultrasound at MI=1.5. Most of the glomeruli in the field of view have blood in Bowman’s space (one example indicated by the arrow) and many tubules are filled with blood. The blood-filled tubules near the surface (top) represent the red markings seen grossly on the freshly excised kidneys (Fig. 1a): scale bar 0.2 mm.
Figure 3.
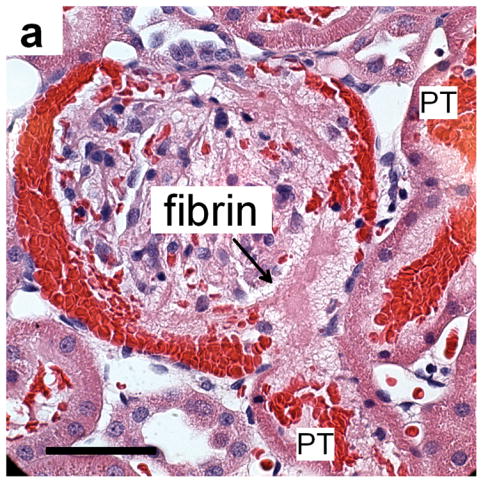
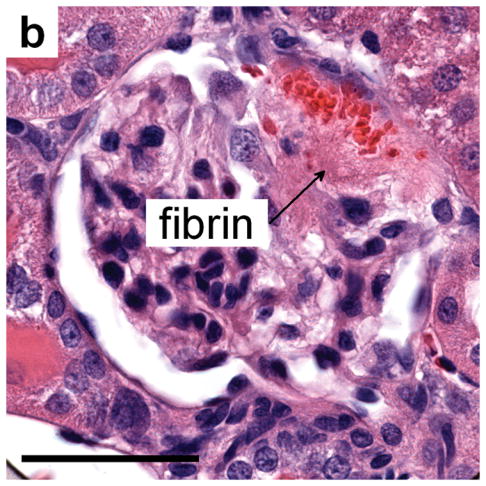
(a) Histology of a glomerulus with blood in Bowman’s space and proximal tubules (PT) and evidence of a thrombus-like fibrinous mass (fibrin), which extends into Bowman’s space and the proximal tubule, for MI=1.5 and sacrifice after 5 min: scale bar 50 μm. (b) a glomerulus from a sample treated as in a) but taken 24 h after imaging-exposure showing the persistence of a fibrinous clot (fibrin) even after clearance of erythrocytes from most of Bowman’s space: scale bar 50 μm.
Figure 4.
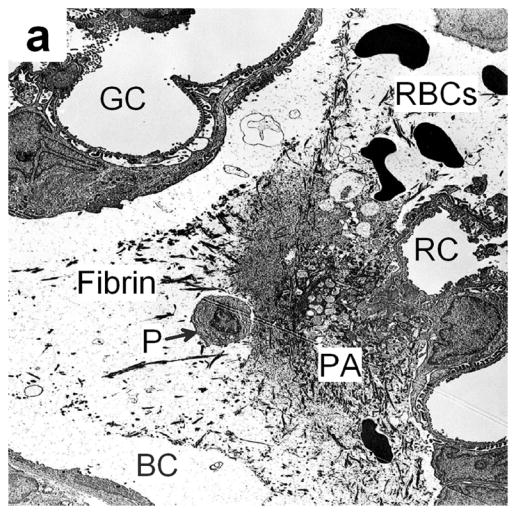
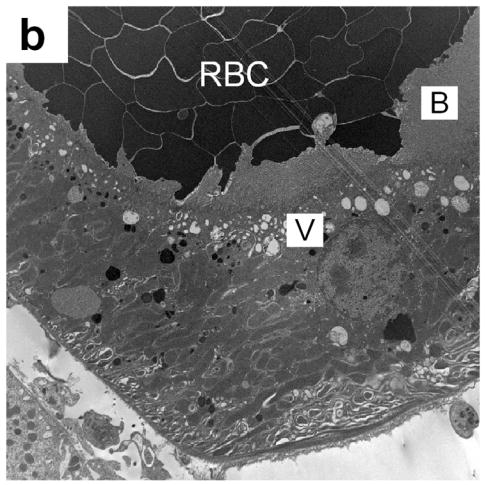
(a) Electron photomicrograph of a kidney removed 30 min after dual frame imaging for 5 min showing a platelet aggregate (PA) in Bowman’s space (BC) with a normal glomerular capillary (GC), a ruptured capillary (RC), fibrin and possibly a detached podocyte (P). Most red blood cells (RBC) have been washed out of the glomerulus by the perfusion fixation. (b) An electron photomicrograph (from a kidney removed 30 min after imaging as in a) showing a portion of a proximal tubule, which was densely packed with blood cells (RBC). A layer of vacuoles (V) is visible beneath the brush border (B), indicating that these cells have resorbed all the extracellular liquid, leaving only the packed cells.
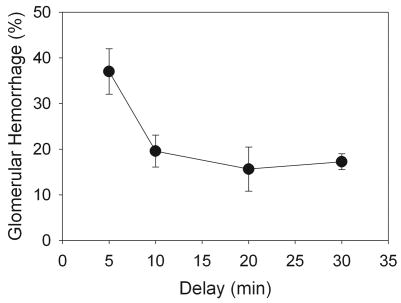
For a 60-image exposure at an MI of 1.5, 37±5.0% of the glomeruli in histological sections from the center of the scan plane had blood cells present in the Bowman’s space for samples obtained 5 min after exposure (Miller et al. 2007). The apparent percentage of glomeruli with hemorrhage decreased if the kidney excision was delayed beyond 5 min as shown in Fig. 5. However, this decrease in the number of Bowman’s spaces containing blood cells leveled off after 20–30 min delay. This result indicates a continuation of glomerular filtration after hemostasis with the blood cells washing out of the Bowman’s space for about half the affected glomeruli, but with incomplete wash-out for the other half.
Figure 5.
The apparent percentage of glomerular hemorrhage judged by the percentage of glomeruli with blood cells in Bowman’s space decreased with increasing delay time to sacrifice, but leveled off after 20–30 min. This phenomenon apparently indicates a cessation of hemorrhage and clearance of blood from about half the Bowman’s spaces.
Observations 6–24 hr after imaging
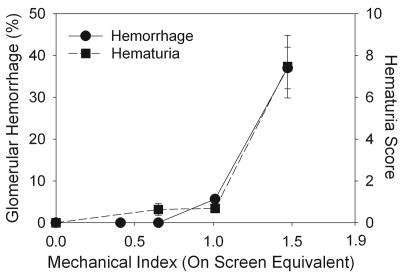
Hematuria was measured in urine samples collected for 6 hr post imaging for groups of rats scanned at increasing MI, and the results are presented in Fig. 6. Hematuria increased rapidly for the higher MI values, with statistically significant hematuria scores (P<0.05) for MI=0.65, or higher, relative to the 18 h pre-exposure samples, which were negative for hematuria. For comparison, the percentage of glomeruli with blood in Bowman’s space is also plotted in Fig. 6 for kidney samples obtained for histology 5 min after scanning at increasing MI values, with an apparent threshold of MI=0.6 (Miller et al. 2007). The trends in these data sets (i. e., a rapid increase above a threshold) were remarkably similar for the two end-points, even though the measurements were in different groups of rats at different time-points. The hematuria for imaging at MI=1.5 remained in evidence for urine collected during the 6–24 hr post imaging time period with a 1.1±0.2 score (P<0.01), but was significantly reduced (P<0.01) from the 6 hr samples (7.5±3.3 score). Urinalysis indicated no significant proteinuria even in the 6 hr urine samples, with most samples reading negative to trace levels (except for one indication of 30 mg/dl and one of 100 mg/dl among the 6 hr samples from 5 rats imaged at MI=1.5).
Figure 6.
A plot of the hematuria results for increasing MI during 1 min of contrast ultrasound exposure. The hematuria score increased rapidly at the higher MI values, with statistical significance at MI=0.65 (P<0.05). For comparison, the percentage of glomeruli with blood in Bowman’s space counted in histological sections from the center of the scan plane for kidneys removed after 5 min is also plotted. This percentage increased rapidly with increasing MI with an apparent threshold at MI=0.6 (Miller et al. 2007).
Figure 1b shows that many tubules still contained blood 24 h after imaging, although the visible markings on the kidney surface appeared faded. This suggested some movement of the hemorrhaged blood down the tubular apparatus of the nephron with some clearance into the urine, as evidenced by the hematuria.
Histological sections from kidneys removed 24 hr post imaging showed thrombus-like clots remaining in some glomeruli, as shown in Fig. 3b. Some tubules in the medulla or adjacent cortex remained full of blood cells even after 24 h. There was apparent phagocytosis of erythrocytes in some of these tubules, as shown in Fig. 7a. However, other tubules, which contained remains of glomerular capillary hemorrhage in the form of hyaline urinary casts, had indications of epithelial cell necrosis as shown in Fig. 7b. No bioeffects were detectable for rat kidneys scanned without contrast agent and then given the contrast infusion with the ultrasound off (sham group).
Figure 7.
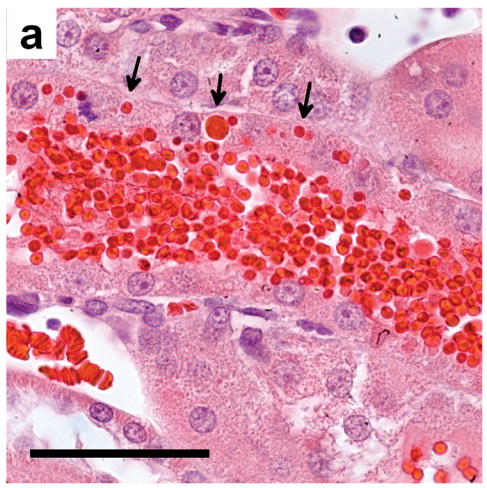
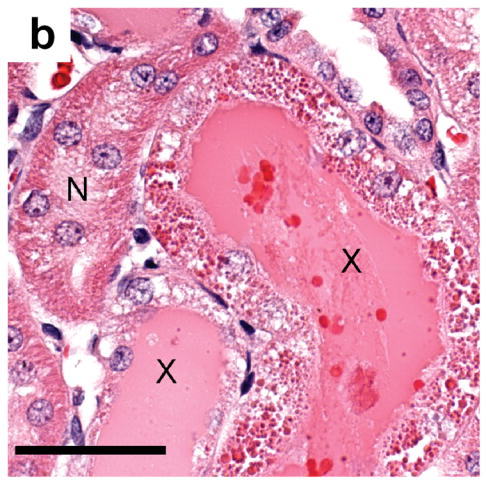
(a) Histology of kidney tissue removed and fixed 24 h after contrast imaging at MI=1.5 showing the apparent phagocytosis of some of the erythrocytes (arrows) filling a tubule: scale bar 50 μm (b) tubules from a sample obtained as in a) showing normal tubules (N), and tubules (X) filled with eosinophilic remnants of the hemorrhage and filtrate, and with degenerating tubular epithelial cells: scale bar 50 μm.
DISCUSSION
Typical thin-walled capillaries have intraluminal pressures of up to 15 mmHg. When they are ruptured by gas body contrast agents subjected to high MI diagnostic ultrasound, only a relatively small volume of blood escapes before the tear is sealed by a platelet plug growing from the edges of the lesion. Although easily detectable within semi-transparent tissues (Miller and Quddus, 2000) these petechiae represent localized injury limited to the immediate vicinity of the microlesion and the extravasated blood constituents are removed within a few days. However, the specialized glomerular capillaries have to be more robust to withstand the 60 mm Hg intraluminal pressure needed to produce urinary filtrate (Conger, 1995). Despite being structurally reinforced with a thickened basement membrane and the encircling actomyosin-containing pedicels of podocytes, some are still ruptured by gas body contrast agents exposed to high MI diagnostic imaging under exposure conditions simulating those encountered during clinical investigations (Miller et al. 2007).
The large fibrinous masses seen in Figures 3a, 3b and 4a were the result of capillary injury and a relatively large flow of blood, which had been shed into the urinary space after rupture of the basement membrane, filling the Bowman’s space and proximal tubules. In some cases this thrombus-like clot was even large enough to extend into the entrance to the proximal tubule and, after it had been consolidated, may have prevented any urinary filtrate entering the rest of the nephron (Fig. 3a).
However, most of the injured glomerular capillaries appear to seal their lesions after the Bowman’s space and proximal tubules have been filled with blood. The epithelial cells lining the proximal tubules continue their normal function and apparently resorb most of the water, salts, proteins and nutriments from the blood. Figure 4b shows typical proximal epithelial cells 30 min after imaging where a band of distended vacuoles (v) can be seen beneath the brush border (B) and the lumen of the tubule is filled with tightly packed erythrocytes (RBC). The reduction in the volume of the shed blood may re-establish a pressure gradient across the glomerular capillary wall so that the uninjured portions can produce urinary filtrate once again. This filtrate washed some or all of the erythrocytes out of Bowman’s space and, for those nephrons which were not blocked with tightly packed erythrocytes, washed the erythrocytes out of the nephron and into the urine where it served as a quantitative indicator of the extent of glomerular capillary rupture (Fig. 6). The hematuria declined to near normal values after 24hrs. Measuring hematuria would be a clinically acceptable means to assess the possible occurrence of similar glomerular hemorrhage in humans following high MI perfusion investigations using gas body contrast agents.
Figure 4a shows the possible dislodgement of a podocyte by the capillary injury and hemorrhage. The possible loss or irreversible damage of a podocyte is significant because these essential cells are not replaced, and their loss may lead to glomerular scarring (Kriz, 1996).
Urinalysis also showed that of the 15 animals exposed to suprathreshold MI values, all of them were positive for hematuria but only one animal from the highest MI group was also positive for protein. This indicates that the proximal epithelium had resorbed virtually all of the plasma proteins before the erythrocytes were eliminated. Histological analysis of proximal tubules 24 hr post imaging showed phagocytosis of erythrocytes (Fig. 7a) and gross degeneration of the resorptive epithelium (Fig. 7b), indicative of acute tubular necrosis, as well as eosinophillic hyaline casts (X in Fig. 7b). Similar changes were also seen by Madsen et al. (1982) who micro-injected autologous blood directly into superficial rat proximal tubules in vivo. Thus, the resorption and intracellular digestion of those blood constituents which are not normally present within the urinary filtrate (i.e. erythrocytes and plasma proteins) overwhelmed the epithelial cells lining the proximal tubules leading to their death and subsequent autolysis (Sheering et al. 1999) and possibly leading to interstitial fibrosis (Strutz and Muller, 1999). These same autolytic enzymes also partially lysed the packed intraluminal erythrocytes when they were in contact with degenerating cells (X in Fig. 7b). This additional epithelial damage represents a large amplification of the initial glomerular capillary rupture since the nephron is unable to function normally until all the cell debris has been eliminated and new proximal epithelial cells have regrown (this takes about 21 days in healthy young rats).
Since the diameters of rat (6.9 ± 2.0 μm) (Shea et al. 1984) and human (6.8 ± 0.9 μm) (Ellis et al. 1989) glomerular capillaries are almost the same, and the intervening structures have the same dimensions and attenuation as our phantom, it is highly probable that similarly high MI (or even higher, up to the guideline upper limit MI of 1.9) diagnostic ultrasound imaging with GBCA would cause similar glomerular capillary rupture during a human clinical examination. Similar injury from clinical scanning, particularly in aging humans with diabetic renal disease or other types of renal disease leading to a clinical indication for ultrasound imaging, could sustain significant acute or permanent injury. Thus, clinical evidence of the occurrence of contrast-ultrasound-induced glomerular capillary hemorrhage should be sought through hematuria tests at medical centers where high MI contrast ultrasound examination of kidney is practiced. Caution should be exercised in the use of GBCA in kidney until mitigation strategies can be developed to assure that similar glomerular capillary rupture with potential clinical implications does not occur in humans.
Acknowledgments
This work was supported by PHS grant EB00338 awarded by the National Institutes of Health, DHHS.
Footnotes
Publisher's Disclaimer: This is a PDF file of an unedited manuscript that has been accepted for publication. As a service to our customers we are providing this early version of the manuscript. The manuscript will undergo copyediting, typesetting, and review of the resulting proof before it is published in its final citable form. Please note that during the production process errors may be discovered which could affect the content, and all legal disclaimers that apply to the journal pertain.
References
- Albrecht T, Barr R, Blomley M, et al. Seeking consensus: contrast ultrasound in radiology. Invest Radiol. 2002;37:205–214. doi: 10.1097/00004424-200204000-00006. [DOI] [PubMed] [Google Scholar]
- Averkiou M, Powers J, Skyba D, Bruce M, Jensen S. Ultrasound contrast imaging research. Ultrasound Q. 2003;19:27–37. doi: 10.1097/00013644-200303000-00004. [DOI] [PubMed] [Google Scholar]
- Ay T, Havauz X, Van Camp G, Campanelli B, et al. Destruction of contrast microbubbles by ultrasound effects on myocardial function, coronary perfusion pressure and microvascular integrity. Circulation. 2001;104:461–466. doi: 10.1161/hc3001.092038. [DOI] [PubMed] [Google Scholar]
- Brinker J. What every cardiologist should know about intravascular contrast. Rev Cardiovasc Med. 2003;4(Suppl 5):S19–S27. [PubMed] [Google Scholar]
- Conger JD. Kidney microcirculation. In: Barker JH, Anderson GL, Menger MD, editors. Clinically Applied Microcirculation Research. Boca Raton Fl: CRC Press; 1995. pp. 239–247. [Google Scholar]
- Ellis EN, Mauer SM, Sutherland DE, et al. Glomerular capillary morphology in normal humans. Lab Invest. 1989;60:231–236. [PubMed] [Google Scholar]
- Goldberg BB, Raichlen JS, Forsberg F, editors. Ultrasound Contrast Agents: Basics Principles and Clinical Applications. London: Martin Dunitz Ltd; 2001. [Google Scholar]
- Kobayashi N, Yasu T, Yamada S, et al. Endothelial cell injury in venule and capillary induced by contrast ultrasonography. Ultrasound Med Biol. 2002;28:949–956. doi: 10.1016/s0301-5629(02)00532-x. [DOI] [PubMed] [Google Scholar]
- Kriz W. Progressive renal failure-inability of podocytes to replicate and the consequences for development of glomerulosclerosis. Nephrol Dial Transplant. 1996;11:1738–1742. [PubMed] [Google Scholar]
- Li P, Armstrong WR, Miller DL. Impact of myocardial contrast echocardiography on vascular permeability: Comparison of three different contrast agents. Ultrasound Med Biol. 2004;30:83–91. doi: 10.1016/j.ultrasmedbio.2003.09.004. [DOI] [PubMed] [Google Scholar]
- Madsen KM, Applegate CW, Tisher CC. Phagocytosis of erythrocytes by the proximal tubule of the rat kidney. Cell Tissue Res. 1982;226:363–374. doi: 10.1007/BF00218366. [DOI] [PubMed] [Google Scholar]
- Miller DL, Dou C, Wiggins RC, et al. An in vivo rat model simulating imaging of human kidney by diagnostic ultrasound with gas-body contrast agent. Ultrasound Med Biol. 2007;33:129–135. doi: 10.1016/j.ultrasmedbio.2006.07.033. [DOI] [PubMed] [Google Scholar]
- Miller DL, Li P, Dou C, et al. Influence of contrast dose and ultrasound exposure on cardiomyocyte injury induced by myocardial contrast echocardiography in rats. Radiology. 2005;237:137–143. doi: 10.1148/radiol.2371041467. [DOI] [PubMed] [Google Scholar]
- Miller DL, Quddus J. Diagnostic ultrasound activation of contrast agent gas bodies induces capillary rupture in mice. Proc Natl Acad Sci U S A. 2000;97:10179–10184. doi: 10.1073/pnas.180294397. [DOI] [PMC free article] [PubMed] [Google Scholar]
- Mulvagh SL, DeMaria AN, Feinstein SB, et al. Contrast echocardiography: current and future applications. J Am Soc Echocard. 2000;13:331–342. doi: 10.1067/mje.2000.105462. [DOI] [PubMed] [Google Scholar]
- NCRP. Criteria Based on All Known Mechanisms. Bethesda Md.: National Council on Radiation Protection and Measurements; 2002. Exposure Criteria for Medical Diagnostic Ultrasound: II. Report No. 140. [Google Scholar]
- Robbin ML, Lockhart ME, Barr RG. Renal imaging with ultrasound contrast: current status. Radiol Clin North Am. 2003;41:963–978. doi: 10.1016/s0033-8389(03)00070-8. [DOI] [PubMed] [Google Scholar]
- Schlosser T, Pohl C, Veltmann C, et al. Feasibility of the flash-replenishment concept in renal tissue: which parameters affect the assessment of the contrast replenishment? Ultrasound Med Biol. 2001;27:937–944. doi: 10.1016/s0301-5629(01)00397-0. [DOI] [PubMed] [Google Scholar]
- Shea SM, Raskova J. Glomerular hemodynamics and vascular structure in uremia: a network analysis of glomerular path lengths and maximal blood transit times computed for a microvascular model reconstructed from subserial ultrathin sections. Microvasc Res. 1984;28:37–50. doi: 10.1016/0026-2862(84)90027-x. [DOI] [PubMed] [Google Scholar]
- Sheerin NS, Sacks SH, Fogazzi GB. In vitro erythrophagocytosis by renal tubular cells and tubular toxicity by haemoglobin and iron. Nephrol Dial Transplant. 1999;14:1391–1397. doi: 10.1093/ndt/14.6.1391. [DOI] [PubMed] [Google Scholar]
- Shellock FG, Kanal E. Safety of magnetic resonance imaging contrast agents. J Magn Reson Imaging. 1999;10:477–484. doi: 10.1002/(sici)1522-2586(199909)10:3<477::aid-jmri33>3.0.co;2-e. [DOI] [PubMed] [Google Scholar]
- Shigeta K, Itoh K, Ookawara S, et al. Endothelial cell injury and platelet aggregation induced by contrast ultrasonography in the rat hepatic sinusoid. J Ultrasound Med. 2004;23:29–36. doi: 10.7863/jum.2004.23.1.29. [DOI] [PubMed] [Google Scholar]
- Skyba DM, Price RJ, Linka AZ, et al. Direct in vivo visualization of intravascular destruction of microbubbles by ultrasound and its local effects on tissue. Circulation. 1998;98:290–293. doi: 10.1161/01.cir.98.4.290. [DOI] [PubMed] [Google Scholar]
- Strutz F, Muller GA. Interstitial pathomechanisms underlying progressive tubulointerstitial damage. Kidney Blood Press Res. 1999;22:71–80. doi: 10.1159/000025911. [DOI] [PubMed] [Google Scholar]
- Wei K, Le E, Bin JP, et al. Quantification of renal blood flow with contrast-enhanced ultrasound. J Am Coll Cardiol. 2001;37:1135–1140. doi: 10.1016/s0735-1097(00)01210-9. [DOI] [PubMed] [Google Scholar]
- Wible JH, Jr, Galen KP, Wojdyla JK, et al. Microbubbles induce renal hemorrhage when exposed to diagnostic ultrasound in anesthetized rats. Ultrasound Med Biol. 2002;28:1535–1546. doi: 10.1016/s0301-5629(02)00651-8. [DOI] [PubMed] [Google Scholar]


