

Abstract
Formation of estrogen metabolites that react with DNA is thought to be a mechanism of cancer initiation by estrogens. The estrogens estrone (E1) and estradiol (E2) can form catechol estrogen (CE) metabolites, catechol estrogen quinones [E1(E2)-3,4-Q], which react with DNA to form predominantly depurinating adducts. This may lead to mutations that initiate cancer. Catechol-O-methyltransferase (COMT) catalyzes an inactivation (protective) pathway for CE. This study investigated the effect of inhibiting COMT activity on the levels of depurinating 4-OHE1(E2)-1-N3Ade and 4-OHE1(E2)-1-N7Gua adducts in human breast epithelial cells. MCF-10F cells were treated with TCDD, a cytochrome P450 inducer, then with E2 and Ro41−0960, a COMT inhibitor. Estrogen metabolites and depurinating DNA adducts in culture medium were analyzed by HPLC with electrochemical detection. Pretreatment of cells with TCDD increased E2 metabolism to 4-OHE1(E2) and 4-OCH3E1(E2). Inclusion of Ro41−0960 and E2 in the medium blocked formation of methoxyCE, and depurinating adducts were observed. With Ro41−0960, more adducts were detected in MCF-10F cells exposed to 1 μM E2, whereas without the inhibitor, no increases in adducts were detected with E2 ≤10 μM. We conclude that low COMT activity and increased formation of depurinating adducts can be critical factors leading to initiation of breast cancer.
Keywords: estrogen metabolism; catechol-O-methyltransferase; 2,3,7,8-tetrachlorodibenzo-p-dioxin (TCDD); depurinating estrogen-DNA adducts; MCF-10F cells
1. Introduction
A variety of evidence shows that estrogens play a major role in the etiology of breast cancer [1,2]. In extrahepatic tissues, Phase I [cytochrome P450 (CYP)1A1 and CYP1B1] enzymes predominantly metabolize estrone (E1) and estradiol (E2) to 2- and 4- catechol estrogens (CE), respectively [3,4]. It has been suggested that these metabolites, 2- and 4-hydroxyestrone (estradiol) [2- and 4-OHE1(E2)], if formed in the breast, can become endogenous ultimate carcinogens that damage DNA and generate mutations leading to breast cancer [2,5-7]. The CE, particularly 4-OHE1(E2), may initiate estrogen carcinogenesis after metabolism to catechol estrogen quinones (CE-Q) that can react with DNA to form predominantly the depurinating adducts, 4-OHE1(E2)-1-N3Ade and 4-OHE1(E2)-1-N7Gua, which generate apurinic sites [2,5,6]. In turn, these apurinic sites can give rise to mutations that induce cell transformation [8-10] and initiate the series of events leading to cancer [2,5-7]. On the other hand, phase II [catechol-O-methyltransferase (COMT) and NADPH quinone oxidoreductase 1 (NQO1)] enzymes are involved in the inactivation of the oxidative estrogen metabolites by COMT-catalyzed methylation of the CE [11] and the reduction of quinones back to CE by NQO1 [12].
COMT is an intracellular enzyme that is present in both soluble and membrane-bound forms encoded by the same gene with different transcription start sites [13] and with the soluble form predominating in most organs [11]. COMT activity varies among individuals [14]. This activity can be altered by either endogenous factors such as genetic polymorphisms and levels of expression or exogenous factors such as induction or inhibition by environmental compounds. Genetic epidemiology studies have proposed a possible correlation between the low activity allele (COMTLL) and increased breast cancer risk [15-17]. However, results from epidemiological studies have been inconsistent [18-20]. A single nucleotide substitution in codon 108 causes an amino acid transition (Val/Met), which results in a high (Val/Val) or low (Met/Met) activity form of the COMT enzyme with a 3 to 4-fold difference in activity [21]. One-fourth of United States Caucasians are homozygous for the val108met polymorphism in the COMT gene [21,22]. COMT activity can also be inhibited by substrate competition for the enzyme. Certain catechol metabolites of polychlorinated biphenyls have been shown to inhibit COMT activity [23]. Ro41−0960 is a nitrocatechol-type inhibitor of COMT that fully inhibits methylation of CE [11]. COMT inhibition decreases inactivation of CE, which in turn may lead to increased formation of CE-Q and DNA damage that initiates cancer. However, the relationship has not been established between inhibition of COMT activity and increased levels of CE and depurinating DNA adducts after exposure to E2. We hypothesize that low COMT activity and increased formation of DNA adducts by CE-Q may be critical factors in the initiation of breast cancer (Figure 1).
Fig. 1.

COMT inhibition results in decreased inactivation of CEs, which in turn may lead to increased depurinating DNA adducts that can initiate cancer.
The MCF-10F cell line [aromatic hydrocarbon receptor (AhR) positive, but estrogen receptor-α (ERα) negative] is a good experimental model for researching estrogen carcinogenesis by a non-ER mediated pathway [8-10]. Expression of CYP enzymes that metabolize E2 to CE in MCF-10F cells is very low, unless they are induced by 2,3,7,8-tetrachlorodibenzo-p-dioxin (TCDD) [24]. Thus in this study, we pretreated these cells with TCDD to enhance formation of CE. To assess the effects of altered COMT activity on E2 metabolism and formation of estrogen-DNA adducts, MCF-10F cells were grown in the presence of the COMT inhibitor Ro41−0960. The profile of estrogen metabolites and depurinating estrogen-DNA adducts was analyzed to gain more insight into the mechanism by which COMT plays a protective role in estrogen initiation of breast cancer.
2. Materials and Methods
2.1. Chemicals
TCDD (>99% pure) was purchased from AccuStandard, Inc. (New Haven, CT); 2-OCH3E1(E2) and 4-OCH3E1(E2) were obtained from Steraloids, Inc. (Newport, RI). 2-OHE1(E2) and 4-OHE1(E2) were synthesized by reacting E2 with 2-iodoxybenzoic acid (IBX) and then separating the mixture by HPLC as described [25]. The depurinating DNA adduct standards were synthesized by published procedures [26,27]. Cell culture media were purchased from Mediatech, Inc (Herndon, VA). All other chemicals were obtained from Sigma (St. Louis, MO).
2.2. Cell lines and cell culture
MCF-10F cells were obtained from the ATCC (Rockville, MD) and cultured in DMEM and Ham's F12 medium (Mediatech, Inc.) with 20 ng/ml epidermal growth factor, 0.01 mg/ml insulin, 500 ng/ml hydrocortisone, 5% horse serum and 100 μg/ml penicillin/streptomycin mixture. Estrogen-free medium was prepared in phenol red-free DME/F12 medium with charcoal-stripped FBS (HyClone, Logan, UT). Cell viability was determined by the MTT [3,(4,5-dimethylthiazol- 2-yl)-2,5-diphenyltetrazolium bromide] assay [28].
2.3. Western Blots
Cell cultures were exposed to various concentrations of TCDD for 72 h and 4-OHE2 or Ro41−0960 for 24 h. After treatment, cells were harvested and then lysed in RIPA buffer with protease inhibitor. Nuclei and unlysed cellular debris were removed by centrifugation. Protein concentrations were determined by using the BCA protein assay kit (Pierce Biotechnology, Rockford, IL). Western blot procedures were previously described [24]. Dilutions of primary anti-CYP1A1, CYP1B1, β-actin (Genetest, Bedford, MA) and COMT (Chemicon International, Temecula, CA) antibodies were made in blocking solution (3% non-fat dry milk in PBS). The blots were incubated for 3 h with primary antibody and for 1 h with secondary antibody at room temperature. After each step, blots were washed with PBST (PBS and 0.1% Tween-20), incubated with ECL solution (Amersham Biotech, Piscataway, NJ) for 1 min, and visualized with radiographic film. Intensities of the bands were quantified by Alpha DigiDoc 1201 (Alpha Innotech, San Leandro, CA).
2.4. Determination of COMT activity by HPLC using 4-OHE2 as the substrate
COMT enzymatic activity was determined by using HPLC with electrochemical detection (ECD), as described previously [13,29] with minor modifications. Cellular COMT from control and TCDD (0.1−30 nM), 4-OHE2 (0.1−30 μM) or Ro41−0960 (0.1−30 μM) treated MCF-10F cells was prepared, as described above. Enzyme reactions were carried out in a final volume of 250 μl of 0.1 M sodium phosphate (pH 7.8) containing 1mM DTT, 5 mM MgCl2, cytosolic proteins (50 μg), varying amounts (0−100 μM) of CE substrate 4-OHE2, and 200 μM S-adenosylmethionine (SAM, saturating). The incubation mixture, except for the CE substrate, was pre-incubated for 3 min at 37 °C. Then, the reaction was initiated by adding 5 μl of various concentrations of 4-OHE2 in DMSO and terminated after 27 min by adding 25 μl of 4 M perchloric acid. Following centrifugation to precipitate proteins, the supernatant (245 μl) was passed through a 5,000 M.W. cut-off filter (Millipore, Billerica, MA), and 200 μl of each sample was analyzed by HPLC. The extracts were subjected to HPLC analysis on a reverse phase Luna-2 C18 column (250 × 4.6 mm, 5 μm; Phenomenex, Torrance, CA) in a system equipped with dual ESA Model 580 solvent delivery modules, an ESA Model 540 autosampler and a 12-channel CoulArray electrochemical detector (ESA, Chelmsford, MA). The serial array of 12 coulometric electrodes was set at potentials between −35 and 690 mV. The data were acquired and processed using the CoulArray software package (ESA). Peaks were identified by both retention time and peak height ratios between the dominant peak and the peaks in the two adjacent channels. Metabolites and DNA adducts were quantified by comparison of peak response ratios with known amounts of standards. When necessary, the identity of the analytes was confirmed by ultraperformance liquid chromatography/tandem mass spectrometry (UPLC/MS/MS).
2.5. Inhibition of COMT activity by Ro41−0960 in vitro
Cytosolic proteins (50 μg from MCF-10F cell lysate) were pre-incubated at 37 °C in assay buffer [200 mM potassium phosphate (pH 7.8), 5 mM MgCl2, 1 mM DTT, 0.2 mM SAM] with various concentrations of Ro41−0960 (0.1, 1, 3, and 10 μM) or DMSO for 7 min, then the substrate, 0.1 mM 4-OHE2 was added and the mixture was incubated for 23 min. The reactions were terminated by adding 25 μl of 4 M perchloric acid, and the samples were analyzed as described above. The inhibition of COMT activity by Ro41−0960 was compared to the DMSO control, and the remaining activity was expressed as percent of control enzyme activity.
2.6. HPLC analysis of estrogen metabolites and depurinating DNA adducts
To determine the effect of TCDD on estrogen metabolism, the medium was replaced with estrogen-free medium for 12 h and the cells exposed to 0−30 nM TCDD for 72 h. Then, 1 μM E2 was added and incubation was continued for 24 h. To investigate the effect of inhibiting COMT activity on the levels of CE and depurinating DNA adducts, MCF-10F cells were pretreated with TCDD (10 nM) for 72 h, then treated with E2 (0.1−30 μM) with or without 3 μM Ro41−0960 for 24−72 h. To directly determine the relationship between the concentration of 4-OHE2 and formation of depurinating DNA adducts, cells were treated with increasing concentrations (0−30 μM) of 4-OHE2 for 24 h. The media were collected and 2 mM ascorbic acid added to protect E2 metabolites from oxidative degradation. The assay of metabolism of E2 was modified from previously described procedures [30]. In brief, media were processed by various concentration methods and the methanol/water mixtures were applied to a Certify II Sep-Pak cartridge. The extracts were subjected to HPLC analysis, as described above.
2.7. Statistical analysis
The statistical significance of the results was determined by Student's-test and ANOVA analysis by using SAS and Prizm software.
3. Results
3.1. Expression and activity of COMT determined by Western blot and HPLC using MCF-10F cellular extracts
The phase II enzyme COMT is considered to be a key enzyme in decreasing the effects of 4-OHE1(E2) by converting the CE into the corresponding methyl ether. COMT is not easily induced or suppressed. In the present study, COMT protein levels were measured in TCDD (0−30 nM), 4-OHE2 (0−60 μM) or Ro41−0960 (0−30 μM) treated MCF-10F cells by Western blot. COMT is expressed predominantly as S-COMT in most human tissues examined, and we found that S-COMT predominated in the MCF-10F cells. The levels were consistent with reported levels [31]. Treatment with TCDD did not increase the level of COMT proteins (data not shown). MCF-10F cells were treated with increasing concentrations of 4-OHE2 (1−60 μM) with or without TCDD (10 nM) pretreatment for 24 h. COMT was detectable in untreated MCF-10F cells and protein levels were not changed with increasing concentrations of its substrate, 4-OHE2 (Figure 2a). Although Ro41−0960 competitively inhibits the activity of COMT, it does not change the protein levels of COMT (data not shown).
Fig. 2.
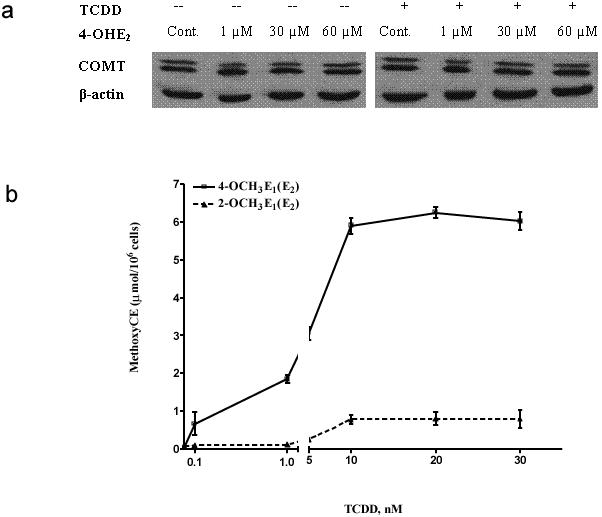
(a) Western blot of COMT protein expression in MCF-10F cells treated with increasing concentrations of 4-OHE2 with or without TCDD for 24 h. The representative immunoblots (from 3 replicates) demonstrate that anti-COMT antibody recognizes both the 30 kD membrane-bound form and 25 kD soluble form with the soluble form predominating in MCF-10F cells. Each lane contains 30 μg of cell lysate. Intensity of the bands was quantified by Alpha DigiDoc 1201 and normalized to β-actin. (b) TCDD-induced metabolism of E2 to 4-OCH3E1(E2) and 2-OCH3E1(E2). MCF-10F cells were treated with 0−30 nM TCDD for 72 and then with 1 μM E2 for 24 h. Extracts from cell culture medium were analyzed by HPLC. Data represent the mean ± SD of triplicate cultures from 6 experiments.
Although protein levels of enzymes may be similar, they can differ in catalytic activity [32]. To investigate the activity of COMT in TCDD- or 4-OHE2- treated MCF-10F cells and to validate findings from the Western blot experiments, catalytic activities were measured using 4-OHE2 as the substrate. The inhibition of COMT activity by Ro41−0960 was compared to a DMSO control, and the remaining activity was expressed as percent of control enzyme activity. Data from the in vitro experiments showed that no significant change was seen in COMT activity in cells treated with increasing concentrations of TCDD or 4-OHE2, compared with control: 2.3 ± 0.6 μM 4-OHE2 was methylated to 4-OCH3E2 by 50 μg of cellular COMT protein. Ro41−0960 fully inhibited COMT activity at a concentration of 1 μM and decreased COMT activity to 23% of the control at 0.1 μM in the reaction system with saturating concentrations of SAM (200 μM) and 4-OHE2 (100 μM).
3.2. Estrogen metabolism in TCDD-induced MCF-10F cells treated with E2
To examine the profile of estrogen metabolism in MCF-10F cells, an HPLC method with ECD was modified. Each metabolite has a distinct retention time and is oxidized as a characteristic cluster of oxidation peaks that are observed in two or more adjacent channels [30]. Standard solutions of each compound were combined to generate equimolar mixtures containing varying concentrations of each standard and injected onto the column. These standard solutions were then used to generate calibration curves. Standard curves were linear between 250 and 1000 pmol (data not shown). The limit of detection under the conditions of analysis was ∼10 pmol on the column.
The profile of metabolites produced was first assessed in control or TCDD-pretreated MCF-10F cells subsequently treated with 0.1−30 μM E2. In non-TCDD-treated MCF-10F cells, metabolism of E2 was very limited. After 24 h, 95% of the estrogen recovered was unmetabolized; some E2 had been converted to E1, and the combination of other metabolites represented < 5% of the total (Table 1). In contrast, in cells pretreated with TCDD (Table 2), metabolism was primarily to 4-OCH3E1(E2) (28%) and 4-OHE1(E2) (1.2%). Formation of the corresponding 2-OHE1(E2) was very low; 2-OHE1(E2) and 2-OCH3E1(E2) combined were < 3.8% of the total. The average ratio of 4-OCH3E1(E2)/2-OCH3E1(E2) was about 9:1. To learn whether the TCDD-induced formation of 4-OHE1(E2) and 2-OHE1(E2) is related to incubation time with E2 after induction by TCDD (10 nM), TCDD-pretreated MCF-10F cells were incubated with 1 μM E2 for 1−72 h. The data show that formation of estrogen metabolites can be seen by 6 h, with a maximum at 6−24 h, and these metabolites start to degrade after 72 h (data not shown). TCDD-induced formation of estrogen metabolites is also related to the time of incubation with E2 (data not shown). To determine the best induction concentration and time for TCDD, MCF-10F cells were treated with various concentrations (0−30 nM) of TCDD for 24−72 h. TCDD induced formation of estrogen metabolites in a dose-dependent fashion (Figure 2b). The maximal response for E2 metabolism was achieved following treatment with 10 nM TCDD, and the optimal time for maximum induction was 72 h. Therefore, 10 nM TCDD for 72 h was used in subsequent experiments. The analysis of estrogen metabolites by HPLC also showed that the best time for detecting catechol metabolites (4-OHE2 and 2-OHE2) is 6−24 h after adding E2 into the medium and for DNA adducts is 48−72 h (data not shown).
Table 1.
Profile of estrogen metabolism in E2-treated MCF-10F cells with or without Ro41−0960a
| E2 (without COMT inhibitor) | E2 + Ro41−0960 (with COMT inhibitor) | |||||||
|---|---|---|---|---|---|---|---|---|
| 0.1 μM | 1 μM | 10 μM | 30 μM | 0.1 μM | 1 μM | 10 μM | 30 μM | |
| pmol/106 cells | ||||||||
| E1(E2) | 57 (± 4)b | 151 (± 7) | 354 (± 9) | 705 (± 18) | 44 (± 5) | 124 (± 14) | 268 (± 10) | 375 (± 13) |
| 4-OHE1(E2) | 0.11 (± 0.01) | 0.21 (± 0.04) | 1.45 (± 0.24) | 4.0 (± 0.4) | 0.17 (± 0.03) | 0.73 (± 0.08) | 2.71 (± 0.25) | 6.68 (± 0.38) |
| 2-OHE1(E2) | 0.05 (± 0.01) | 0.10 (± 0.12 | 0.66 (± 0.07) | 1.63 (± 0.21) | 0.09 (± 0.01) | 0.26 (± 0.05) | 1.28 (± 0.18) | 2.72 (± 0.16) |
| 4-OCH3E1(E2) | 1.42 (± 0.16) | 5.18 (± 0.60 | 11.97 (± 1.96) | 37 (± 1) | 0.03 (± 0.01) | 0.02 (± 0.01) | 0.13 (± 0.06) | 0.25 (± 0.08) |
| 2-OCH3E1(E2) | 0.42 (± 0.04) | 1.20 (± 0.08 | 3.64 (± 0.59) | 12 (± 1) | nd | nd | 0.12 (± 0.04) | 0.21 (± 0.09) |
| 4-OHE1(E2)-1-N3Ade | ndc | nd | nd | nd | nd | nd | 0.08 (± 0.01) | 0.35 (± 0.08) |
| 4-OHE1(E2)-1-N7Gua | nd | nd | nd | nd | nd | nd | 0.06 (± 0.02) | 0.36 (± 0.06) |
0.5 × 10⁶ cells were plated in normal medium for 24 h, then the medium was changed to estrogen-free medium for 72 h. After changing with fresh estrogen-free medium, cells were preincubated with or without Ro41−0960 for 2 h before incubation with 0.1−30 μM E2 for 24 h. Media were collected, extracted by using a C8 cartidge and analyzed by HPLC with ECD.
The estrogen metabolite and depurinating DNA adduct levels were corrected for recovery and normalized to cell numbers. The standard deviation is presented in parentheses.
Not detected.
Table 2.
Effect of COMT inhibition on the formation of CE and methoxyCE in TCDD-pretreated E2-treated MCF-10F cellsa
| E2 (without COMT inhibitor) | E2 + Ro41−0960 (with COMT inhibitor) | |||||||
|---|---|---|---|---|---|---|---|---|
| pmol/106 cells | ||||||||
| 0.1 μM | 1 μM | 10 μM | 30 μM | 0.1 μM | 1 μM | 10 μM | 30 μM | |
| E1(E2) | 76 | 2986 | 4833 | 5071 | 13 | 547 | 1192 | 2861 |
| (± 3)b,c | (± 172) | (± 141) | (± 552) | (± 2) | (± 48) | (± 63) | (± 159) | |
| 4-OHE1(E2) | ndd | 12.1 | 23.1 | 198 | nd | 11.1 | 272 | 331 |
| (± 0.7) | (± 0.7) | (± 40) | (± 0.9) | (± 14) | (± 60) | |||
| 2-OHE1(E2) | nd | 9.5 | 2.3 | 20.5 | nd | 2.7 | 78 | 36 |
| (± 0.5) | (± 0.1) | (± 1.9) | (± 0.2) | (± 4) | (± 5) | |||
| 4-OCH3E1(E2) | 88 | 445 | 1650 | 3265 | nd | nd | 4.9 | 7.6 |
| (± 1.1) | (± 26) | (± 48) | (± 206) | (± 0.3) | (± 0.9) | |||
| 2-OCH3E1(E2) | 12.6 | 111 | 263 | 321 | nd | nd | 7.9 | 3.0 |
| (± 0.2) | (± 6) | (± 8) | (± 30) | (± 0.4) | (± 0.6) | |||
Cells were plated (∼40% confluence) and pretreated with 10 nM TCDD for 72 h. Cultures were preincubated with or without Ro41−0960 2 h before incubation with 0.1−30 μM E2 for 24 h. Medium was collected, extracted and analyzed by HPLC with ECD.
The estrogen metabolite levels detected were corrected for recovery and normalized to cell count.
Data represent the mean ± standard deviation of triplicate cultures from one representative experiment.
Not detected.
3.3. Effects of COMT inhibition on levels of catechol estrogens and methoxy catechol estrogens
In preliminary toxicity experiments, cell growth was not affected by treatment with 10 μM Ro41−0960 for up to 72 h (data not shown). This concentration of inhibitor reduced COMT activity 87 and 99% at 24 and 72 h, as assessed by methylation of the COMT substrate 4-OHE2 (data not shown). To determine the effect of COMT inhibition on E2 metabolism, TCDD- pretreated MCF-10F cells were exposed to 1 μM E2 for 24 h in the presence of 3 μM Ro41−0960 (Table 2). The COMT inhibitor decreased the concentration of 4-OCH3E1(E2) by 99% and 2-OCH3E1(E2) to undetectable levels. This was accompanied by a 2 to 5-fold increase in 4-OHE2 concentration, whereas no significant change was seen in 2-OHE2 levels. Therefore, 4-OHE2, which represented 3 % of the total estrogen metabolites recovered without COMT inhibition, was 80% of the total recovered with COMT inhibition. The corresponding 4-OCH3E1(E2) concentrations were 77 and < 0.1% of the total, respectively. The level of E1(E2) remaining in cells treated with the COMT inhibitor was lower than that in cells without inhibitor, suggesting that E2 metabolism was increased in the presence of the inhibitor (Table 2).
3.4. Effect of COMT inhibition on the formation of depurinating DNA adducts
To investigate the effects of COMT inhibition in TCDD-induced E2-treated MCF-10F cells, the effects of Ro41−0960 on CE-DNA adduct levels were studied. MCF-10F cells were exposed to 10 nM TCDD for 72 h, then incubated with 0.1−30 μM E2 for 72 h with or without Ro41−0960. The profile of estrogen metabolites and depurinating DNA adducts was determined in cell culture medium by HPLC.
Initial experiments demonstrated that in TCDD-pretreated MCF-10F cells exposed to 1 μM E2 for up to 24 h, similarly to non-E2-treated controls, no depurinating DNA adducts were detected (data not shown). However, when the cells were treated with E2 while COMT activity was concurrently inhibited, depurinating DNA adduct levels continued to rise for the entire duration of treatment.
There were no significant differences in DNA adduct levels in cells treated with 3 μM COMT inhibitor, TCDD alone, 10 μM E2, TCDD plus 10 μM E2, or TCDD plus 3 μM inhibitor (Figure 3). In contrast, statistically significant 3-fold increases in the levels of depurinating DNA adducts were seen when TCDD-pretreated cells were incubated with 0.1−30 μM E2 in the presence of 3 μM Ro41−0960 (p<0.05, as determined by ANOVA). This increase in DNA adducts was dose-dependent with increasing concentrations of E2 and was associated with an increase in the concentration of 4-OHE1(E2). Linear regression analysis of the depurinating DNA adduct levels in the medium was carried out to determine their association with the levels of 4-OHE1(E2). The results indicate that the increased depurinating DNA adduct concentrations in cell culture media were associated with high 4-OHE1(E2) levels (R2 = 0.78) and low 4-OCH3E1(E2) levels (data not shown).
Fig. 3.

Effect of COMT inhibition on the formation of depurinating DNA adducts in MCF-10F cells treated with TCDD and E2 with or without Ro41−0960. The cells were pretreated with TCDD and then treated with various concentrations of E2 in the presence or absence of Ro41−0960. The levels of adducts in the cells treated with Ro41−0960 are significantly different from the untreated cells, p< 0.05 as determined by ANOVA.
To study whether the increase in CE-DNA adducts could be attributed to decreased COMT activity, methoxy CE levels were determined in the culture medium by HPLC. TCDD increased E2 metabolism, primarily to 4-OCH3E1(E2) and 2-OCH3E1(E2), and formation of 4-OHE1(E2) and 2-OHE1(E2) was low without Ro41−0960. In contrast, Ro41−0960 blocked formation of 4- and 2-OCH3E1(E2), and increased levels of 4- and 2-OHE1(E2) were detected. Incubation with 3 μM Ro41−0960 inhibited methoxy CE formation in MCF-10F cells by about 99%. In culture medium from MCF-10F cells incubated with increasing concentrations of E2 and 3 μM Ro41−0960, the COMT inhibitor decreased the concentration of 4-OCH3E1(E2) and 2-OCH3E1(E2) to undetectable levels, while a concentration-dependent increase in CE formation was seen. These data indicate that the increase in CE-DNA adducts was due to COMT inhibition that resulted in a decreased inactivation of the CE, as shown by decreased methoxy CE formation (Table 2).
To directly determine the relationship between the concentration of 4- OHE2 and formation of depurinating DNA adducts, cells were treated with increasing concentrations (0−30 μM) of 4-OHE2 for 24 h. The DNA adduct levels increased with increasing concentration of 4-OHE2 (Figure 4); they are consistent with previous data showing ∼3-fold increases in DNA adduct levels when COMT activity was inhibited. The graph of the concentration of 4-OHE2 versus the amount of DNA adducts in the presence of 3 μM Ro41−0960 yielded a line with a slope of 0.1 (p < 0.01 by linear regression analysis) and an R2 =0.97 (by correlation analysis), suggesting a direct relationship between CE metabolite levels and DNA adducts in the absence of COMT activity and O-methylated metabolites (Figure 4).
Fig. 4.

Effect of the concentration of 4-OHE2 on the formation of depurinating DNA adducts in MCF-10F cells. Linear regression analysis was conducted by graphing individual data points (n=3) from cells pretreated with TCDD, then treated with increasing concentrations of 4-OHE2 in the presence of 3 μM Ro41−0960.
4. Discussion
When estrogen metabolism is balanced, low levels of CE-Q are formed and, consequently, the likelihood of DNA damage leading to cancer initiation is low. Maintaining balanced estrogen metabolism requires interplay between estrogen activating enzymes, such as the cytochrome P450s, and deactivating enzymes, such as COMT and quinone reductase [2]. COMT activity appears to play a key role in maintaining low levels of CE-Q. The role of COMT in balancing estrogen metabolism was explored in MCF-10F, immortalized human breast epithelial cells.
MCF-10F cells normally have low levels of the estrogen activating enzymes, CYP1A1 and CYP1B1. Thus, after treatment of the cells with E2, the levels of 2-OHE1(E2) and 4-OHE1(E2) in these cells are low (Table 1). In fact, almost all of the CE are present as 2-OCH3E1(E2) and 4-OCH3E1(E2), and depurinating DNA adducts are not detected. When estrogen metabolism is unbalanced by inhibiting COMT, slightly higher levels of CE are detected, and formation of methoxy CE is virtually eliminated (Table 1). With COMT inhibited, however, the depurinating DNA adducts can be detected when the MCF-10F cells are treated with higher levels of E2.
Induction of CYP1B1 by pretreatment of the cells with TCDD dramatically increases E2 metabolism, with formation of high levels of 2-OCH3E1(E2) and 4-OCH3E1(E2) (Table 2). Inclusion of Ro41−0960 to inhibit COMT increases the levels of 2-OHE1(E2) and 4-OHE1(E2), almost eliminates formation of the methoxy CE and increases formation of 4-OHE1(E2)-1-N3Ade and 4-OHE1(E2)-1-N7Gua as a function of the level of TCDD used to induce CYP1B1 (Figures 2b and 3).
To explore the possibility that COMT levels might respond to substrate induction, the levels of COMT protein and activity were analyzed in MCF-10F cells treated with 0−60 μM 4-OHE2 (Figure 2a). No changes in the levels of COMT protein or activity were observed. Although COMT activity was fully inhibited by Ro41−0960 in cell extracts incubated with 4-OHE2 at a low concentration of 1 μM Ro41−0960, a concentration of 3 μM was needed to achieve a similar effect when the whole cells were treated with the inhibitor (Tables 1 and 2).
Formation of the depurinating DNA adducts should be proportional to the concentration of E2-3,4-Q available to react with DNA. In fact, when the cells were treated with 4-OHE2, the levels of 4-OHE1(E2)-1-N3Ade and 4-OHE1(E2)-1-N7Gua detected in the cells were proportional to the level of 4-OHE2 used to treat the cells (Figure 4).
This is the first study to explore the role of COMT in the formation of estrogen metabolites and depurinating DNA adduct levels in a normal human breast epithelial cell line under conditions in which E2 metabolism has been enhanced by TCDD. COMT activity can be limited by the presence of low-activity genetic polymorphisms [15-21] or by low expression of the enzyme. In this study, inhibition of COMT activity was shown to increase the formation of depurinating CE-DNA adducts in MCF-10F cells. Formation of these adducts and the concomitant apurinic sites in DNA have been shown to induce mutations that are associated with initiation of breast cancer [5-7]. Therefore, a low level of COMT activity may be a critical factor in the initiation of breast cancer by increasing metabolism of estrogens to form CE-DNA adducts.
Acknowledgements
F. Lu was supported by a fellowship from the University of Nebraska Environmental Toxicology Graduate Program. This study was supported by U.S.P.H.S. grant P01 CA49210 from the National Cancer Institute and Department of Defense grant DAMD17-03-1-0299 from the U.S. Army Breast Cancer Research Program. Core support at the Eppley Institute was provided by grant P30 CA36727 from the National Cancer Institute.
Glossary
Abbreviations:
- E1(E2)
estrone (estradiol)
- CE
catechol estrogen(s)
- CE-3,4-Q
catechol estrogen-3,4-quinone(s)
- 2- and 4-OHE1(E2)
2- and 4-hydroxyestrone(estradiol)
- 2- and 4-OCH3E1(E2)
2- and 4-methoxyestrone(estradiol)
- COMT
catechol-O-methyltransferase
- CYP
cytochrome P450
- Ro41−0960
2'-fluoro-3,4-dihydroxy-5-nitrobenzophenone
- TCDD
2,3,7,8-tetrachlorodibenzo-p-dioxin
- HPLC (ECD)
High pressure liquid chromatography (with multi-channel electrochemical detection)
Footnotes
Publisher's Disclaimer: This is a PDF file of an unedited manuscript that has been accepted for publication. As a service to our customers we are providing this early version of the manuscript. The manuscript will undergo copyediting, typesetting, and review of the resulting proof before it is published in its final citable form. Please note that during the production process errors may be discovered which could affect the content, and all legal disclaimers that apply to the journal pertain.
References
- 1.Henderson BE, Feigelson HS. Hormonal carcinogenesis. Carcinogenesis. 2000;21:427–433. doi: 10.1093/carcin/21.3.427. [DOI] [PubMed] [Google Scholar]
- 2.Cavalieri E, Chakravarti D, Guttenplan J, Hart E, Ingle J, Jankowiak R, Muti P, Rogan E, Russo J, Santen R, Sutter T. Catechol estrogen quinones as initiators of breast and other human cancers: Implications for biomarkers of susceptibility and cancer prevention. BBA Reviews on Cancer. 2006;1766:63–78. doi: 10.1016/j.bbcan.2006.03.001. [DOI] [PubMed] [Google Scholar]
- 3.Zhu BT, Conney AH. Functional role of estrogen metabolism in target cells: Review and perspectives. Carcinogenesis. 1998;19:1–27. doi: 10.1093/carcin/19.1.1. [DOI] [PubMed] [Google Scholar]
- 4.Spink DC, Spink BC, Cao JQ, DePasquale JA, Pentecost BT, Fasco MJ, Li Y, Sutter TR. Differential expression of CYP1A1 and CYP1B1 in human breast epithelial cells and breast tumor cells. Carcinogenesis. 1998;19:291–298. doi: 10.1093/carcin/19.2.291. [DOI] [PubMed] [Google Scholar]
- 5.Chakravarti D, Mailander PC, Li K-M, Higginbotham S, Zhang HL, Gross ML, Meza JL, Cavalieri EL, Rogan EG. Evidence that a burst of DNA depurination in SENCAR mouse skin induces error-prone repair and forms mutations in the H-ras gene. Oncogene. 2001;20:7945–7953. doi: 10.1038/sj.onc.1204969. [DOI] [PubMed] [Google Scholar]
- 6.Mailander PC, Meza JL, Higginbotham S, Chakravarti D. Induction of A.T to G.C mutations by erroneous repair of depurinated DNA following estrogen treatment of the mammary gland of ACI rats. J. Steroid Biochem. Mol. Biol. 2006 doi: 10.1016/j.jsbmb.2006.06.019. in press. [DOI] [PubMed] [Google Scholar]
- 7.Zhao Z, Kosinska W, Khmelnitsky M, Cavalieri EL, Rogan EG, Chakravarti D, Sacks PG, Guttenplan JB. Mutagenic activity of 4-hydroxyestradiol, but not 2-hydroxyestradiol, in BB rat2 embryonic cells, and the mutational spectrum of 4-hydroxyestradiol. Chem. Res. Toxicol. 2006;19:475–479. doi: 10.1021/tx0502645. [DOI] [PubMed] [Google Scholar]
- 8.Russo J, Lareef MH, Tahin O, Hu YF, Slater C, Ao X, Russo IH. 17Beta-estradiol is carcinogenic in human breast epithelial cells. J. Steroid Biochem. Mol. Biol. 2002;80:149–162. doi: 10.1016/s0960-0760(01)00183-2. [DOI] [PubMed] [Google Scholar]
- 9.Russo J, Lareef MH, Balogh G, Guo S, Russo IH. Estrogen and its metabolites are carcinogenic agents in human breast epithelial cells. J. Steroid Biochem. Mol. Biol. 2003;87:1–25. doi: 10.1016/s0960-0760(03)00390-x. [DOI] [PubMed] [Google Scholar]
- 10.Lareef MH, Garber J, Russo PA, Russo IH, Heulings R, Russo J. The estrogen antagonist ICI-182−780 does not inhibit the transformation phenotypes induced by 17-beta-estradiol and 4-OH estradiol in human breast epithelial cells. Int. J. Oncol. 2005;26:423–429. [PubMed] [Google Scholar]
- 11.Mannisto PT, Kaakkola S. Catechol-O-methyltransferase (COMT): Biochemistry, molecular biology, pharmacology, and clinical efficacy of the new selective COMT inhibitors. Pharmacol. Rev. 1999;51:593–628. [PubMed] [Google Scholar]
- 12.Gaikwad NW, Rogan EG, Cavalieri EL. Evidence for NQO1-catalyzed reduction of estrogen ortho-quinones. Mass spectrometric determination of enzyme-substrate complex. J. Biol. Chem. 2006 submitted. [Google Scholar]
- 13.Hersey RM, Williams KI, Weisz J. Catechol estrogen formation by brain tissue: Characterization of a direct product isolation assay for estrogen-2- and 4-hydroxylase activity and its application to studies of 2- and 4-hydroxyestradiol formation by rabbit hypothalamus. Endocrinology. 1981;109:1912–1920. doi: 10.1210/endo-109-6-1912. [DOI] [PubMed] [Google Scholar]
- 14.Cohn CK, Dunner DL, Axelrod J. Reduced catechol-O-methyltransferase activity in red blood cells of women with primary affective disorder. Science. 1970;70:1323–1324. doi: 10.1126/science.170.3964.1323. [DOI] [PubMed] [Google Scholar]
- 15.Lavigne JA, Helzlsouer KJ, Huang HY, Strickland PT, Bell DA, Selmin O, Watson MA, Hoffman S, Comstock GW, Yager JD. An association between the allele coding for a low activity variant of catechol-O-methyltransferase and the risk for breast cancer. Cancer Res. 1997;57:5493–5497. [PubMed] [Google Scholar]
- 16.Huang CS, Chern HD, Chang KJ, Cheng CW, Hsu SM, Shen CY. Breast cancer risk associated with genotype polymorphism of the estrogen metabolizing genes CYP17, CYP1A1, and COMT: A multigenic study on cancer susceptibility. Cancer Res. 1999;59:4870–4875. [PubMed] [Google Scholar]
- 17.Yim D-S, Park SK, Yoo K-Y, Yoon K-S, Chung HH, Kang HJ, Ahn SH, Noh DY, Choe KJ, Jang IJ, Shin SG, Strickland PT, Hirvonen A, Kang D. Relationship between the val158met polymorphism of catechol O-methyl transferase and breast cancer. Pharmacogenetics. 2001;11:1–8. doi: 10.1097/00008571-200106000-00001. [DOI] [PubMed] [Google Scholar]
- 18.Thompson PA, Shields PG, Freudenheim JL, Stone A, Vena JE, Marshall JR, Graham S, Laughlin R, Nemoto T, Kadlubar FF, Ambrosone CB. Genetic polymorphisms in catechole-O-methyltransferase, menopausal status, and breast cancer risk. Cancer Res. 1998;58:2107–2110. [PubMed] [Google Scholar]
- 19.Millikan R, Pittman GS, Tse C-KJ, Duell E, Newman B, Savitz D, Moorman PG, Boissy RJ, Bell DA. Catechol-O-methyltransferase and breast cancer risk. Carcinogenesis. 1998;19:1943–1947. doi: 10.1093/carcin/19.11.1943. [DOI] [PubMed] [Google Scholar]
- 20.Wedren S, Rudqvist TR, Granath F, Weiderpass E, Ingelman-Sundberg M, Persson I, Magnusson C. Catechol-O-methyltransferase gene polymorphism and post-menopausal breast cancer risk. Carcinogenesis. 2003;24:681–687. doi: 10.1093/carcin/bgg022. [DOI] [PubMed] [Google Scholar]
- 21.Lachman HM, Papolos DF, Saito T, Yu YM, Szumlanski C, Weinshilboum RM. Human catechol-O-methyltransferase pharmacogenetics: Description of a functional polymorphism and its potential application to neuropsychiatric disorders. Pharmacogenetics. 1996;6:243–250. doi: 10.1097/00008571-199606000-00007. [DOI] [PubMed] [Google Scholar]
- 22.Scanlon PD, Raymond FA, Weinshilboum RM. Catechol-O-methyltransferase: Thermolabile enzyme in erythrocytes of subjects homozygous for allele for low activity. Science. 1979;203:63–65. doi: 10.1126/science.758679. [DOI] [PubMed] [Google Scholar]
- 23.Garner CE, Burka LT, Etheridge AE, Matthews HB. Catechol metabolites of polychlorinated biphenyls inhibit the catechol-O-methyltransferase-mediated metabolism of catechol estrogens. Toxicol. Appl. Pharmacol. 2000;162:115–123. doi: 10.1006/taap.1999.8823. [DOI] [PubMed] [Google Scholar]
- 24.Chen ZH, Hurh YJ, Na HK, Kim JH, Chun YJ, Kim DH, Kang KS, Cho MH, Surh YJ. Resveratrol inhibits TCDD-induced expression of CYP1A1 and CYP1B1 and catechol estrogen-mediated oxidative DNA damage in cultured human mammary epithelial cells. Carcinogenesis. 2004;25:2005–2013. doi: 10.1093/carcin/bgh183. [DOI] [PubMed] [Google Scholar]
- 25.Saeed M, Zahid M, Rogan EG, Cavalieri EL. Synthesis of catechols of natural and synthetic estrogen by using 2-iodoxybenzoic acid (IBX) as the oxidizing agent. Steroids. 2005;70:173–178. doi: 10.1016/j.steroids.2004.11.005. [DOI] [PubMed] [Google Scholar]
- 26.Stack DE, Byun J, Gross ML, Rogan EG, Cavalieri EL. Molecular characteristics of catechol estrogen quinones in reactions with deoxyribonucleosides. Chem. Res. Toxicol. 1996;9:851–859. doi: 10.1021/tx960002q. [DOI] [PubMed] [Google Scholar]
- 27.Li K-M, Todorovic R, Devanesan P, Higginbotham S, Kofeler H, Ramanathan R, Gross ML, Rogan EG, Cavalieri EL. Metabolism and DNA binding studies of 4-hydroxyestradiol and estradiol-3,4-quinone in vitro and in female ACI rat mammary gland in vivo. Carcinogenesis. 2004;25:289–297. doi: 10.1093/carcin/bgg191. [DOI] [PubMed] [Google Scholar]
- 28.Denizot F, Lang R. Rapid colorimetric assay for cell growth and survival. Modifications to the tetrazolium dye procedure giving improved sensitivity and reliability. J. Immunol. Methods. 1986;89:271–277. doi: 10.1016/0022-1759(86)90368-6. [DOI] [PubMed] [Google Scholar]
- 29.Goodman JE, Jensen LT, He P, Yager JD. Characterization of human soluble high and low activity catechol-O-methyltransferase catalyzed catechol estrogen methylation. Pharmacogenetics. 2002;12:517–528. doi: 10.1097/00008571-200210000-00003. [DOI] [PubMed] [Google Scholar]
- 30.Rogan EG, Badawi AF, Devanesan P, Meza JL, Edney JA, West WW, Higginbotham SM, Cavalieri EL. Relative imbalances in estrogen metabolism and conjugation in breast tissue of women with carcinoma: Potential biomarkers of susceptibility to cancer. Carcinogenesis. 2003;24:697–702. doi: 10.1093/carcin/bgg004. [DOI] [PubMed] [Google Scholar]
- 31.Vidal JD, Vandevoort CA, Marcus CB, Lazarewicz NR, Conley AJ. 2,3,7,8-tetrachlorodibenzo-p-dioxin induces CYP1B1 expression in human luteinized granulosa cells. Arch. Biochem. Biophys. 2005;439:53–60. doi: 10.1016/j.abb.2005.04.024. [DOI] [PubMed] [Google Scholar]
- 32.Dawling S, Roodi N, Mernaugh RL, Wang X, Parl FF. Catechol-O-methyltransferase (COMT)-mediated metabolism of catechol estrogens: Comparison of wild-type and variant COMT isoforms. Cancer Res. 2001;61:6716–6722. [PubMed] [Google Scholar]