

Abstract
Segmental duplications (SDs) are low-copy repeats of DNA segments that have long been recognized to be involved in genome organization and evolution. But, to date, the mechanism of their formation remains obscure. We propose a model for SD formation that we name “duplication-dependent strand annealing” (DDSA). This model is a variant of the synthesis-dependent strand annealing (SDSA) model—a double-strand break (DSB) homologous repair model. DSB repair in Drosophila melanogaster genome usually occurs primarily through homologous repair, more preferentially through the SDSA model. The DDSA model predicts that after a DSB, the search for an ectopic homologous region—here a repeat—initiates the repair. As expected by the model, the analysis of SDs detected by a computational analysis of the D. melanogaster genome indicates a high enrichment in transposable elements at SD ends. It shows moreover a preferential location of SDs in heterochromatic regions. The model has the advantage of also predicting specific traces left during synthesis. The observed traces support the DDSA model as one model of formation of SDs in D. melanogaster genome. The analysis of these DDSA signatures suggests moreover a sequestration of the dissociated strand in the repair complex.
Segmental duplications (SDs), defined as low-copy repeats of DNA segments, have long been recognized to be involved in genome organization and evolution (Muller 1936; Ohno 1970). Prior to the advent of genome sequencing, it was not possible to take into account the totality of the gene environment when analyzing duplicated genes. It is now clear that many duplicated genes are part of larger duplicated segments (Skrabanek and Wolfe 1998; Sankoff 2001). Duplications of individual genes, chromosomal segments containing any genomic constituent, such as genes and repeats, or entire genomes have long been thought to be the primary origin of genomic novelties, including new gene functions, found throughout the widespread existence of gene families and expression patterns (Ohno 1970; Holland et al. 1994; Sidow 1996). SDs also promote rearrangements through their own repeatability (Eichler 2001). They facilitate DNA rearrangements associated with several diseases that are referred to as genomic disorders. Indeed, genomic rearrangements can be responsible for Mendelian traits, contiguous gene syndromes, and whole-arm chromosome aberrations (Lupski 1998a, b, 2003; Stankiewicz and Lupski 2002).
In primate genomes, recent SDs that range from 1 to >300 kb in length and share a high sequence identity (>90%) have been detected. Fluorescent in situ hybridization (FISH) and in silico studies have shown that at least 5% of the human genome is composed of these SDs, often containing complete or partial copies of genes (Bailey et al. 2001, 2002). They have emerged during the past 35 million years of evolution of our taxa (Bailey et al. 2001, 2002; Eichler 2001; Lander et al. 2001; Venter et al. 2001; Cheung et al. 2003). These repeated sequences tend to be located preferentially in pericentromeric and subtelomeric regions (Bailey et al. 2001; Cheung et al. 2003). Although SDs play a significant role in genome evolution, the mechanism of their formation is still unclear. Samonte and Eichler (2002) proposed a two-step model to explain the formation of the primate SDs. In the first step, several donor loci interspersed throughout the genome transpose to one acceptor locus. In the second step, the new mosaic region created in the acceptor locus is then duplicated partially or completely in different locations. Newman and Trask (2003) showed that any region generated by duplication can thereafter be duplicated. This model does not fully explain the mechanism of SD formation. The fact that most of duplicated sequences are dispersed and not in tandem, argues against unequal crossing-over. SD organization, distribution, and evidence of repeats at SD breakpoints in several genomes (Bailey et al. 2003; Koszul et al. 2004) support double-strand break (DSB) repairs as one mechanism of SD formation. Moreover, after the analysis of recombination between repeats on heterologous chromosomes with an embryonic stem cell system, Richardson et al. (1998) proposed a homologous repair (HR) model of DSB to explain interchromosomal duplication in mammal genomes.
DSBs arise spontaneously during the cellular life of the cell. In response to a single DSB, the organism must trigger series of metabolic pathways to promote DNA repair and to restore the chromosomal integrity necessary for host survival. In doing so, cells maintain a fine balance between competing DSB repair pathways. These latter are generally classified into two categories: homologous repair (HR) or nonhomologous end-joining (NHEJ) (Paques and Haber 1999). Unlike the NHEJ models, the HR models predict that after a DNA DSB, a homologous region is used as a template to initiate the repair. At least three different mechanisms of HR have been proposed to repair mitotic cells: gene conversion, single-strand annealing, and break-induced recombination (Paques and Haber 1999). But only gene conversion can induce the transfer of genomic information from a donor molecule to the recipient molecule, i.e., the DSB site, in mitotic cells. Gene conversion can be explained by two models: (1) The double-strand break repair (DSBR) model (Szostak et al. 1983) explains the strong association of gene conversion with crossovers and results in semiconservative DNA synthesis. (2) The synthesis-dependent strand annealing (SDSA) model (Nassif et al. 1994) predicts that gene conversion is not associated with crossovers and thus results in conservative DNA synthesis. The SDSA model has been proposed for Drosophila after DSB repair studies that used P-element excision in mitotic cells. These studies show that DSB repair in D. melanogaster usually occurs primarily through HR and, more preferentially, by SDSA (Engels et al. 1990; Nassif et al. 1994; Rong and Golic 2003). In a reliable repair, the template sequence is located on the homologous chromosome or on the sister chromatid; but an ectopic site can sometimes be used, and thus be duplicated into the DSB site. Several observations suggest that any genomic region can be used as template to initiate repair. As a consequence, an ectopic DNA region can be duplicated at the DSB site (Rong and Golic 2003).
Consequently, we propose here a nonallelic homologous recombination (NAHR) model based on the SDSA model as one model to explain SD formation and specifically in D. melanogaster. For convenience in this paper, we named this SDSA model variant “DDSA” (duplication-dependent strand annealing) to refer to the use of an ectopic donor site during the repair process because of the presence of a repeated sequence at the site of the DSB. Indeed, repeated sequences offer more possible templates for the repair process and, consequently, seem to favor SD formation. Transposable elements (TEs), which are high copy number sequences repeated throughout the genome, represent good candidates. About 20% of the D. melanogaster genome is composed of TEs (Hoskins et al. 2002; Quesneville et al. 2005; Bergman et al. 2006), and these latter have already been shown to be involved in SD formation in other eukaryotic genomes. TE elements have been found at the junctions of SDs in the human (Bailey et al. 2003) and yeast (Koszul et al. 2004) genomes. TEs have also been found to be associated with chromosomal rearrangements such as deletions, duplications, inversions, translocations, and recombination (Finnegan 1989; Lim and Simmons 1994; Gray 2000).
To understand the mechanism of SD formation in D. melanogaster, we computationally searched for all SDs in this genome. Then, we carried out an in-depth analysis of the detected SDs. With these SDs, we found specific traces supporting the DDSA model.
Results
Detection of segmental duplications
In order to detect the SDs of a genome, one has (1) to distinguish the SDs from other repeats, such as TEs and satellites, respectively generated by mechanisms such as transposition and slippage during the replication process; and (2) to detectlarge duplicated segments without being disturbed by any insertions or deletions that may have taken place after the duplication.
Using a combination of programs (i.e., a pipeline) developed in our laboratory (Fig. 1), we were able to detect specifically the SDs of a genome. The method can be briefly sketched as follows (see Methods). First, we detected all repeated sequences in the genome with the BLASTER program using BLASTN repeatedly in an all-by-all genome comparison (Altschul et al. 1990, 1997; Quesneville et al. 2003, 2005). Second, to specifically detect repeats generated by a duplication process, we filtered out repetitive DNAs generated by other processes (Fig. 1). Therefore, we were able to eliminate all detected repeated sequences that did not correspond to a SD copy (i.e., TEs or microsatellites), using TE annotations of the D. melanogaster Release 4 genome (Quesneville et al. 2003, 2005) and microsatellite annotations detected with the TRF program (Benson 1999) (see Methods). To be more stringent, we also used annotations of potential new TEs detected by BLASTER with TBLASTX (Altschul et al. 1990, 1997; Quesneville et al. 2003, 2005) and a compilation of known eukaryotic TEs (Repbase Update Release 8.12; Jurka 2000).
Figure 1.

Flowchart representation of the SD detection pipeline. This pipeline combines a series of published programs and new programs. Published programs are represented by diamonds and ovals. Newly implemented programs are illustrated by gray-shaded boxes. A MySQL database manages the annotations and results. (1) Detection of all repeats; (2) elimination of all repeats belonging to microsatellite or TE regions; (3) merge and connection of contiguous repeats; (4) elimination of potential false-positive SDs (i.e., TEs); (5) clustering of repeats sharing similar regions.
Using this pipeline, we detected in the D. melanogaster genome 444 SDs corresponding to 138 groups of repeated sequences (Supplemental Table S1). Altogether, duplications represent ∼1.4% of the D. melanogaster genome (1.66 Mb/118.35 Mb). Up to half of the 444 SD copies have a pairwise sequence identity >97% (Supplemental Fig. S1). These sequences range from 346 bp to 81.1 kb in length (Supplemental Fig. S2). Forty-nine percent of SDs have a size >1 kb, with only 7.21% of SDs >10 kb (Table 1). The Drosophila genome appears significantly poor in large (>10 kb) blocks of duplications, as compared with human genome (Table 1). Copy number per duplication varies from two to 32 copies, i.e., groups with two to 32 sequences (Fig. 2).
Table 1.
Comparison of SD genome coverage percentage
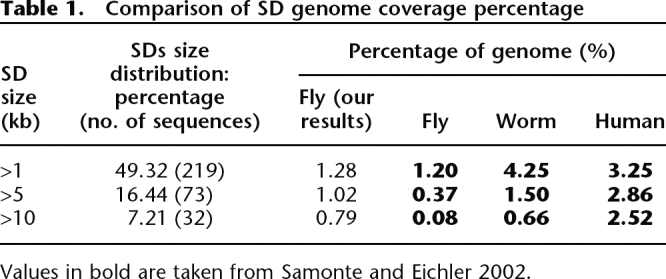
Values in bold are taken from Samonte and Eichler 2002.
Figure 2.

Distribution of SD copy number. This plot illustrates the distribution of the copy number per group of repeated copies. Each group corresponds to a set of similar sequences (SDs). The number of groups is labeled for each black bar. The three single-copy number groups correspond to tandem repeats that were detected as one sequence in one group. Our strategy of duplication detection connects the repeat units that are very close and in tandem (see Methods).
SD enrichment within heterochromatic regions
Chromosomes X and 4 present the highest SD densities, with 8.59 and 5.22 SDs per Mb, respectively. The values for chromosomes 2 and 3 are less than half of those (2.62 and 2.18 SDs per Mb, respectively). The pericentromeric regions of the chromosomes X, 2, and 3 show higher SD density (Fig. 3). Taken together, these observations indicate a high SD density in heterochromatic regions. Indeed, chromosome 4 of D. melanogaster appears to be enriched in heterochromatic domains, which would explain this high SD density (Sun et al. 2000). The high SD density of chromosome X comes from the central region of the X arm (Fig. 3). This region is also known to be under-replicated in polytene chromosomes, a hallmark of a heterochromatic state (Ashburner 1989). Kaufmann (1939) also suggests that this region contains heterochromatic material to explain a high break frequency observed in the central region of the X chromosome (cytogenetic map: from 10F to 13A). This region encompasses a cluster of tandemly repeated Stellate genes. Abramov’s studies (Abramov et al. 2005) suggest that this cluster is derived from a duplication of a Stellate gene cluster located in the heterochromatic part of the X chromosome (cytological location h26).
Figure 3.

Chromosomal distribution of detected SDs. SD distribution corresponds to black bars. The red line corresponds to TE distribution along the chromosomes. Blue and green dashed lines indicate centromeric and subtelomeric regions, respectively. Chromosomes were divided into equal-sized windows of 100 kb.
Comparing chromosomal SD distribution with that of TEs, SD location appears to correlate positively with TEs (excepted to the central region of the chromosome X). SDs located in heterochromatic regions generally correspond to high copy number repeats (>5 copies; data not shown). The highest copy number repeats—6 to 32 copies—are most often located in the middle of the X chromosome (cytogenetic map: 4F–13B; data not shown).
Series of duplication processes
A given genomic region might be involved partially or completely in several duplication events, leading to a high copy number SD. Thirty-six duplications occur in 3–5 copies, and only 10 duplications occur in >5 copies with a maximum of 32 copies (Fig. 2). Some of these duplications with >5 copies correspond to clusters of minisatellites that have already been described (Waring and Pollack 1987) as SARDM and X_DMR in Repbase Update (Supplemental Table S2; Jurka 2000). A repeat with 13 copies contained the “euchromatic Stellate gene cluster.” This cluster composed by repeats of 787 bp in length, are located in the middle of the X arm (cytogenetic map: 12E1–2) and have a mean sequence identity of 98.98% (Supplemental Table S2).
High copy number repeats (>5) present a significantly lower sequence identity (mean identity = 94.07%; Supplemental Table S2) than low copy number repeats (mean identity = 96.73%; Student’s t-test: t = 2.61, df = 28, P = 0.014). They also have significantly smaller size (median size = 829 bp) than duplications with 2 copies (median size = 1 kb; Pearson χ2 homogeneity test: χ2 = 7,477.27, df = 90, P ≤ 2.2 × 10⁻¹⁶). In addition, approximately three-fourths of these sequences are located on chromosome X (data not shown).
SD content
Among the 38.29% of the detected SD sequences that contain gene regions, we found not only tandemly repeated multigene families, such as Histone, Lipoprotein receptor, 5S rRNA, Hsp70B, and Stellate gene families, but also dispersed gene families such as Beta-tubulin and Actin genes. To explain the dynamics of the multigene families, Nei and Rooney (2005) proposed the “birth-and-death” evolution model. In this model, new genes are created by gene duplication, and some of the duplicate genes are maintained in the genome for a long time whereas other duplicate genes are deleted or become nonfunctional. Note that this model has been reported as the primary mode of evolution for several multigene families. Therefore, the high sequence identity observed for these duplications can be explained by the high selection pressure of old copies or because they have been generated by recent duplication events. Since 61.71% of the detected SD sequences did not contain any genes and because 26.20% of the genes found did not correspond to known multigene families (i.e., potential old copies), we can assume that the majority of our detected SDs were generated by recent duplication events because of their high sequence identity. According to this, one can expect to find traces left by the recent mechanism.
We analyzed the SD composition in TEs, microsatellites, and genes by comparing our results with sequences randomly drawn nearby with identical sizes, in order to be not affected by genomic environment bias, such as dense TE or microsatellite regions (see Methods). We generated 44,400 random sequences (100-fold the SD number). For each sequence, we calculated the fraction of genes, TEs, and microsatellites. Our results indicate a significantly higher TE fraction (mean = 21.44%) in comparison to the random sequences (mean = 13.75%) (Student’s t-test: t = 5.40, df = 44,842, P = 6.65 × 10⁻⁸). Multigene families can explain the significant difference observed for genes (26.32% versus 19.26% in random sequences; Student’s t-test: t = 4.73, df = 44,842, P = 2.23 × 10⁻⁶). A reduction in microsatellite number is found in duplicated compared to random sequences (9.79% instead of 12.98% in random sequences; Student’s t-test: t = −7.63, df = 41,995, P = 2.46 × 10⁻¹⁴). The high SD enrichment in TEs suggests a potential implication of repeats in SD formation.
Contribution of repeats to SD formation
In the NAHR models, the DSB repair process can be induced by the invasion of one broken end into a homologous repeat at an ectopic site. Then, the protein complex of synthesis continues the repair using as template the contiguous sequence of the homologous repeat. Consequently, the repeat and its contiguous sequence are duplicated together at the DSB site. We thus expected to find the trace of a repeat that has induced the duplication process at one of the duplication extremities. If SDs are formed by a NAHR mechanism, then repeats would be more frequent than expected by chance at SD ends. To test this prediction, we searched for repeats overlapping the SD ends.
For each sequence, we counted the repeats located at the ends, using TE and microsatellite annotations (Table 2). A goodness-of-fit χ2 test showed a significant difference between SD counts with TEs at SD ends and those from the set of random sequences obtained previously taken as the null hypothesis expectation (χ2 = 10.99, df = 2, P = 4.09 × 10⁻³). Moreover, we expected high copy number TE families to be more represented than others. Indeed, detected TEs correspond mainly to copies of Ine-1, which is the most highly represented TE (>2000 copies) in the D. melanogaster genome (Quesneville et al. 2005; Bergman et al. 2006). Microsatellites show also a significant enrichment in SD ends (χ2 = 16.63, df = 2, P = 2.45 × 10⁻⁴).
Table 2.
Percentage of repeats located at SD sequence ends

Values in parentheses correspond to the number of SDs. Control sequences were randomly selected in the neighborhood of the SD sequences and with identical sizes of SDs (see Methods).
The fact that random sequences selected in the same environment do not present the same proportion of sequences with repeats at one end as compared with SDs, suggests that repeats are involved in the duplication process but does not give insights on an underlying mechanism. According to the NAHR models, if a region of a repeat is used for the homology, the DNA synthesis can begin within the repeat and then continue on the contiguous sequence. We thus expect to identify the SD breakpoints within the repeat sequences (Linardopoulou et al. 2005) (Fig. 4). The alignment of extended SD copies allows us to identify distinctly a well-conserved region corresponding to the newly synthesized sequence, i.e., the duplication, flanked by more divergent sequences. Fluctuation of sequence conservation along the SD pair-wise alignment allows identification of a precise SD breakpoint location as the place where conservation drops down (Fig. 4B; Supplemental Fig. S5).
Figure 4.

SD breakpoint analysis. (A) This illustrates the NAHR result involving two copies of one TE (the two boxes correspond to the TE copies). Mechanisms of DSB repair according the NAHR models result in a TE copy hybrid. SD breakpoint is thus expected to be located in the copy TE at SD ends. (B) One example. The multiple alignment illustrated corresponds to SD breakpoint region. The breakpoint is shown by the transition from a conserved to a less-conserved region. The conserved region indicates the duplicated region (underlined in red).
We analyzed the SD breakpoint locations for SD copies flanked by TE copies. For 19 of the 86 unique duplication events, we identified the SD breakpoint locations within the TE overlapping the SD ends (Fig. 4; Supplemental Fig. S5). This observation supports a NAHR model as a duplication formation model with the TE contribution.
A majority of intrachromosomal duplication processes
Since the identification of donor and recipient sequences is difficult for high copy number repeats, we decided to continue our study with unique duplication events. In doing so, we selected all duplications with two copies. According to the high sequence identity between the two copies of each duplication event (Supplemental Fig. S1), we may assume that they occurred recently and derive directly one from another.
Eighty-six duplications have two copies (86 repeats of two copies, i.e., 172 sequences; Fig. 2). Among these sequences, 70.35% (121/172) are located on the chromosomes 2 and 3 (Table 3). Eighty-six percent of the duplication events (74/86) are intrachromosomal (i.e., on the same chromosome; Table 3). The intrachromosomal and interchromosomal duplications differ significantly in size (mean sizes are respectively 3.1 kb and 2.1 kb; Pearson’s χ2 test: χ2 = 552.22, df = 40, P < 2.2 × 10⁻¹⁶) but not in their chromosomal position (Pearson’s χ2 test: χ2 = 8, df = 6, P = 0.24).
Table 3.
Intrachromosomal and interchromosomal duplications

Contingency table of chromosomal location of SD sequences (172 sequences) for the 86 unique duplication events (see text). For each duplication event (involving the two-copy repeats), after the identification of the location for one SD sequence, we identify the location of the other SD sequence. For instance, a duplication with one SD sequence on the chromosome arm X and the other SD sequence on the chromosome 2L is counted at line 1 (X) and column 2 (2L). The table shows the cumulated results for all 86 data points. The first diagonal [40, 22, 32, etc.] corresponds to intrachromosomal duplication, i.e., the two sequences are located on the same chromosome. Because we counted the sequence numbers on each chromosome, numbers in the diagonal have to be divided by 2 to obtain the number of intrachromosomal duplication events on each chromosome.
In order to estimate the distance between the two intrachromosomal copies, we decided not to take into account the unassembled pericentromeric regions. We therefore collapsed the two arms (left arm [L] followed by the right arm [R]) of chromosomes 2 and 3. We then converted the coordinates of sequences located on the R arm. Distances between two intrachromosomal copies of chromosomes X, 2, 3, and 4 range from 192 bp to 13.7 Mb. A majority of intrachromosomal copies are located close to each other: in 50% of cases, the two copies are <14 kb apart.
DDSA model
As shown previously, the duplication process can be induced by homologous repeats through a NAHR model. Here, we propose a NAHR model based on the SDSA model, the preferential DSB repair model in D. melanogaster (Engels et al. 1990; Nassif et al. 1994; Rong and Golic 2003). We call this model DDSA to recall that it is a SDSA variant.
In our model, the mechanism starts with a DSB in or close to a copy of a repeated sequence (Fig. 5A). The “chewing back” on the two 5′ extremities leads to the exposure of the protruding 3′ OH free ends (Fig. 5B). One of these extremities searches for an intact homologous region to initiate the repair. When the extremity stands within a repeat (e.g., a TE copy), the homologous region can be another copy of this repeat (e.g., another copy of the same TE). The single-stranded DNA anneals at the complementary sequence of the template. The repeat region used for the homology can be located exactly at the extremity or very close to the extremity (Fig. 5C). As in the single-strand annealing (SSA) model, if the homology region (e.g., the TE copy) does not exactly span the extremity, the nonannealed region is degraded by a DNase (data not shown). Then, heteroduplex formation allows synthesis to continue using as template the contiguous genomic region of the homologous region. According to the bubble migration model (Formosa and Alberts 1986), the heteroduplex (the bubble) is formed by annealing the template complementary sequence with the recipient sequence; during synthesis, this bubble is displaced along the template (Fig. 5D). Note that, if repeats are located at both 3′ free ends, both ends can invade ectopic templates resulting in a bidirectional synthesis.
Figure 5.

DDSA model. Repeat copies are represented by boxes. (A) DSB occurs in a repeat. (B) Exonuclease digestion exposes a repeated sequence at one 3′ free extremity. (C) Homologous base-pairing with another copy of the same repeat induces bubble formation—i.e., protein complex. (D) Bubble migration proceeds along the donor DNA template. (E) Newly synthesized strand is dissociated from the template duplex to return to the broken molecule. The newly synthesized strand can also re-invade the same template. The DNA repair process can finish through single-strand annealing (F) or end-joining (F′) pathways, then initiating the repair of the second strand using the newly synthesized strand as template. (G) According to the single-strand annealing process, the annealing is obtained from a short homology. (G′) In the end-joining pathway, a microhomology could be sufficient. At the end of the duplication process and in both pathways, the repeat and the contiguous region of the repeat are duplicated into the break. Note that this figure illustrates only unidirectional synthesis, whereas in the SDSA model, bidirectional synthesis can occur if both ends present a repeat.
After repair synthesis, the extended strands dissociate from their complementary template sequences within the duplex DNA (Fig. 5E) and reanneal with their original complementary strands using a short homology (Sugawara et al. 1997) (Fig. 5F,G) or terminate the duplication process by end joining through the NHEJ pathway (Paques and Haber 1999) (Fig. 5F′,G′). According to the bubble migration model, the dissociation of the newly synthesized strand can also be followed by a re-invasion on either the same (McVey et al. 2004) or another template sequence. In this situation, because the bubble complex is already formed, a microhomology could be sufficient for the strand re-invasion. At the end of the duplication process, the template sequence and the homologous repeat region are duplicated at the DSB site.
To validate this model, we searched for traces left by the duplication process according to this model.
Signatures of the homologous repair process
According to the bubble migration model, multiple cycles of strand invasion of the nascent strand can also occur during the repair (McVey et al. 2004). Because of the instability of this heteroduplex, the new strand can dissociate from the template several times before returning to the broken molecule. If it re-invades the same or another template, the synthesis continues. If the re-invasion takes place within the same template, re-invasion traces are expected to be observed. Such traces would correspond to insertions or deletions. In a pairwise alignment of the two copies, these indels are identified as gaps associated with microhomology or tandem repeats.
When re-invasion occurs upstream from the dissociation site, the same genomic region is used as template twice. Consequently, two tandem repeats can be created during the duplication process in the neosynthesized sequence, whereas the template remains intact. Therefore, the pairwise alignment of the template with the neosynthesized sequence would exhibit a gap corresponding to the absence of this sequence in the template. We thus expected to find two repeats strictly in tandem within the neosynthesized sequence, one being aligned with the gap on the other sequence (Fig. 6).
Figure 6.

Re-invasion processes and signatures generated after strand dissociation. Template sequence is represented in bold. After the dissociation of the strand, the newly synthesized strand can return to the broken molecule (A), re-invade another genomic region (B), or re-invade the same template (C). In this latter case, traces are expected to be observed on the pairwise alignment of the template with the duplication sequence. For strand re-invasion, a microhomology is required (see text). (C.1) In the upstream re-invasion case, the same genomic region is used as template twice (a), generating a tandem repeat within the newly synthesized strand, although the template remains intact. The pairwise alignment would thus exhibit a gap on the template sequence associated with two tandem repeats of the duplication with only one repeat conserved (b, c). Microhomology traces could not be distinguished from the two tandem repeats because they overlap with the tandem repeats. (C.2) In the downstream re-invasion, the template jump would be visible through a gap on the duplication corresponding to the template region not synthesized (a). This gap would be associated with the traces of the re-invasion. They correspond to two small repeats—i.e., microhomology traces: one on one side of the gap and the other within the gap on the opposite side (b,c). In examples of traces, illustrated in c, tandem repeats and microhomology traces are underlined.
In contrast, in the downstream re-invasion case, we expected to observe the gap on the newly synthesized strand, associated with microhomology traces, i.e., few identical bases, within the template. Note that after the dissociation, because the protein complex of synthesis is already formed, a very short homology can be sufficient for the re-invasion of the template by the end of the newly synthesized strand (Fig. 6).
In upstream re-invasion situation, microhomologies are also necessary for the re-invasion. But here, it is not possible to distinguish between the microhomology traces used for the re-invasion and the tandem repeats, because the two types of repeats are overlapping. The gap resulting from a template jump corresponds to the missing template region into the newly synthesized strand: On the template sequence, two microhomology traces are expected to flank a unique sequence; on the duplication sequence, the gap replaces one microhomology trace and the unique sequence (Fig. 6).
To search for these traces, we needed to differentiate the donor (template) from the recipient sequence (newly synthesized sequence). To do so, we used a comparative genomic approach to identify the template sequence among the two sequences of one duplication event. We chose the Drosophila yakuba genome as the comparison because it was the closest relative (∼10 My) for which the sequencing was of high quality (at the time of the study). We worked with the subset of 86 SDs possessing two copies each. Within this set of 172 sequences, we expected to identify sequences shared by both genomes at orthologous regions. When only one sequence was present in D. yakuba, we considered the common sequence as “the template” and the other (located only in D. melanogaster) “the duplicated sequence.” One can imagine that duplications could have occurred in their common ancestor and then followed by complete deletions of one of the two sequences in the D. yakuba genome. But, because these duplications are young (high sequence identity; Supplemental Fig S1), thus occurring probably after the D. yakuba–D. melanogaster speciation, this is less probable. Note also that the D. yakuba genome can present assembly artifacts due to repeated sequences. For example, two tandem duplication copies may represent a real duplication or a single misassembled sequence. Hence, for our study, we eliminated these doubtful cases (see Methods). For 12 duplication events, we securely identified the template sequence and the sequence resulting from the duplication event. To identify the marks left by the duplication process, we analyzed the 12 pairwise alignments (Supplemental Fig. S3; see Methods).
We observed twofold fewer gaps on sequences identified as template in comparison to those on the newly synthesized copies (Table 4). Eight of the 17 gaps located on template sequences present a tandem repeat in front of them on the neosynthesized sequences.
Table 4.
Re-invasion traces, according to the DDSA model

Using the 12 selected duplication pairwise alignments, we identified and counted the gaps associated with tandem repeats or microhomology traces for both template and duplicated sequences. (For an illustration of each type of trace, see Fig. 6).
aUpstream re-invasion traces.
bDownstream re-invasion traces.
Conversely, only four tandem repeats could be observed associated with the 36 gaps located on the neosynthesized sequences (χ2 test: χ2 = 14.0046, df = 1, P = 1.824 × 10⁻⁴). We also detected significantly more microhomology traces on the newly synthesized sequences than on the template sequence (χ2 test: χ2 = 4.29, df = 1, P = 3.834 × 10⁻³; Table 4).
Selective pressure may bias our observations in exons, if the duplication comprises a gene. In this case the new copy could evolve more rapidly due to a relaxed selective pressure. By removing traces in exons, we could avoid this potential bias. We still detected more traces with the predicted pattern: seven versus two gaps associated with tandem repeats and six versus one gaps associated with microhomology (Table 4).
Phylogenic trees generated with the three copies, the two copies of D. melanogaster and the single copy of D. yakuba (Supplemental Fig. S3), show a majority of similar evolution speeds for the two copies of D. melanogaster. These observations represent strong evidence that the detected biases have been generated by the duplication process and not by insertion or deletion events that have taken place after the duplication event on sequences with a relaxed selective pressure. All DDSA signatures argue in favor of the DDSA model as one duplication formation model. Moreover, the greater number of gaps observed on the duplicated sequence (36 gaps as opposed to 17 gaps on the template) suggests that, after a dissociation, re-annealing occurs more often downstream than upstream.
Discussion
Quality of SD detection
The power of SD analysis depends greatly on the detection strategy used and on the quality of the genomic sequence and its annotations. In our study, we used a very high quality sequence: the D. melanogaster Release 4 genomic sequence. With each release, the sequence improves in quality, with correction of errors (of both sequence and assembly), the closure of physical and sequence gaps (only 23 now remain in Release 4), and tests of the correct assembly of repetitive sequences (http://flybase.net/). This high sequence quality means that we can be fairly sure of the sequences involved in the detected SDs. The probability of two regions to share an identity of >99% due to an assembly artifact is here very low in opposition to a draft sequence. The main assembly error risk is that sequences with an extremely high identity may have been collapsed during the assembly process. Because the quality of the assembly is high due to the numerous checks that have be performed on its repetitive sequences, we assume this risk to be very low for D. melanogaster sequence. Moreover, the quantity and quality of annotations of the D. melanogaster genome are essential information to understanding the mechanism of SD formation.
However, the numbers of SDs that we detected is underestimated because of our BLASTER parameter settings. We detected mainly well-conserved duplications. It is also important to note that some cases remain problematic, for example, repeats generated by macrotransposition, which is the transposition of a large chromosomal segment located between two Class II TE copies of a same family. This mechanism is driven by one of the two inverted terminal repeat ends of each TE copy (Gray 2000). In this case, it is more difficult to identify which mechanism is responsible for this duplication: macrotransposition or homologous repair. However, these cases are rare.
Homology search around to the DNA break point
A recent study (Rong and Golic 2003) has shown that, in mitotic cells, the template used is preferentially located on the sister chromatid and yields to an accurate repair. Here, we show that, during the repair, the template could be chosen in the same chromosomal region (intrachromosomal event) or even in another chromosome (interchromosomal event). The number of intrachromosomal duplications we observed is more than twice that of interchromosomal duplications. These results show a preferential choice for a template in cis of the DSB site, suggesting that the repair complex is probably compelled to search for a close homologous region. This is also illustrated by the short distance between copies located on the same chromosomal arm (the median distance is 14 kb, and the third quartile is 50.3 kb).
Interchromosomal duplications can be explained by the chromosomal organization in the nucleus. In the 3D nuclear space, break ends can be physically closer to a template located on another chromosome than to the sister chromatid or the homologous chromosome. According to the DDSA model, during the homologous search step, a TE copy can be selected as template from a set of potential candidates, a copy located on another chromosome. Note that the mechanism seems to need a long homology between the repeat copies to start the repair (Paques and Haber 1999). Therefore, TEs can explain the presence of dispersed long homologous regions and might thus be responsible for the intrachromosomal and interchromosomal duplication processes.
As shown in mammal genomes (Bailey et al. 2001), Drosophila SDs show a particular bias for heterochromatic regions where TEs are dense. DNA breaks are known to occur more often in heterochromatic regions. Consequently, one explanation could be that because of TE density, many TE copies that are closely located to the breaks could be preferentially chosen during the homology search. In addition, these regions are supposed to be selectively less constrained because of low gene density and thus tolerate more duplications. Heterochromatin thus appears to be favorable for duplication processes.
Impact of TEs
Because of their transposition activity, some TEs can induce DNA breaks. Indeed, the transposition process for class II TEs starts with a TE excision generating a DSB (Finnegan 1989; Lim and Simmons 1994). As homologous recombination can occur between two copies, TEs are also known to be associated with chromosomal rearrangements by homologous recombination or by transposition (Finnegan 1989; Lim and Simmons 1994). The result of chromosomal rearrangements between repeated sequences depends on the location and the orientation of these sequences (Gray 2000).
According to the DDSA model and the SD end analysis, TEs can be used for the break repair in at least 13.96% (percentage of SDs with one TE copy at one of their ends) of the observed SDs. In contrast, the random sequences set has only 9.47% of the sequences that present a TE at one end (Table 1) while being located in the same TE-rich region. Among the SDs that do not present repeats at their ends, some may have lost the repeat over time. Indeed, repeated sequences are highly subject to deletion in D. melanogaster genome. DNA loss estimates in TEs (Blumenstiel et al. 2002) show a ratio of deletions to insertions of 3.6. DNA is lost at a rate of 5.6 bp per nucleotide substitutions when accounting for the balance between insertion and deletion. This indicates that more sequences are removed than added in repeats of the D. melanogaster genome. However, when counting only what is removed, the rate becomes 6.9 bp per nucleotide substitution. Consequently, under exponential-induced decay, the length of a copy is expected to reduce exponentially according to the formula L0 exp(−dt), where d is the rate of DNA loss per substitution per bp and t is the time measured in point substitution per bp (Sharp and Li 1989). Given that the substitution rate is estimated at 15 per My, the size of a sequence is expected to decrease by 50% in 6 My. With such a deletion rate, old repeated sequences could be too deleted to be detected.
In addition, if the repeat located at a SD end is only present in two copies in the genome, the duplication process encompasses them in the SD sequence and cannot therefore be recognized as a short repeat at a SD end. Taken together, these results suggest that TEs have an important impact on SD formation in the D. melanogaster genome.
Signatures of the DDSA model
We analyzed in detail the sequences generated by recent duplication events. We revealed specific traces that support a particular HR model: the DDSA model. The probability of observing by chance tandem repeats of 10 bp associated with a gap located on template is very low. The same reasoning holds true for microhomology regions located at the gap ends. In addition, our alignment analysis showed that after the dissociation of the strand during the synthesis, downstream re-annealing on the same strand occurs more often than upstream. The signature bias between the template and the neosynthesized strand is a strong result to argue in favor of our model. Moreover, our model predicts that the gap size corresponds to the distance between the dissociation site and the re-annealing location. The mean gap size on the neosynthesized strand is ∼16 bp (median of 12 bp). We believe that this short distance between dissociation and the re-invasion site is due to a sequestration of the strand after dissociation in the bubble complex. In fact, the large synthesis complex can capture the strand, which can then re-invade the same template close to the dissociation site most likely due to some physical constraints. We propose that it is easier for the ssDNA to invade a region close downstream from the dissociation site when captured by the protein complex, because of the oriented movement of the bubble complex along the DNA template sequence during the repair: the bubble migration. All together, these observations support our DDSA model and rule out the hypothesis that the detected traces arose after the duplication event by other processes.
Tandem duplications
In several Drosophila species, satellite sequences have been identified and most of them mapped in heterochromatin (Gall et al. 1971; Lohe et al. 1993). In our study, tandem duplication features differ from those of dispersed duplications: they are smaller in size and have lower sequence identities. Among these tandem repeats, we observed gene families that presumably evolved from gene duplication.
Interestingly, the X chromosome shows an atypical SD distribution because of a very high SD density into a euchromatic region (Fig. 3). This island of SDs located in the middle of the X chromosomal arm corresponds mainly to clusters of tandem duplications and satellites. Among them, the Stellate gene cluster corresponds to the highest copy number duplication on this X chromosome island. Heterochromatic variants of the Stellate genes have been detected in the distal region of X-linked heterochromatin (cytological location h26). Heterochromatic Stellate genes are known to be embedded in amplified, scrambled structures containing middle repetitive DNA (Shevelyov 1992; Nurminsky et al. 1994; Tulin et al. 1997). It has been proposed that the tandem cluster formation occurred in the heterochromatin before its transition to the euchromatin by rearrangements (Abramov et al. 2005). To explain the Stellate gene duplications, several scenarios can be imagined: (1) The cluster is generated by expansion processes such as replication slippage or unequal crossing-over. (2) Cycles of upstream re-invasions during the homologous break repair generate the expansion of tandem repeats (Richard and Paques 2000). The tandem repeat formation step would then be followed by a duplication of the tandem array, thus relocating the cluster to a euchromatic region into the middle of the X arm. The high SD density observed in this region can be also explained by Kaufmann’s studies (Kaufmann 1939) on break frequencies along the X chromosome. A high break frequency is observed in this region, as in heterochromatin. In these regions, the repair machinery can be easily saturated and lead to repair errors.
Genome features that influence SD features
To deal with DNA DSB, cells have complex machineries that can repair breaks using several possible pathways. These machineries consist of >20 proteins including DNA endonucleases and exonucleases, ATPase engines, DNA helicases, signaling kinases, DNA polymerases, ligases, and tumor suppressor surveillance genes. Repair complexes have the ability to detect DNA breaks, search for homologous template DNA, and repair or join the broken ends. Depending on the availability of the proteins involved in the homologous search, the repair process engages itself in a DSB repair pathway. Differences between genomes in complex stability or affinity might explain some of the observed differences in SD coverage. In large genomes, DNA breaks occur more frequently than in small genomes because the sequence is longer. Therefore, in these large genomes, the proteins involved in a search for faithful homology would not be numerous enough to repair all breaks at the same time, leading to errors in repair that produce SDs. Comparisons between sequenced organisms genomes show that large genomes have greater SD genome coverage. For example, in mammals where comparisons can be made because strategies for SD detection are comparable and because the SD pathway formations are supposed to be the same, there are ∼1.2% of recent SDs for the 2.5 Gb of the mouse genome (Waterston et al. 2002), 2.92% for the 2.75 Gb of the Brown Norway rat genome (Rattus norvegicus, v. 3.1) (Rew 2004), and 5% for the 3 Gb of the human genome (Bailey et al. 2001, 2002; Lander et al. 2001; Venter et al. 2001). According to HR models, genomic features such as size and density in repeated sequences might determine the occurrence of SD formation.
Therefore, the DDSA model, a DSB repair model, is the first detailed SD-formation model proposed. According to the bubble migration model, a precocious dissociation of the strand is possible, leading to a small duplication. As the DDSA seems to explain TE-based duplication formation in this genome, we expected to observe a high duplication density in TE-rich region where duplications seem also to be more tolerated. Any homologous repair model involving repeats such as TEs can explain the duplication distribution. But the small duplication size cannot be explain by DSBR, which predicts a stable heteroduplex and thus allows the repair complex to proceed over long distances.
Methods
SD detection pipeline
Detection of D. melanogaster repeats
Repeated sequences of the D. melanogaster genome sequence (Release 4, downloaded as chromosome arms from the Flybase Web site at http://www.fruitfly.org/) are detected with the BLASTER program (Quesneville et al. 2003, 2005). This program allows one to compare two sets of sequences: a query data bank and a subject data bank. BLASTER launches one of the BLAST programs (BLASTN, TBLASTN, BLASTX, TBLASTX, BLASTP, MEGABLAST) (Altschul et al. 1990, 1997) to search the subject data bank with the query data bank. It cuts long sequences before launching BLAST and reassembles the results afterward. Therefore, it is not limited by the length of sequences and can be used to compare a genome with itself to detect repeated sequences in this genome. It uses the NCBI-BLASTN repeatedly in an all-by-all genome comparison with default parameters (BLAST Release 2.2.14; Altschul et al. 1990, 1997) except for the E value threshold of 1 × 10−300. This E value allows detection of the repeated sequences of a genome that are well conserved.
Elimination of known repeats
To specifically detect repeats generated by a duplication process, we filtered out repetitive DNA generated by other processes. To do so, we eliminated TE and microsatellite sequences among the set of repeated sequences of D. melanogaster detected with BLASTER.
To perform this step, we implemented a new program called “elimin_known_repeats.” This program analyzes BLASTER results and eliminates all BLAST matches (i.e., all pairs of repeats of the genome) included in the region of a known repeat (i.e., TE or microsatellite). It requires repeat annotations as input: TE annotations were obtained from our previous work (Quesneville et al. 2003, 2005), which is available at the Flybase or RepEt Web sites (http://dynagen.ijm.jussieu.fr/). Microsatellite annotations were obtained by using the Tandem Repeat Finder (TRF) program (Benson 1999). To be more stringent, we also used annotations of new potential TEs detected by BLASTER with TBLASTX and a compilation of known eukaryotic TEs (Repbase Update; Jurka 2000). All annotations and program results were managed through a MySQL database to optimize storage and retrieval. A match (i.e., a pair of repeats: the query and the subject sequences) is eliminated when at least one of the sequences is totally overlapping with a repeat annotation.
During the annotation process, it may in some cases be difficult to precisely identify the ends of the annotated sequence. Therefore, the user can choose to extend the annotation, thus reducing the risk of missing a TE or satellite. This reduces the false-positive risk at the cost of the elimination of some true positives. We decided empirically that an extension of 5 bp is a good trade-off.
After this step of elimination of TEs and satellites, we used the MATCHER program (Quesneville et al. 2003, 2005). This step allows one to identify large repeats, even if large insertion or deletion (indel) events have occurred, connecting the contiguous detected repeats, thus recovering the whole sequence as one hit, i.e., one repeat. The connection of contiguous duplication fragments allows detection of large repeated sequences.
Among the set of large duplications, potential false positives corresponding to TEs included in microsatellite-rich regions or with a long poly(A) tail can persist despite the step eliminating known repeats. Indeed, some TEs are preferentially inserted into satellite-rich regions, and the size of the poly(A) tail of certain TEs is highly variable. Thus, flanked regions not taken into account for the TE annotations can belong to the transposition process. As it is not possible to determine the mechanism—i.e., transposition or SD process—whereby these repeats were generated, we decided to eliminate them to avoid a bias in our results.
Following this joining step, a repeat elimination step starts on the large repeat segments using the elimin_tes_matcher program and the repeat annotations stored in the MySQL database. This program eliminates the cases for which a repeat with >99% of TE coverage corresponds to only one TE copy. If the repeat coverage is >95% with one TE copy and is flanked by microsatellites, or unique sequences of <20 bp, it is removed.
Clustering of all the copies of a repeat
Finally, to cluster the copies of each duplicated segment, we used the GROUPER program (Quesneville et al. 2003, 2005). This program uses the BLASTER results as input—i.e., here, the duplications detected that do not correspond to a TE or a satellite—to gather similar sequences into groups by single link clustering, allowing identification of every copy of a repeat.
A match is considered to belong to a group if one of the two matching sequence coordinates overlaps the coordinate of one sequence of this group by more than a given length coverage percentage (a program parameter). If the matches overlap with this constraint, its coordinates are merged with those of the sequence of the group, taking the extremum of both. Groups that share sequence locations and were not previously grouped due to a too low length coverage percentage are regrouped into what we call a “cluster.” As a result of these procedures, each group contains sequences that are homogeneous in length. A given region may belong to several groups, but all of these groups belong to the same cluster. Here, the coverage percentage threshold was set to 0, and consequently groups and clusters were equivalent. Thus, the sequences of a group correspond to the copies of a SD.
Note that, due to our detection method, tandem repeats can be identified as groups containing only one sequence. When repeat units are either closely located or overlap, and share a high sequence identity, MATCHER merges and connects them into one sequence, and GROUPER clusters this sequence into one group. It is important to note that, like MATCHER, the GROUPER program uses a dynamics programming algorithm to join the matches. This allows even duplications harboring large indels that occurred after the duplication event to be taken into account.
SD analysis
Creation of the set of control sequences
The created_test_set Python program generates a set of random genomic segments of the same SD sizes in the neighborhood of the SDs. The algorithm is as follows: (1) from the set of coordinates, it randomly selects one SD coordinate pair and defines a window including the SD with an extension of 50 kb on both sides; (2) then it randomly draws a coordinate pair in the defined window keeping the size of the original SD.
Sequence composition of the SDs
The find_annot program, a Python program that we implemented for this analysis, allows the detection of annotations stored in the MySQL database that overlap the SDs and calculate the percentage of coverage for several type of sequence from this annotation. In this study, we analyzed TEs, microsatellites, and gene compositions.
Detection of repeats at SD breakpoint
The find_annot program also uses the MySQL database to search for the SD sequence extremities located within a repeat annotation. For each SD, it tests whether its ends overlap with repeat annotations. SD sequences are thus split into three categories: no detectable repeat at either end, one repeat detected at one end, and one repeat detected at each end.
SD breakpoint location compared to TE location
To identify more precisely the location of SD breakpoints, we performed multiple alignment of SD copies flanked by TE copies, with the ClustalW (Thompson et al. 1994) program.
Using sequences belonging to groups with two copies and flanked by a TE copy, we generated profiles of the extended SD copy (extension of 500 bp) with the TE copy sequence annotated as overlapping the extremity of the SD. This allows each TE copy to be relocated onto each SD copy. Then, we aligned the two profiles generated together to identify precisely the SD breakpoint. A change in the alignment quality is expected at SD breakpoint: a well-conserved region on the duplicated side and a more divergent region before the breakpoint in TE sequences.
Analysis of syntenic regions
Creation of the syntenic blocks
BLASTER (see above) was used to compare the genome of D. melanogaster with that of D. yakuba. The genomic sequence of D. yakuba that was used corresponded to the first release assembly of the whole genome shotgun project (available at Flybase). Results were then mapped onto query sequences by MATCHER (see above; Quesneville et al. 2003, 2005) to find the syntenic regions.
Identification of the template sequence
To automatically determine from a pair of syntenic regions which sequence is the template, we implemented the detect_template program. This program searches all cases where only one of the SD sequences is present on the second genome (here, D. yakuba). Then, it filters out any ambiguous cases where both SD sequences are located close to each other with no conserved region in between that could correspond to a collapse of the two SDs in the D. yakuba genome during the assembly.
Divergence between the two D. melanogaster copies and the single D. yakuba copy
Divergence between sequences was estimated by building phylogenic trees with the three copies (one from D. yakuba and two from D. melanogaster). These sequences were first aligned using ClustalW (Release 1.83; Thompson et al. 1994). These alignments were then used as input in the PhyML program (Guindon and Gascuel 2003), allowing phylogenies to be built from DNA sequences using maximum likelihood. A BIONJ distance-based tree is used as starting tree (Gascuel 1997). We choose to optimize topology, branch lengths, and rate parameters. The transition/transversion ratio default value was 4.0. The gamma distribution parameter is estimated by maximizing the likelihood of the phylogeny. Data sets were analyzed under the HKY85 evolution model (Hasegawa et al. 1985)
Detection of DDSA traces
The BLAST algorithm (that was used to detect SDs) is known to be not very sensitive near the alignment boundaries, inducing the risk of missing the whole SD sequence. We have written the Align2Seq program to extract the sequences and perform pairwise alignments between two sequences and to return all the “gaps” in these alignments. To recover all the sequence that has undertaken the repair process, we have extended each sequence at both ends by 500 bp. This extension allows us to recover with more security the SD breakpoints relying on sensitive local pairwise alignments of these extended sequence pairs. The Align2Seq program performs a local alignment where long gaps are not penalized. The Parameters we used were a match reward of 10, a mismatch penalty of 12, a gap open penalty of 16, a gap extend penalty of 4, a maximum length of penalized gap of 100 bp, a minimum gap size of 5 bp, and a maximum gap size of 100 bp.
We chose to analyze all gaps with lengths ranging from 5 to 100 bp on these alignments, because very small gaps (<5 bp) can be explained by polymerase errors and large gaps (>100 bp) by other indel mechanisms. To specifically detect repeats (≥3 bp) and take into account potential short insertions, deletions, and mismatches, we analyzed the TRF results in the vicinity (20 bp apart on the both sides) of all previously selected gaps (minimum sequence identity of 75%).
To be counted, a tandem repeat associated with gaps on the template sequence (upstream re-invasion trace; Fig. 6C.1) must have a gap coverage >60% and a size >5 bp. We did not take into account all tandem repeats with more than two copies because any mechanisms of tandem repeat expansion could have generated them. For microhomology associated with gaps on the newly synthesized sequence (downstream re-invasion trace; Fig. 6C.2), a minimum size of 3 bp was chosen to disregard microhomology traces that occurred by chance. In addition, we only counted those when the internal microhomology covered the gap by <40%, the remaining sequence being unique. All considered data can be seen in Supplemental Figure S3.
Acknowledgments
We thank Vincent Colot and Casey M Bergman for their comments on this manuscript, and Clementine Vitte and Antonia Kropfinger for her help in improving the English of this manuscript. We thank the anonymous reviewers for their helpful comments, which improved the manuscript. This work was supported by the Centre National de la Recherche Scientifique (CNRS), the P. and M. Curie and D. Diderot Universities (Institut Jacques Monod, UMR 7592), and the GDR “Elements Transposables.”
Footnotes
[Supplemental material is available online at www.genome.org.]
Article published online before print. Article and publication date are at http://www.genome.org/cgi/doi/10.1101/gr.6208307
References
- Abramov Y.A., Kogan G.L., Tolchkov E.V., Rasheva V.I., Lavrov S.A., Bonaccorsi S., Kramerova I.A., Gvozdev V.A., Kogan G.L., Tolchkov E.V., Rasheva V.I., Lavrov S.A., Bonaccorsi S., Kramerova I.A., Gvozdev V.A., Tolchkov E.V., Rasheva V.I., Lavrov S.A., Bonaccorsi S., Kramerova I.A., Gvozdev V.A., Rasheva V.I., Lavrov S.A., Bonaccorsi S., Kramerova I.A., Gvozdev V.A., Lavrov S.A., Bonaccorsi S., Kramerova I.A., Gvozdev V.A., Bonaccorsi S., Kramerova I.A., Gvozdev V.A., Kramerova I.A., Gvozdev V.A., Gvozdev V.A. Eu-heterochromatic rearrangements induce replication of heterochromatic sequences normally underreplicated in polytene chromosomes of Drosophila melanogaster. Genetics. 2005;171:1673–1681. doi: 10.1534/genetics.105.044461. [DOI] [PMC free article] [PubMed] [Google Scholar]
- Altschul S.F., Gish W., Miller W., Myers E.W., Lipman D.J., Gish W., Miller W., Myers E.W., Lipman D.J., Miller W., Myers E.W., Lipman D.J., Myers E.W., Lipman D.J., Lipman D.J. Basic local alignment search tool. J. Mol. Biol. 1990;215:403–410. doi: 10.1016/S0022-2836(05)80360-2. [DOI] [PubMed] [Google Scholar]
- Altschul S.F., Madden T.L., Schaffer A.A., Zhang J., Zhang Z., Miller W., Lipman D.J., Madden T.L., Schaffer A.A., Zhang J., Zhang Z., Miller W., Lipman D.J., Schaffer A.A., Zhang J., Zhang Z., Miller W., Lipman D.J., Zhang J., Zhang Z., Miller W., Lipman D.J., Zhang Z., Miller W., Lipman D.J., Miller W., Lipman D.J., Lipman D.J. Gapped BLAST and PSI-BLAST: a new generation of protein database search programs. Nucleic Acids Res. 1997;25:3389–3402. doi: 10.1093/nar/25.17.3389. [DOI] [PMC free article] [PubMed] [Google Scholar]
- Ashburner M. Drosophila. A laboratory manual. Cold Spring Harbor Laboratory Press; Cold Spring Harbor, NY: 1989. [Google Scholar]
- Bailey J.A., Yavor A.M., Massa H.F., Trask B.J., Eichler E.E., Yavor A.M., Massa H.F., Trask B.J., Eichler E.E., Massa H.F., Trask B.J., Eichler E.E., Trask B.J., Eichler E.E., Eichler E.E. Segmental duplications: organization and impact within the current human genome project assembly. Genome Res. 2001;11:1005–1017. doi: 10.1101/gr.187101. [DOI] [PMC free article] [PubMed] [Google Scholar]
- Bailey J.A., Gu Z., Clark R.A., Reinert K., Samonte R.V., Schwartz S., Adams M.D., Myers E.W., Li P.W., Eichler E.E., Gu Z., Clark R.A., Reinert K., Samonte R.V., Schwartz S., Adams M.D., Myers E.W., Li P.W., Eichler E.E., Clark R.A., Reinert K., Samonte R.V., Schwartz S., Adams M.D., Myers E.W., Li P.W., Eichler E.E., Reinert K., Samonte R.V., Schwartz S., Adams M.D., Myers E.W., Li P.W., Eichler E.E., Samonte R.V., Schwartz S., Adams M.D., Myers E.W., Li P.W., Eichler E.E., Schwartz S., Adams M.D., Myers E.W., Li P.W., Eichler E.E., Adams M.D., Myers E.W., Li P.W., Eichler E.E., Myers E.W., Li P.W., Eichler E.E., Li P.W., Eichler E.E., Eichler E.E. Recent segmental duplications in the human genome. Science. 2002;297:1003–1007. doi: 10.1126/science.1072047. [DOI] [PubMed] [Google Scholar]
- Bailey J.A., Liu G., Eichler E.E., Liu G., Eichler E.E., Eichler E.E. An Alu transposition model for the origin and expansion of human segmental duplications. Am. J. Hum. Genet. 2003;73:823–834. doi: 10.1086/378594. [DOI] [PMC free article] [PubMed] [Google Scholar]
- Benson G. Tandem repeats finder: A program to analyze DNA sequences. Nucleic Acids Res. 1999;27:573–580. doi: 10.1093/nar/27.2.573. [DOI] [PMC free article] [PubMed] [Google Scholar]
- Bergman C.M., Quesneville H., Anxolabéhère D., Ashburner M., Quesneville H., Anxolabéhère D., Ashburner M., Anxolabéhère D., Ashburner M., Ashburner M. Recurrent insertion and duplication generate networks of transposable element sequences in Drosophila melanogaster genome. Genome Biol. 2006;7:R112. doi: 10.1186/gb-2006-7-11-r112. [DOI] [PMC free article] [PubMed] [Google Scholar]
- Blumenstiel J.P., Hartl D.L., Lozovsky E.R., Hartl D.L., Lozovsky E.R., Lozovsky E.R. Patterns of insertion and deletion in contrasting chromatin domains. Mol. Biol. Evol. 2002;19:2211–2225. doi: 10.1093/oxfordjournals.molbev.a004045. [DOI] [PubMed] [Google Scholar]
- Cheung J., Wilson M.D., Zhang J., Khaja R., MacDonald J.R., Heng H.H., Koop B.F., Scherer S.W., Wilson M.D., Zhang J., Khaja R., MacDonald J.R., Heng H.H., Koop B.F., Scherer S.W., Zhang J., Khaja R., MacDonald J.R., Heng H.H., Koop B.F., Scherer S.W., Khaja R., MacDonald J.R., Heng H.H., Koop B.F., Scherer S.W., MacDonald J.R., Heng H.H., Koop B.F., Scherer S.W., Heng H.H., Koop B.F., Scherer S.W., Koop B.F., Scherer S.W., Scherer S.W. Recent segmental and gene duplications in the mouse genome. Genome Biol. 2003;4:R47. doi: 10.1186/gb-2003-4-8-r47. [DOI] [PMC free article] [PubMed] [Google Scholar]
- Eichler E.E. Segmental duplications: What’s missing, misassigned, and misassembled—and should we care? Genome Res. 2001;11:653–656. doi: 10.1101/gr.188901. [DOI] [PubMed] [Google Scholar]
- Engels W.R., Johnson-Schlitz D.M., Eggleston W.B., Sved J., Johnson-Schlitz D.M., Eggleston W.B., Sved J., Eggleston W.B., Sved J., Sved J. High-frequency P element loss in Drosophila is homolog dependent. Cell. 1990;62:515–525. doi: 10.1016/0092-8674(90)90016-8. [DOI] [PubMed] [Google Scholar]
- Finnegan D.J. Eukaryotic transposable elements and genome evolution. Trends Genet. 1989;5:103–107. doi: 10.1016/0168-9525(89)90039-5. [DOI] [PubMed] [Google Scholar]
- Formosa T., Alberts B.M., Alberts B.M. Purification and characterization of the T4 bacteriophage uvsX protein. J. Biol. Chem. 1986;261:6107–6118. [PubMed] [Google Scholar]
- Gall J.G., Cohen E.H., Polan M.L., Cohen E.H., Polan M.L., Polan M.L. Repetitive DNA sequences in Drosophila. Chromosoma. 1971;33:319–344. doi: 10.1007/BF00284948. [DOI] [PubMed] [Google Scholar]
- Gascuel O. BIONJ: An improved version of the NJ algorithm based on a simple model of sequence data. Mol. Biol. Evol. 1997;14:685–695. doi: 10.1093/oxfordjournals.molbev.a025808. [DOI] [PubMed] [Google Scholar]
- Gray Y.H. It takes two transposons to tango: Transposable-element–mediated chromosomal rearrangements. Trends Genet. 2000;16:461–468. doi: 10.1016/s0168-9525(00)02104-1. [DOI] [PubMed] [Google Scholar]
- Guindon S., Gascuel O., Gascuel O. A simple, fast, and accurate algorithm to estimate large phylogenies by maximum likelihood. Syst. Biol. 2003;52:696–704. doi: 10.1080/10635150390235520. [DOI] [PubMed] [Google Scholar]
- Hasegawa M., Kishino H., Yano T., Kishino H., Yano T., Yano T. Dating of the human–ape splitting by a molecular clock of mitochondrial DNA. J. Mol. Evol. 1985;22:160–174. doi: 10.1007/BF02101694. [DOI] [PubMed] [Google Scholar]
- Holland P.W., Garcia-Fernandez J., Williams N.A., Sidow A., Garcia-Fernandez J., Williams N.A., Sidow A., Williams N.A., Sidow A., Sidow A. Gene duplications and the origins of vertebrate development. Development. 1994;(Suppl.):125–133. [PubMed] [Google Scholar]
- Hoskins R.A., Smith C.D., Carlson J.W., Carvalho A.B., Halpern A., Kaminker J.S., Kennedy C., Mungall C.J., Sullivan B.A., Sutton G.G., Smith C.D., Carlson J.W., Carvalho A.B., Halpern A., Kaminker J.S., Kennedy C., Mungall C.J., Sullivan B.A., Sutton G.G., Carlson J.W., Carvalho A.B., Halpern A., Kaminker J.S., Kennedy C., Mungall C.J., Sullivan B.A., Sutton G.G., Carvalho A.B., Halpern A., Kaminker J.S., Kennedy C., Mungall C.J., Sullivan B.A., Sutton G.G., Halpern A., Kaminker J.S., Kennedy C., Mungall C.J., Sullivan B.A., Sutton G.G., Kaminker J.S., Kennedy C., Mungall C.J., Sullivan B.A., Sutton G.G., Kennedy C., Mungall C.J., Sullivan B.A., Sutton G.G., Mungall C.J., Sullivan B.A., Sutton G.G., Sullivan B.A., Sutton G.G., Sutton G.G., et al. Heterochromatic sequences in a Drosophila whole-genome shotgun assembly. Genome Biol. 2002;3 doi: 10.1186/gb-2002-3-12-research0085. RESEARCH0085. [DOI] [PMC free article] [PubMed] [Google Scholar]
- Jurka J. Repbase update: A database and an electronic journal of repetitive elements. Trends Genet. 2000;16:418–420. doi: 10.1016/s0168-9525(00)02093-x. [DOI] [PubMed] [Google Scholar]
- Kaufmann B.P. Distribution of induced breaks along the X-chromosome of Drosophila melanogaster. Proc. Natl. Acad. Sci. 1939;25:571–577. doi: 10.1073/pnas.25.11.571. [DOI] [PMC free article] [PubMed] [Google Scholar]
- Koszul R., Caburet S., Dujon B., Fischer G., Caburet S., Dujon B., Fischer G., Dujon B., Fischer G., Fischer G. Eucaryotic genome evolution through the spontaneous duplication of large chromosomal segments. EMBO J. 2004;23:234–243. doi: 10.1038/sj.emboj.7600024. [DOI] [PMC free article] [PubMed] [Google Scholar]
- Lander E.S., Linton L.M., Birren B., Nusbaum C., Zody M.C., Baldwin J., Devon K., Dewar K., Doyle M., FitzHugh W., Linton L.M., Birren B., Nusbaum C., Zody M.C., Baldwin J., Devon K., Dewar K., Doyle M., FitzHugh W., Birren B., Nusbaum C., Zody M.C., Baldwin J., Devon K., Dewar K., Doyle M., FitzHugh W., Nusbaum C., Zody M.C., Baldwin J., Devon K., Dewar K., Doyle M., FitzHugh W., Zody M.C., Baldwin J., Devon K., Dewar K., Doyle M., FitzHugh W., Baldwin J., Devon K., Dewar K., Doyle M., FitzHugh W., Devon K., Dewar K., Doyle M., FitzHugh W., Dewar K., Doyle M., FitzHugh W., Doyle M., FitzHugh W., FitzHugh W., et al. Initial sequencing and analysis of the human genome. Nature. 2001;409:860–921. doi: 10.1038/35057062. [DOI] [PubMed] [Google Scholar]
- Lim J.K., Simmons M.J., Simmons M.J. Gross chromosome rearrangements mediated by transposable elements in Drosophila melanogaster. Bioessays. 1994;16:269–275. doi: 10.1002/bies.950160410. [DOI] [PubMed] [Google Scholar]
- Linardopoulou E.V., Williams E.M., Fan Y., Friedman C., Young J.M., Trask B.J., Williams E.M., Fan Y., Friedman C., Young J.M., Trask B.J., Fan Y., Friedman C., Young J.M., Trask B.J., Friedman C., Young J.M., Trask B.J., Young J.M., Trask B.J., Trask B.J. Human subtelomeres are hot spots of interchromosomal recombination and segmental duplication. Nature. 2005;437:94–100. doi: 10.1038/nature04029. [DOI] [PMC free article] [PubMed] [Google Scholar]
- Lohe A.R., Hilliker A.J., Roberts P.A., Hilliker A.J., Roberts P.A., Roberts P.A. Mapping simple repeated DNA sequences in heterochromatin of Drosophila melanogaster. Genetics. 1993;134:1149–1174. doi: 10.1093/genetics/134.4.1149. [DOI] [PMC free article] [PubMed] [Google Scholar]
- Lupski J.R. Charcot-Marie-Tooth disease: Lessons in genetic mechanisms. Mol. Med. 1998a;4:3–11. [PMC free article] [PubMed] [Google Scholar]
- Lupski J.R. Genomic disorders: Structural features of the genome can lead to DNA rearrangements and human disease traits. Trends Genet. 1998b;14:417–422. doi: 10.1016/s0168-9525(98)01555-8. [DOI] [PubMed] [Google Scholar]
- Lupski J.R. 2002 Curt Stern Award Address. Genomic disorders recombination-based disease resulting from genomic architecture. Am. J. Hum. Genet. 2003;72:246–252. doi: 10.1086/346217. [DOI] [PMC free article] [PubMed] [Google Scholar]
- McVey M., Adams M., Staeva-Vieira E., Sekelsky J.J., Adams M., Staeva-Vieira E., Sekelsky J.J., Staeva-Vieira E., Sekelsky J.J., Sekelsky J.J. Evidence for multiple cycles of strand invasion during repair of double-strand gaps in Drosophila. Genetics. 2004;167:699–705. doi: 10.1534/genetics.103.025411. [DOI] [PMC free article] [PubMed] [Google Scholar]
- Muller H. Bar duplication. Science. 1936;83:528–530. doi: 10.1126/science.83.2161.528-a. [DOI] [PubMed] [Google Scholar]
- Nassif N., Penney J., Pal S., Engels W.R., Gloor G.B., Penney J., Pal S., Engels W.R., Gloor G.B., Pal S., Engels W.R., Gloor G.B., Engels W.R., Gloor G.B., Gloor G.B. Efficient copying of nonhomologous sequences from ectopic sites via P-element-induced gap repair. Mol. Cell. Biol. 1994;14:1613–1625. doi: 10.1128/mcb.14.3.1613. [DOI] [PMC free article] [PubMed] [Google Scholar]
- Nei M., Rooney A.P., Rooney A.P. Concerted and birth-and-death evolution of multigene families. Annu. Rev. Genet. 2005;39:121–152. doi: 10.1146/annurev.genet.39.073003.112240. [DOI] [PMC free article] [PubMed] [Google Scholar]
- Newman T., Trask B.J., Trask B.J. Complex evolution of 7E olfactory receptor genes in segmental duplications. Genome Res. 2003;13:781–793. doi: 10.1101/gr.769003. [DOI] [PMC free article] [PubMed] [Google Scholar]
- Nurminsky D.I., Shevelyov Y., Nuzhdin S.V., Gvozdev V.A., Shevelyov Y., Nuzhdin S.V., Gvozdev V.A., Nuzhdin S.V., Gvozdev V.A., Gvozdev V.A. Structure, molecular evolution and maintenance of copy number of extended repeated structures in the X-heterochromatin of Drosophila melanogaster. Chromosoma. 1994;103:277–285. doi: 10.1007/BF00352252. [DOI] [PubMed] [Google Scholar]
- Ohno S. Evolution by gene duplication. Springer-Verlag; New York: 1970. [Google Scholar]
- Paques F., Haber J.E., Haber J.E. Multiple pathways of recombination induced by double-strand breaks in Saccharomyces cerevisiae. Microbiol. Mol. Biol. Rev. 1999;63:349–404. doi: 10.1128/mmbr.63.2.349-404.1999. [DOI] [PMC free article] [PubMed] [Google Scholar]
- Quesneville H., Nouaud D., Anxolabehere D., Nouaud D., Anxolabehere D., Anxolabehere D. Detection of new transposable element families in Drosophila melanogaster and Anopheles gambiaegenomes. J. Mol. Evol. 2003;57:S50–S59. doi: 10.1007/s00239-003-0007-2. [DOI] [PubMed] [Google Scholar]
- Quesneville H., Bergman C.M., Andrieu O., Autard D., Nouaud D., Ashburner M., Anxolabehere D., Bergman C.M., Andrieu O., Autard D., Nouaud D., Ashburner M., Anxolabehere D., Andrieu O., Autard D., Nouaud D., Ashburner M., Anxolabehere D., Autard D., Nouaud D., Ashburner M., Anxolabehere D., Nouaud D., Ashburner M., Anxolabehere D., Ashburner M., Anxolabehere D., Anxolabehere D. Combined evidence annotation of transposable elements in genome sequences. PLoS Comput. Biol. 2005;1:166–175. doi: 10.1371/journal.pcbi.0010022. [DOI] [PMC free article] [PubMed] [Google Scholar]
- Rew D.A. The sequencing of the rat genome. Eur. J. Surg. Oncol. 2004;30:905–906. doi: 10.1016/j.ejso.2004.05.012. [DOI] [PubMed] [Google Scholar]
- Richard G.F., Paques F., Paques F. Mini- and microsatellite expansions: The recombination connection. EMBO Rep. 2000;1:122–126. doi: 10.1093/embo-reports/kvd031. [DOI] [PMC free article] [PubMed] [Google Scholar]
- Richardson C., Moynahan M.E., Jasin M., Moynahan M.E., Jasin M., Jasin M. Double-strand break repair by interchromosomal recombination: Suppression of chromosomal translocations. Genes & Dev. 1998;12:3831–3842. doi: 10.1101/gad.12.24.3831. [DOI] [PMC free article] [PubMed] [Google Scholar]
- Rong Y.S., Golic K.G., Golic K.G. The homologous chromosome is an effective template for the repair of mitotic DNA double-strand breaks in Drosophila. Genetics. 2003;165:1831–1842. doi: 10.1093/genetics/165.4.1831. [DOI] [PMC free article] [PubMed] [Google Scholar]
- Samonte R.V., Eichler E.E., Eichler E.E. Segmental duplications and the evolution of the primate genome. Nat. Rev. Genet. 2002;3:65–72. doi: 10.1038/nrg705. [DOI] [PubMed] [Google Scholar]
- Sankoff D. Gene and genome duplication. Curr. Opin. Genet. Dev. 2001;11:681–684. doi: 10.1016/s0959-437x(00)00253-7. [DOI] [PubMed] [Google Scholar]
- Sharp P.M., Li W.H., Li W.H. On the rate of DNA sequence evolution in Drosophila. J. Mol. Evol. 1989;28:398–402. doi: 10.1007/BF02603075. [DOI] [PubMed] [Google Scholar]
- Shevelyov Y.Y. Copies of a Stellate gene variant are located in the X heterochromatin of Drosophila melanogaster and are probably expressed. Genetics. 1992;132:1033–1037. doi: 10.1093/genetics/132.4.1033. [DOI] [PMC free article] [PubMed] [Google Scholar]
- Sidow A. Gen(om)e duplications in the evolution of early vertebrates. Curr. Opin. Genet. Dev. 1996;6:715–722. doi: 10.1016/s0959-437x(96)80026-8. [DOI] [PubMed] [Google Scholar]
- Skrabanek L., Wolfe K.H., Wolfe K.H. Eukaryote genome duplication— Where’s the evidence? Curr. Opin. Genet. Dev. 1998;8:694–700. doi: 10.1016/s0959-437x(98)80039-7. [DOI] [PubMed] [Google Scholar]
- Stankiewicz P., Lupski J.R., Lupski J.R. Molecular-evolutionary mechanisms for genomic disorders. Curr. Opin. Genet. Dev. 2002;12:312–319. doi: 10.1016/s0959-437x(02)00304-0. [DOI] [PubMed] [Google Scholar]
- Sugawara N., Paques F., Colaiacovo M., Haber J.E., Paques F., Colaiacovo M., Haber J.E., Colaiacovo M., Haber J.E., Haber J.E. Role of Saccharomyces cerevisiaeMsh2 and Msh3 repair proteins in double-strand break-induced recombination. Proc. Natl. Acad. Sci. 1997;94:9214–9219. doi: 10.1073/pnas.94.17.9214. [DOI] [PMC free article] [PubMed] [Google Scholar]
- Sun F.L., Cuaycong M.H., Craig C.A., Wallrath L.L., Locke J., Elgin S.C., Cuaycong M.H., Craig C.A., Wallrath L.L., Locke J., Elgin S.C., Craig C.A., Wallrath L.L., Locke J., Elgin S.C., Wallrath L.L., Locke J., Elgin S.C., Locke J., Elgin S.C., Elgin S.C. The fourth chromosome of Drosophila melanogaster: Interspersed euchromatic and heterochromatic domains. Proc. Natl. Acad. Sci. 2000;97:5340–5345. doi: 10.1073/pnas.090530797. [DOI] [PMC free article] [PubMed] [Google Scholar]
- Szostak J.W., Orr-Weaver T.L., Rothstein R.J., Stahl F.W., Orr-Weaver T.L., Rothstein R.J., Stahl F.W., Rothstein R.J., Stahl F.W., Stahl F.W. The double-strand-break repair model for recombination. Cell. 1983;33:25–35. doi: 10.1016/0092-8674(83)90331-8. [DOI] [PubMed] [Google Scholar]
- Thompson J.D., Higgins D.G., Gibson T.J., Higgins D.G., Gibson T.J., Gibson T.J. CLUSTAL W: Improving the sensitivity of progressive multiple sequence alignment through sequence weighting, position-specific gap penalties and weight matrix choice. Nucleic Acids Res. 1994;22:4673–4680. doi: 10.1093/nar/22.22.4673. [DOI] [PMC free article] [PubMed] [Google Scholar]
- Tulin A.V., Kogan G.L., Filipp D., Balakireva M.D., Gvozdev V.A., Kogan G.L., Filipp D., Balakireva M.D., Gvozdev V.A., Filipp D., Balakireva M.D., Gvozdev V.A., Balakireva M.D., Gvozdev V.A., Gvozdev V.A. Heterochromatic Stellate gene cluster in Drosophila melanogaster: Structure and molecular evolution. Genetics. 1997;146:253–262. doi: 10.1093/genetics/146.1.253. [DOI] [PMC free article] [PubMed] [Google Scholar]
- Venter J.C., Adams M.D., Myers E.W., Li P.W., Mural R.J., Sutton G.G., Smith H.O., Yandell M., Evans C.A., Holt R.A., Adams M.D., Myers E.W., Li P.W., Mural R.J., Sutton G.G., Smith H.O., Yandell M., Evans C.A., Holt R.A., Myers E.W., Li P.W., Mural R.J., Sutton G.G., Smith H.O., Yandell M., Evans C.A., Holt R.A., Li P.W., Mural R.J., Sutton G.G., Smith H.O., Yandell M., Evans C.A., Holt R.A., Mural R.J., Sutton G.G., Smith H.O., Yandell M., Evans C.A., Holt R.A., Sutton G.G., Smith H.O., Yandell M., Evans C.A., Holt R.A., Smith H.O., Yandell M., Evans C.A., Holt R.A., Yandell M., Evans C.A., Holt R.A., Evans C.A., Holt R.A., Holt R.A., et al. The sequence of the human genome. Science. 2001;291:1304–1351. doi: 10.1126/science.1058040. [DOI] [PubMed] [Google Scholar]
- Waring G.L., Pollack J.C., Pollack J.C. Cloning and characterization of a dispersed, multicopy, X chromosome sequence in Drosophila melanogaster. Proc. Natl. Acad. Sci. 1987;84:2843–2847. doi: 10.1073/pnas.84.9.2843. [DOI] [PMC free article] [PubMed] [Google Scholar]
- Waterston R.H., Lindblad-Toh K., Birney E., Rogers J., Abril J.F., Agarwal P., Agarwala R., Ainscough R., Alexandersson M., An P., Lindblad-Toh K., Birney E., Rogers J., Abril J.F., Agarwal P., Agarwala R., Ainscough R., Alexandersson M., An P., Birney E., Rogers J., Abril J.F., Agarwal P., Agarwala R., Ainscough R., Alexandersson M., An P., Rogers J., Abril J.F., Agarwal P., Agarwala R., Ainscough R., Alexandersson M., An P., Abril J.F., Agarwal P., Agarwala R., Ainscough R., Alexandersson M., An P., Agarwal P., Agarwala R., Ainscough R., Alexandersson M., An P., Agarwala R., Ainscough R., Alexandersson M., An P., Ainscough R., Alexandersson M., An P., Alexandersson M., An P., An P., et al. Initial sequencing and comparative analysis of the mouse genome. Nature. 2002;420:520–562. doi: 10.1038/nature01262. [DOI] [PubMed] [Google Scholar]