

Abstract
Adjustment of physiology in response to changes in oxygen availability is critical for the survival of all organisms. However, the chronology of events and the regulatory processes that determine how and when changes in environmental oxygen tension result in an appropriate cellular response is not well understood at a systems level. Therefore, transcriptome, proteome, ATP, and growth changes were analyzed in a halophilic archaeon to generate a temporal model that describes the cellular events that drive the transition between the organism’s two opposing cell states of anoxic quiescence and aerobic growth. According to this model, upon oxygen influx, an initial burst of protein synthesis precedes ATP and transcription induction, rapidly driving the cell out of anoxic quiescence, culminating in the resumption of growth. This model also suggests that quiescent cells appear to remain actively poised for energy production from a variety of different sources. Dynamic temporal analysis of relationships between transcription and translation of key genes suggests several important mechanisms for cellular sustenance under anoxia as well as specific instances of post-transcriptional regulation.
Adaptation to varying levels of oxygen is critical for the survival of all organisms since this element is required for energy production in aerobic organisms, but is a dangerous poison for obligate anaerobes. Thus, diverse strategies have evolved for optimizing fitness under conditions of fluctuating oxygen availability. For example, anaerobic microbes have evolved specialized anoxic physiologies, including mechanisms to exclude and scavenge traces of oxygen (Imlay 2002). In contrast, facultative anaerobes such as Escherichia coli flexibly transition between oxidative metabolism and anaerobic growth, using alternate respiratory enzymes when oxygen becomes limiting (Nakano and Zuber 1998). Anoxia-tolerant eukaryotes such as Caenorhabditis elegans enter a state of suspended animation in which energy supply and demand are drastically reduced in a regulated manner during oxygen starvation (Hochachka et al. 1996).
Understanding cellular responses to oxygen at the molecular systems level requires comprehensive and quantitative measurements of changes in parameters such as transcription, translation, and metabolism. Transcriptome measurements are quite comprehensive (Lander 1999), whereas current technology limits the detection of the complete microbial proteome and metabolome; e.g., the highest reported coverage for microbial shotgun proteomics is 60% (Lipton et al. 2002; Brauer et al. 2006). Furthermore, in addition to this disparity in technical tractability, the dynamic nature of information processing at all of these levels further complicates the collective comparative analysis of global changes in transcriptome, proteome, and metabolome (Gygi et al. 1999; Ideker et al. 2001; Beyer et al. 2004). Consequently, the global dynamic relationships across these distinct but interconnected processes remain to be characterized to build a physiological model of systems behavior.
We chose the haloarchaeon Halobacterium salinarum NRC-1 as a model organism to investigate the systems-level oxygen response. This organism, found in the Great Salt Lake, the Dead Sea, and other waters with high salt concentration, requires an environment with a high concentration of salt for survival (∼4.0 M) (Robb et al. 1995). Our choice of this organism was guided by (1) the relative simplicity afforded by the small genome size (2.6 Mb) and lack of compartmentalization of prokaryotes, and (2) H. salinarum’s capability to effect metabolic changes within a remarkably narrow range of oxygen availability. Rapid shifts to low environmental oxygen tension is a frequent challenge to H. salinarum, existing in an environment nearly saturated with salt, where consumption resulting from high cell density and evaporation can rapidly lower oxygen tension below 5 μM (Robb et al. 1995) (Supplemental Methods). By comparison, most microbes (e.g., E. coli) exist in environments with oxygen saturation of ∼250 μM, thus the niche of the halophile would lead to rapid and severe cellular hypoxia for these organisms (Supplemental Methods). H. salinarum NRC-1 utilizes metabolic strategies similar to other facultative anaerobic microbes such as E. coli to alternate between four modes within a narrow range (0–5 μM) of oxygen concentration: (1) aerobic respiration via the tricarboxylic acid (TCA) cycle (Ng et al. 2000); (2) anaerobic fermentation via the arginine deiminase (ADI) pathway (Hartmann et al. 1980; Ruepp and Soppa 1996; Baliga et al. 2002); (3) anaerobic dimethyl sulfoxide (DMSO) and trimethylamine N-oxide (TMAO) reduction (Muller and DasSarma 2005); and (4) anaerobic energy production via bacteriorhodopsin-mediated phototrophy (Oesterhelt and Krippahl 1983; Gropp and Betlach 1994; Baliga et al. 2002). Despite good descriptive knowledge of these four modes, the response and regulation of other aspects of halobacterial physiology during fluctuations in oxygen tension remains largely uncharacterized.
Here we report a temporal model of key cellular events from environmental perturbation (input) to cellular phenotype (output) by simultaneously measuring changes in the transcriptome (61 time points), proteome (28 time points), physiological growth (61 time points), and metabolic outputs (18 time points) during controlled cellular transitions between oxic and anoxic environments. Our findings suggest that H. salinarum NRC-1 shifts from a state of anoxic quiescence to active growth when the oxygen supply is replenished. During quiescence, the organism appears to remain poised for a rapid transition to alternative metabolic states. We were able to significantly improve the concordance between changes in transcription and translation when a time lag was considered during data analysis. In addition, this analysis suggested several possible post-transcriptional strategies enabling adaptation to changes in oxygen. From this standpoint, the dynamic temporal model of H. salinarum NRC-1 has shed new insights into general principles of the oxygen response.
Results and Discussion
Experimental design and rationale
Cellular responses to changes in the environment require coordinated signal processing and other physiological adjustments at the transcriptional, translational, and metabolic levels. Therefore, to capture a systems perspective of cellular responses to oxygen, global changes in relative abundance of transcripts, proteins, ATP, and growth were measured in continuous chemostat cultures. In the chemostat, pH, cell density, light, and temperature were kept constant, whereas oxygen was perturbed in a controlled manner (Fig. 1; Table 1; Methods). Sampling was temporally more frequent close to perturbations to ensure that all rapid responses were measured, and less frequent farther from perturbations as cultures equilibrated to the new condition (Table 1). This experiment was conducted in triplicate, varying oxygen appropriately to assess the reproducibility of growth and molecular response characteristics (Fig. 1; Table 1; Methods). The results and conclusions from these oxygen response experiments are discussed below, first describing the physiological characteristics of the aerobic and anaerobic cellular states and subsequently providing a temporal synthesis of the dynamic events underlying transitions between these states.
Figure 1.

Experimental design. Three separate chemostat experiments were conducted in which H. salinarum NRC-1 cultures were grown in batch mode to mid-logarithmic phase (OD600 ∼ 0.5–0.7), followed by anoxic incubation for 24 h (experiments 1 and 3) or oxic incubation for 12 h (experiment 2). Oxygen tension was then perturbed (blue line) at concentrations shown on the right Y-axis and at time points shown on the X-axis. OD600 measurements (left Y-axis) were taken throughout the experiment (orange line), and culture aliquots were removed for microarray (all three experiments), proteomics (experiment 1), and ATP (experiment 3) analysis at the time points indicated in the graph (blue circles and orange triangles) and as listed in Table 1.
Table 1.
Physiological data for all three chemostat time course experiments

(ND) Not done; (NG) No growth.
amRNA for microarray and protein for iTRAQ proteomics were harvested from the same 10-mL samples at each time point (see Fig. 1 for time points).
bSince doubling times vary during growth to mid-log phase (includes lag), average doubling times reported for batch growth to mid-log phase.
cmRNA for microarray was harvested from 5-mL culture samples at each time point in experiment 2.
dmRNA and ATP samples were harvested from 7-mL culture samples at each time point in experiment 3 in boldface type.
eFlow rate was manually adjusted to achieve constant cell density, hence the variance in culture doubling times.
fThis is longer than expected from the doubling time during mid-logarithmic phase growth (6–8 h, top), suggesting that cultures may require additional time to fully recover from anoxia.
Physiological characterization of the oxygen response
Characterization of transitions in cell states: Anoxic quiescence to aerobic growth
Previous studies have shown that ATP production and growth of H. salinarum NRC-1 under anoxic conditions requires the addition of an anaerobic growth substrate; e.g., orange light at 459 μmol/m2sec, 1% arginine, or DMSO (Hartmann et al. 1980; Oesterhelt and Krippahl 1983; Muller and DasSarma 2005). However, in the natural environment, the organism will likely also encounter conditions with such defined substrates absent during frequent fluctuations in oxygen tension. We therefore sought to characterize cell physiology under these conditions. During a rapid transition from an oxic to anoxic environment (5–20 min), intracellular ATP levels dropped 1.8-fold in 6 h and fivefold within 24 h to plateau at a minimum of ∼0.6 ± 0.1 μM (Table 1, third experiment), approximately half that observed for flask-grown stationary phase H. salinarum NRC-1 cells (0.96 ± 0.08 μM) (Hartmann et al. 1980). Growth ceased 30–40 min after anoxia was induced, as evidenced by the fact that flow rate was no longer required to maintain a constant cell density in the chemostat (Table 1). Also, once the anoxic ATP concentration dropped to ∼0.6 μM, it remained relatively constant for as long as 6 d (Table 1, bottom). Despite the lack of proliferation, cells withdrawn for plating during the 24 h anoxic incubation showed normal viability (data not shown). Together, these latter two pieces of evidence suggest under anoxic conditions in the absence of secondary growth substrate, H. salinarum NRC-1 cells enter a state of quiescence.
In contrast to the oxic to anoxic shift, during the transition from anoxic to oxic conditions, ATP concentrations increased within 5 min, reaching a plateau at 90 min (Fig. 2; Table 1), after which growth resumed within 3 h. In summary, H. salinarum NRC-1 appears to reside in two alternate cell states: anoxic quiescence when oxygen and anaerobic growth substrates are absent and oxic growth when oxygen is plentiful.
Figure 2.

Physiological characterization of two opposing cell states in H. salinarum NRC-1. ATP and growth measurements during the third chemostat experiment. After a 24-h anoxic incubation period, oxygen was rapidly sparged into the system within 5 min (blue line, right Y-axis), and culture aliquots were removed at the time points indicated for measuring ATP concentration (green line, left Y-axis), transcriptomics (Fig. 3), and cell density (orange line). Flow rate through the chemostat (brown line) is directly proportional to the doubling time of the culture (see Table 1 for conversion of flow rate to doubling time).
The transcriptional response of H. salinarum NRC-1 to changes in oxygen tension
To characterize the transcriptional response to transitions between the oxic and anoxic cell states of H. salinarum NRC-1, we analyzed global changes in mRNA levels (Baliga et al. 2002). K-means clustering followed by principal component analysis (PCA) were used to group genes and assign an “oxic score” to each cluster (Fig. 3A; see Methods for details). This score is derived from the observation that the projected position of each cluster’s mean profile along the first principal component (PC1) (Fig. 3A) correlated most strongly with the ability to predict its dynamics based upon the changes in the measured oxygen tension levels via a linear model (Supplemental Fig. 2) (Bonneau et al. 2006). We therefore used the values along the PC1 axis to assign the “oxic score” to each cluster, which varied from −5 (strongly repressed by oxygen; “oxygen-anticorrelated”) to +10 (strongly activated by oxygen; “oxygen-correlated”) (Fig. 3A). This analysis yielded a total of 215 genes whose transcription was strongly affected by changes in oxygen. The gene set partitioned into two distinct groups: 106 genes whose transcription was induced with increases in oxygen levels and repressed with decreasing oxygen (hereafter referred to as “oxygen-correlated” genes; Supplemental Table 1); and 109 genes with transcriptional changes that were repressed with increasing oxygen and induced with decreasing oxygen (hereafter referred to as “oxygen-anticorrelated;” Supplemental Table 2). The transcriptional response to oxygen for each gene in these groups was reproducible in all three time-course experiments (Fig. 3B,C). All differentially expressed genes were distributed among 16 functional categories according to GO (GO, http://www.geneontology.org) (Ashburner et al. 2000), KEGG (Kyoto Encyclopedia of Genes and Genomes, http://www.genome.jp), PFAM (http://www.sanger.ac.uk/Software/Pfam/), and COG (clusters of orthologous groups, http://www.ncbi.nih.gov/COG; Kanehisa 1997; Tatusov et al. 1997, 2003; Kanehisa and Goto 2000; Finn et al. 2006; Kanehisa et al. 2006; Fig. 4A,B; Supplemental Tables 1,2). Functional representations within the oxygen-correlated and oxygen-anticorrelated gene groups are discussed below.
Figure 3.

Microarray results reveal two distinct, temporally coherent gene groups that change in response to oxygen for the duration of the stimulus. (A) K-means and principal component analysis (PCA) of microarray oxygen time series data. Each small number on the graph represents the location of an individual gene’s expression profile as projected into the first (X-axis) and third (Y-axis) principal components. Membership in the K-means clusters is color coded, and the location of the centroid of clusters chosen for further analysis and their cluster numbers (5, 10, 18, 19, 24, 28) are plotted as large circles. The annotations for genes contained within each cluster are listed in Supplemental Table 4. Mean profiles of the clusters most significantly correlated and anticorrelated with oxygen are shown in B and C, respectively. (B) Expression profiles for the two most significantly oxygen-correlated gene clusters, 10 and 19, are plotted against the oxygen tension profile (thick black line, left Y-axis) and time points for all three chemostat experiments (X-axis). The mean transcriptional profile of cluster 10, which includes (among others) TCA cycle and oxidative phosphorylation genes, is depicted by the red line; and that of cluster 19, including (among others) ATP synthase, protein biosynthesis, and gas vesicle cluster 1 genes, is shown by the green line. Standard deviations of each gene from the mean transcript profile were omitted for clarity. (C) Expression profiles for the clusters most significantly anticorrelated with oxygen. Clusters 5, 18, 24, and 28 are depicted by the cyan, red, gray, and dark blue lines, respectively. The functions listed in the legend were distributed throughout these four highly correlated clusters.
Figure 4.

Functional categorization of genes significantly correlated or anticorrelated with oxygen. (A) Functional categories for oxygen-correlated genes. (B) Functional categories for oxygen-anticorrelated genes. Percentages for each slice of the pie chart refer to the fraction of genes from that category that make up the total 106 oxygen-correlated (A) or 109 oxygen-anticorrelated (B) genes. GO and KEGG functional over-representation P-values for these categories are shown in parentheses and Supplemental Tables 1 and 2. Those categories with no P-value were not present in the GO and KEGG database annotations (and are part of the 98 hand-curated annotations described in the Methods). (C) DMSO reduction and bacteriorhodopsin-mediated phototrophy genes are induced by anaerobiosis even in the absence of DMSO or light. Each gene in the pathways is shown, the color-coded profile for which is denoted in the legend. (D) Surprisingly, the arcRABC gene cluster, encoding proteins in the ADI pathway for anaerobic arginine fermentation, is not correlated with oxygen.
During anoxic quiescence, the H. salinarum NRC-1 transcriptome is poised for a transition to three metabolic modes of energy transduction
Both expected and unexpected results were found within the oxygen-correlated and oxygen-anticorrelated gene group transcriptome data. For example, we were surprised to find that two paralogous copies of the gas vesicle biogenesis proteins were anticorrelated with each other, a result that is discussed in detail in the Supplemental material (Supplemental Fig. 3). However, as expected, our analysis identified two clusters (10 and 19) with high “oxic scores” (8.9 and 9.2, respectively) (Fig. 3B). These clusters are functionally enriched with genes involved in aerobic processes such as oxidative phosphorylation and TCA cycle, ribosome biogenesis, and translation (Fig. 4A; Supplemental Table 1). This analysis suggests that, as expected, the genes encoding processes critical for aerobic metabolism are transcriptionally induced in the presence of oxygen.
In the oxygen-anticorrelated gene group, transcripts encoding DMSO reductase (Muller and DasSarma 2005), phototrophy, and their respective transcription regulators were significantly induced when oxygen was removed, and likewise, were repressed as oxygen increased; oxic score: −4.4 (Figs. 3C, 4B,C; Supplemental Table 2). Since no substrate for either of these two processes was provided during the experiments (Methods), these data suggest that H. salinarum NRC-1 appears to anticipate an alternate growth substrate when oxygen is limiting.
In contrast, the arcRABC gene cluster, which encodes the enzymes and regulators for the arginine deiminase (ADI) fermentation pathway, did not transcriptionally respond to oxygen (oxic score = 1.7) (Fig. 4D). This is consistent with the observation that significant transcriptional induction of these genes is only observed in halobacterial cells grown fermentatively in the presence of exogenously added arginine in rich medium (Ruepp and Soppa 1996). In addition, it has been observed in a previous report that phototrophy and arginine fermentation may be inversely and coordinately regulated, which could also explain our result (Baliga et al. 2002).
Large-scale changes in two oppositely expressed, temporally coordinated transcriptomes are associated with the transition from the anoxic to oxic cellular state
Transcriptional responses to stress can often be classified into early, middle, or late events based on their temporal separation. Although oxygen-correlated and oxygen-anticorrelated transcripts were both regulated to new steady-state levels within ∼90 min of an oxygen perturbation (Fig. 3B,C), we did not visually identify a significant temporal separation among these transcriptional responses (Supplemental Fig. 4). We therefore measured the average time lag between transcriptional responses, and found that it had a variance of only 1.5 min (see Supplemental Methods for calculation). This suggests that the transcript profiles for both oxygen-correlated and oxygen-anticorrelated genes were temporally coherent. This observation contrasts with environmental responses to stressors that damage cells, such as excess iron and heat shock, which are marked by transient induction of transcripts within 5–15 min of sudden exposure (Yura and Nakahigashi 1999; Kaur et al. 2006). The modulation of these damage-responsive genes is temporally separated into early and late events, suggesting that most of the early changes repair cellular damage, whereas later responses function to resume the previous cell state and maintain homeostasis (Yura and Nakahigashi 1999; Kaur et al. 2006). In contrast, during the response to fluctuating oxygen, H. salinarum NRC-1 shifts its transcriptome to new steady-state levels in a temporally synchronized manner to achieve a completely alternate cell state. In general, cellular transitions to new metabolic states, therefore, appear to be associated with a complete change in the transcriptome as has been observed in other organisms such as E. coli (Partridge et al. 2006, 2007).
The translational response of H. salinarum NRC-1 to changes in oxygen tension
To determine the extent to which the transcript level changes described above are dynamically reflected at the protein level, and in turn, at the phenotype level, whole-cell quantitative proteomics analysis was conducted using the mass spectrometry-based iTRAQ method (Ross et al. 2004; Whitehead et al. 2006; Stensjo et al. 2007).
Over all 28 time points in the proteomics data set (Table 2) 1294 of the 2400 predicted proteins in the H. salinarum NRC-1 proteome (54%) were detected under conditions of fluctuating oxygen (Supplemental Table 3). For these detected proteins, a stringent probability cutoff of ≥0.9 was chosen, giving a low average false discovery rate of 0.6% ± 0.002% at the peptide and protein levels (Nesvizhskii et al. 2003; Keller et al. 2005; Nesvizhskii and Aebersold 2005) (Methods). Using these criteria, up to 40% of the total predicted proteome was detected in each of the 10 multiplexed samples (Table 3). The overall coverage for this study (54%) is the best recorded to date for quantitative microbial shotgun proteomics experiments (Supplemental material; Baliga et al. 2002; Whitehead et al. 2006). In addition, analysis of replicates showed that the coefficient of variation for iTRAQ was comparable to other established quantitative methods such as ICAT (CV ∼18% vs. 20%, respectively; Supplemental Fig. 5; Molloy et al. 2005).
Table 2.
Experimental setup and iTRAQ proteomics labeling scheme
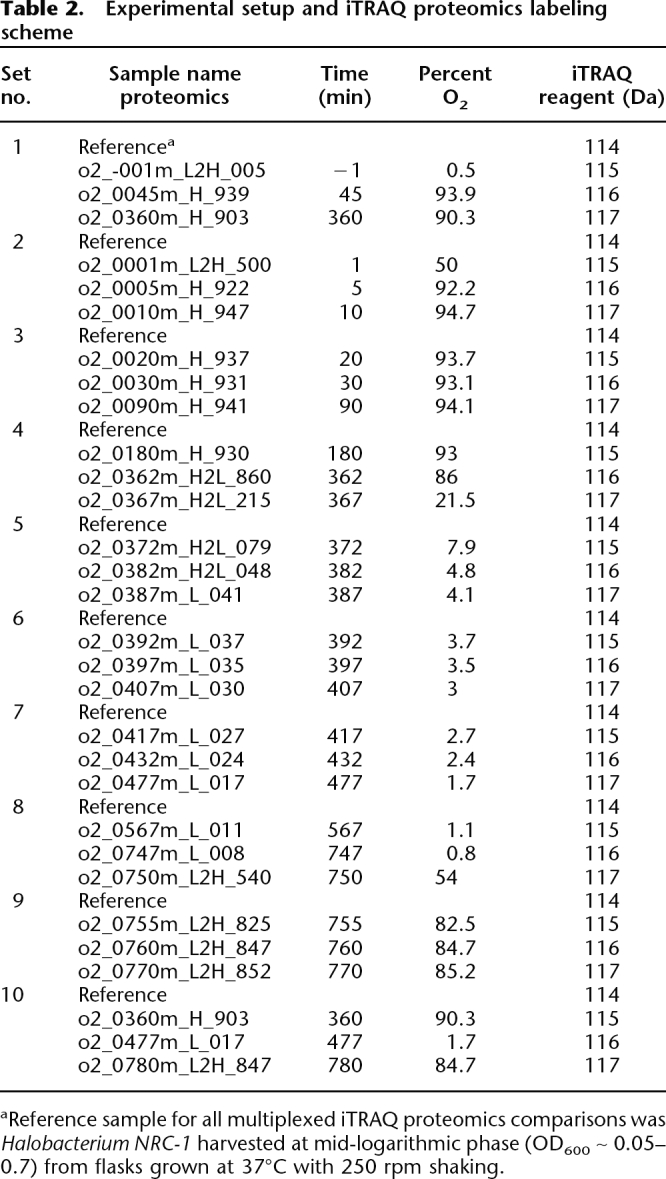
aReference sample for all multiplexed iTRAQ proteomics comparisons was Halobacterium NRC-1 harvested at mid-logarithmic phase (OD600 ∼ 0.05–0.7) from flasks grown at 37°C with 250 rpm shaking.
Table 3.
Proteomics data coverage for functional categories

aSee Table 2 for details about each iTRAQ set number. Percent of proteins detected is calculated from the total number of predicted nonredundant open reading frames (ORFs) in the complete and annotated H. salinarum NRC-1 genome sequence (baliga.systemsbiology.org) compared with detections in the proteome data set.
bCategories correspond to those from Figure 4, A and B (genes whose transcripts were significantly differentially expressed in response to oxic/anoxic transitions), except that all categories pertaining to energy generation were collapsed into one category for clarity in the table. “Oxygen-correlated” refers to those genes whose transcripts were strongly induced by increases oxygen. “Oxygen-anticorrelated” refers to those genes whose transcripts were strongly repressed by increases in oxygen.
Despite evenly distributed sampling from the oxic and anoxic growth regimes, peptides from proteins encoded by oxygencorrelated transcripts were significantly over-represented (79% detection, P < 10−20), and conversely, the proteins encoded by oxygen-anticorrelated transcripts were significantly under-represented (27% detection, P < 10−25) in the proteomics data set (Supplemental Fig. 6). To determine the potential reasons for this bias, we calculated the codon adaptation indices (CAI) for all of the proteins that were detected (Methods) (Wu et al. 2005). CAI measures the bias at the wobble position in each codon, and a bias toward preferred codons (high CAI) has been shown to be directly proportional to the absolute levels of gene expression (Sharp and Li 1987). For the 97 oxygen-responsive proteins that were detected in our proteomics data set (Table 3), the average CAI was higher for oxygen-correlated than that for oxygen-anticorrelated proteins (0.78 vs. 0.65). In addition, the average number of peptides detected for oxygen-correlated proteins was 6.5, whereas that for anticorrelated proteins was two (Supplemental Table 5).
Combined, these data suggest that the proteins associated with oxic physiology (oxygen-correlated) of H. salinarum NRC-1 are in higher abundance relative to anoxic proteins (oxygen-anticorrelated) irrespective of the oxygen tension in the environment. This bias toward oxic proteins was taken into consideration in all subsequent analyses (see below; Fig. 5). Although these results are in keeping with previous genome-wide proteomics studies, which also observed a bias toward highly expressed proteins (Gygi et al. 1999; Ideker et al. 2001), our data further suggest that proteins associated with active growth are relatively abundant even in environments less favorable for their function.
Figure 5.

Time lags between transcription and translation were calculated for individual genes and for the global data set. (A) Interpolated profiles for an example gene. Quantitative iTRAQ protein data (log10 ratios; ●) and mRNA levels (log10 ratios; ○) are shown for CbiJ, the precorrin 3-methylase of the cobalamin biosynthesis pathway. Error bars represent the standard error in all peptide quantitations. Cubic spline interpolated profiles for the protein data (orange line), and mRNA (blue line) are overlaid (see legend). The X-axis represents time post-shift to high oxygen in the first replicate chemostat experiment (see also Fig. 1; Table 1). (B) Schematic of time shifting strategy for an example operon. Protein profiles such as those shown in A (orange) are shifted relative to interpolated mRNA profiles (blue) and the time lag Δt corresponding to the maximum correlation is recorded (peak time lagged correlation; PTLC). Gray lines represent protein profiles at less-than-optimum time lags, and the position at which the orange line (protein) overlaps the blue line (mRNA) represents the PTLC position. (C) Time-lagged correlation profile for cbiJ is significantly better than random. Permutation tests were performed whereby 100 different scrambled (green, with standard errors 1-σ from mean) and shuffled (red, with standard errors) mRNA profiles (see Methods) were subjected to the same time-lagged correlation comparison with the CbiJ protein data (as depicted in A and B) and compared with the true TLC for cbiJ (black dotted line). The most significant difference between the cbiJ profile and random was at Δt = 19 min (purple dotted line; P < 0.01). (D) The mean, global time lag for all genes occurs at ∼16 min. Approximately 75% of time lag correlations for all genes at this time lag are better than random, whereas only ∼60% of time lags are greater than random when no time lag is considered (Δt = 0). (E) The difference between these global percentages is significant for both types of permutation test (P ∼ 10−4), especially near Δt = 16 min. A and C are shown for several other genes and operons in Supplemental Figures 7 and 8, respectively.
Temporal dynamics of the oxygen response
Comparison of transcriptome and proteome data suggests instances of post-transcriptional regulation in response to oxygen
Transcription and translation are rapid, dynamic events that occur sequentially on the order of minutes. Due to the technological limitations of proteomics technology, previous studies comparing transcriptome and proteome measurements have either measured only one time point (Gygi et al. 1999; Baliga et al. 2002; Griffin et al. 2002; Kolkman et al. 2006; Newman et al. 2006) or measured a few time points on the order of hours (Whitehead et al. 2006) or days (Kislinger et al. 2005; Cox et al. 2007). Therefore, to calculate a more realistic relationship between transcript and protein-expression dynamics during a cell-state transition, we computed the correlation between the interpolated transcript profile for each gene in our data set with its corresponding time-shifted cognate protein profile (28 time points) in 1-min intervals from −5 to +40 min (Whitehead et al. 2006; Fig. 5A,B; Methods). This analysis yielded a “correlation profile,” for which we could identify a maximum mRNA/protein correlation along this curve (a “peak time-lagged correlation” [PTLC]; Fig. 5), which occurred at a certain time lag (the “peak time lag,” Δt). We found that the most significantly correlated genes (P < 0.01; np ≥ 9) had Δt’s between 13 and 22 min and covered a broad range of functions including (among others) cobalamin biosynthesis (cbiJ [Fig. 5A] and cbiH2), ribosome biogenesis (rpl18e, rps24C), ATP biosynthesis (atpB), gas vesicle biogenesis (gvpF1), and metal regulation (sirR, fbr) (Supplemental Fig. 7). Time lags for proteins of similar functions corroborated each other; for example, the Δt of two ribosomal genes (rpl18e, rps24C; see above) occurred within 1 min of each other (Supplemental Fig. 7).
For genes with less coverage (i.e., np < 9), we were able to repeat the PTLC analysis for combined mRNA and protein profiles of genes in the same operon (Methods) if we assumed that genes in an operon are cotranslated as well as cotranscribed. This operon analysis enabled detailed time-lag calculation for some genes with relatively poor individual signal in the protein data (Supplemental Fig. 8).
To our knowledge, this is the first system-wide study of its kind to enable calculation of time lags between dynamic changes in transcription and translation at the level of individual genes (Yildirim and Mackey 2003). Previously, low correlation from single time-point studies has often been interpreted as evidence of post-transcriptional regulation (Gygi et al. 1999; Ideker et al. 2001; Beyer et al. 2004; Brockmann et al. 2007). However, we find that as more time points are included in the analysis, it becomes possible to identify more genes with significant time-lagged correlations (Supplemental Figs. 7, 8). For example, ∼95% of the genes for which we were able to calculate a significant TLC (P < 0.05) had np ≥ 18 (i.e., covered >50% of the time course). Thus, prior studies that invoked post-transcriptional regulation to explain a lack of mRNA/protein correlation in data for one or a few time-point measurements may be doing so prematurely, particularly using current high-throughput proteomics technologies, since those studies may not have sufficient data to investigate dynamics as we have done here. Detailed descriptions of mRNA/protein dynamics therefore requires high-resolution time-course sampling, and points to a critical need for improved proteomics technology, which will increase the quality and comprehensiveness of proteomics data while decreasing cost.
Among all genes and operons that were analyzed, we estimated an average peak time lag of Δt ∼ 16 min. At this PTL, we find that the percentage of genes with correlations greater than random increases from ∼60% at Δt = 0 min, to ∼75% at Δt = 16 min (Fig. 5D); this difference in percentages is very unlikely to occur at random (P < 10−4; Fig. 5E). Using this metric, for the 215 oxygen responsive genes, the percentage of genes with significantly correlated changes in mRNA and protein increases from ∼70% at Δt = 0 min to ∼90% at Δt = 16 min. This time lag of 16 min is significantly longer than the expected ∼2-min delay between transcription and translation based on previous calculations for certain genes such as the lacZ operon in E. coli (Yildirim and Mackey 2003). This is probably an outcome of several factors, including reduced translational capacity, which is a universal mechanism used by aerobic organisms to conserve energy during prolonged anoxia (Andersson et al. 1984; Warner 1989; Borriello et al. 2004; Liu and Simon 2004; Branco-Price et al. 2005). Specifically, the low concentration of rRNA, ribosomes, amino acids, amino acid precursors, and tRNAs are known to decrease translation and ribosome production rates (Farrish et al. 1982; Andersson et al. 1984; Pang and Winkler 1994).
Stability of mRNA is an additional factor that has significant impact on the time gap between transcription and translation. The median mRNA half-lives measured globally E. coli, Bacillus subtilis, and Lactococcus lactis are on the order of 3–8 min for aerobic cells growing at optimum rates (Bernstein et al. 2002; Hambraeus et al. 2003; Redon et al. 2005). This is somewhat paradoxical because a 3–8 min mRNA half-life in anoxic cells hampered by reduced translational capacity would imply that transcripts are degraded before the 16-min lag when translational precursors become available (Fig. 5). It is possible that transcripts are maintained during anoxia by continual refreshment of transcripts in a cycle of low but constant constitutive transcription and turnover. However, it is known in many other prokaryotic species that bulk RNA turnover is retarded three- to fourfold upon starvation by an unknown mechanism to aid anoxic survival (Georgellis et al. 1993; Kuzj et al. 1998; Redon et al. 2005). Thus, the mRNA half-life would also be on the same time scale as the globally measured time lag of ∼16 min in H. salinarum during the transition from anoxic to oxic conditions. In summary, the observed delay between transcription and translation (Fig. 5) appears to be attributable to the time required to replenish ribosomes and other translational precursors as cells prepare to go into the aerobic physiological state. During this period, the simultaneous increase in the stability of bulk RNA may be a complementary mechanism to ensure that the integrity of transcripts is not compromised until resources for renewed translation are restored.
A transient burst of protein synthesis is an early event during the switch to aerobic metabolism
Notably, we observed a transient spike in protein levels occurring in the first ∼20 min after oxygen upshift. This phenomenon was observed only for certain aerobic operons associated with ribosome biogenesis (Fig. 6; Supplemental Fig. 8E,G), TCA cycle, and cobalamin biosynthesis (Supplemental Fig. 8A,B), but not observed for other aerobic operons such as those encoding chemotaxis and transport functions (data not shown). Intriguingly, like other oxygen-correlated genes, the transcript levels for these operons exhibiting the protein spike do not increase until 20–25 min after the switch to oxic conditions, coincident with the return to baseline of the protein levels (Fig. 6). Three nonexclusive post-transcriptional mechanisms could account for this protein burst: (1) differentially regulated translation initiation, perhaps by a small regulatory RNA (Storz et al. 2005), such that certain extant transcripts are preferentially translated once resources become available; (2) low-level constitutive transcription of certain messages; (3) preferential stabilization of certain transcripts, allowing H. salinarum cells to reside in a state of preparedness for immediate synthesis of key proteins once a favorable environment is encountered (Kuzj et al. 1998), consistent with similar observations in bacteria and plants (Takayama and Kjelleberg 2000; Bernstein et al. 2002; Hambraeus et al. 2003; Branco-Price et al. 2005; Redon et al. 2005). Experiments that globally measure transcript half-lives would enable differentiation between these three hypotheses, and will be the subject of future study.
Figure 6.

An initial burst of translation for some operons is observed prior to induction of RNA expression after oxygen up-shift. Mean profiles are shown for all genes in the largest ribosomal operon, which contains 24 genes from VNG1688–VNG1719 (mean transcript profile in blue and mean protein profile in orange). The X-axis represents time post-shift to high oxygen in the first replicate chemostat experiment (see also Fig. 1 and Table 1).
A dynamic temporal map of the physiological response to oxygen
Integration of all transcript, protein, physiological, and phenotypic level data generated in this study enabled the temporal mapping of cellular events following a cell-state shift from anoxic quiescence to aerobic growth (Fig. 7). According to this map, when the dissolved oxygen content of an anoxic culture of H. salinarum NRC-1 is rapidly increased to saturation within 5 min, a burst in the synthesis of certain proteins (e.g., ribosomal and TCA cycle components) prepares the cells for the switch to a new physiological state. ATP levels begin to rise at 10 min, followed by an increase in transcription of aerobic genes starting at 15 min (Fig. 7). The significant correlation observed between the rate of increase in ATP concentration and transcript levels, with both reaching maximal levels at 120 min (Fig. 2), suggests that energy availability may be the rate-limiting step for transcription during the anoxic/oxic transition. Simultaneously, transcripts associated with anaerobic physiology are down-regulated and their levels reach a minimum at 120 min. Subsequently, a second wave of protein induction is observed starting at 90 min, most likely originating from the newly transcribed mRNA templates. The sequence of events described above eventually culminates in growth and cell division ∼120 min after the switch to an oxic environment.
Figure 7.

A comprehensive temporal model of molecular events occurring between incidence of oxygen and resumption of growth. (A) Data summary. Oxygen (black line) is plotted against time (X-axis) and overlaid with mean profiles for all 106 significantly oxygen-correlated transcripts (purple line), 109 oxygen-anticorrelated transcripts (orange line), ATP concentrations (green line), growth rate from chemostat experiments (brown line), and protein profiles for all 83 proteins that were detected for oxygen-correlated transcripts (red line). Each line in the graph was plotted on its own scaled Y-axis (data not shown) against time (X-axis) and superimposed on the others for clarity. (B) Dynamic temporal timeline model. Each parameter measured is shown in a colored box corresponding to its time of induction (more intense color) and repression (fading to white).
This descriptive model therefore surprisingly suggests that, immediately following the anoxic to oxic transition, an increase in ATP production and the transient induction of certain key proteins precedes transcriptional induction of all genes associated with the aerobic physiological state. We hypothesize that the higher abundance of proteins associated with active growth (Supplemental Fig. 6) and perhaps the preferential stabilization of certain transcripts (e.g., those genes encoding ribosomes and cobalamin biosynthesis enzymes; Fig. 5; Supplemental Fig. 8A) during anoxic stress could be underlying mechanisms that enable “on-demand” energy and protein production upon encountering a more favorable environment. Using these strategies during anoxic quiescence, H. salinarum NRC-1 may remain poised for DMSO- or phototrophy-mediated anaerobic metabolism (Fig. 4C) as well as oxidative phosphorylation-mediated aerobic metabolism (Fig. 7). The dynamic temporal analysis approach delineated in this study combined with future investigations of important parameters such as mRNA degradation and protein turnover rates should enable deeper insight into the regulatory dynamics of transcription and translation.
Methods
Culturing conditions and experimental design
H. salinarum NRC-1 (ATCC700922) was routinely grown in complex medium (CM; 250 NaCl, 20 g/L MgSO4·7H2O, 3 g/L sodium citrate, 2 g/L KCl, 10 g/L peptone) at 37°C. For chemostat experiments, starter cultures of NRC-1 were inoculated into 2 L of CM in a 3.0 L vessel (5%–10% inoculum) and grown to mid-logarithmic phase (OD600 ∼ 0.5) in batch mode in a BioFlo100 modular bench top fermentor (New Brunswick Scientific) at 300 rpm (pH 7.0). Prior to each experiment, an oxygen sensor (model InPro 6000, Mettler Toledo) was calibrated to 100% oxygen at 1100 rpm and sparging with 3.2 VVM of air. These conditions were approximately equivalent to oxygen saturation in CM medium, which is 1.6 mg/L (∼5 uM) according to our salinity compensation calculations (Supplemental Methods). Three replicate chemostat experiments were conducted. Complete data regarding experiment design, sample preparation schedule, growth rates, pH, turbidity, and oxygen concentrations for all time points for the three experiments are listed in Table 1 and depicted in Figure 1. During these experiments, no arginine, DMSO, or TMAO was exogenously added to the rich medium during anaerobic growth, and ambient light in the lab was measured in photons at 10 μmol/m2 sec using a LI-COR LI-189 quantum/radiometer/photometer (LI-COR Biosciences). These conditions are known to be insufficient for anaerobic energy production via phototrophy (requires 459 μmol/m2 sec) (Oesterhelt and Krippahl 1983), arginine fermentation (Ruepp and Soppa 1996), and DMSO reduction (Muller and DasSarma 2005). Shifts from oxic to anoxic conditions were achieved by dropping agitation to 250 rpm and stopping airflow. Under these conditions, oxygen in the medium dropped rapidly to ∼0%. Shifts from anoxic to oxic conditions were achieved by increasing flow rate to 1100 rpm and increasing airflow to 3.2 VVM (vessel volumes per minute). Simultaneous mRNA and protein samples were harvested from 10-mL samples at each time point in experiment 1, mRNA from experiment 2 (5 mL per time point), and simultaneous mRNA and ATP measurements were taken in experiment 3 (7 mL per time point) (Fig. 1; Table 1). Removal of these volumes over the time course did not have a significant effect on the continuous culture, since they were minimal compared with the total 2 L volume in the chemostat.
ATP concentration was measured using the ATP Bioluminescent Assay Kit (Sigma) according to the manufacturer’s instructions. To prepare culture samples for the ATP assay, 1 OD unit of culture was pelleted, washed once in basal salts buffer (CM medium without peptone), and lysed in 1 mL of sterile milliQ water (H. salinarum NRC-1 cells lyse readily at osmolarities lower than 2 M NaCl due to their obligate halophilicity). Tenfold serial dilutions of lysates were measured against serially diluted ATP standards using 1:625 diluted bioluminescence assay mix on an EG&G Berthold LB96V microplate luminometer set to inject every 10 sec.
RNA preparation and microarray protocol
H. salinarum NRC-1 sample cultures (5 mL) were harvested by room temperature centrifugation at 16,000g for 30 sec and snap-frozen on a dry-ice ethanol bath. Sample pellets were stored overnight at −80°C, followed by RNA preparation using the Absolutely-RNA kit (Stratagene) according to the manufacturer’s instructions. A total of 5 μg of each experimental RNA sample was hybridized against the H. salinarum NRC-1 reference RNA prepared under standard conditions (mid-logarithmic phase batch cultures grown at 37°C under full-spectrum light in CM). This common H. salinarum NRC-1 reference RNA has been used as the reference across all 950 microarray experiments in the H. salinarum NRC-1 microarray data repository (Baliga et al. 2004; Bonneau et al. 2006; Kaur et al. 2006; Reiss et al. 2006; Whitehead et al. 2006). Samples were hybridized to a 70-mer oligonucleotide array containing the 2400 nonredundant ORFs of the H. salinarum NRC-1 genome as described in Baliga et al. (2004). Each ORF was spotted on each chip in quadruplicate and dye-flipping was conducted (to rule out bias in dye incorporation) for all time course samples, yielding eight technical replicates per gene per time point. Two biological replicates exist for all time points for a total of 16 replicates per gene (Table 1). Direct RNA labeling, slide hybridization, and washing protocols were performed as described previously (Baliga et al. 2002, 2004), except that Dy547 and Dy647 dyes (Kreatech) were used to directly label RNA. Raw intensity signals from each slide were processed by the SBEAMS-microarray pipeline (Marzolf et al. 2006) (www.SBEAMS.org/microarray), where resultant data was median normalized and subjected to significance of microarray (SAM) and variability and error estimates (VERA) analysis. Each data point was assigned a significance statistic, λ, using maximum likelihood (Ideker et al. 2000).
Microarray data analysis
Using the Gaggle integrated data analysis software package (Shannon et al. 2006), all mean and variance normalized transcriptome data from the three replicate oxygen time-series experiments (61 total conditions for 2400 genes, analyzed as a concatenated data matrix) were filtered according to the following two protocols to compile the final oxygen-responsive gene list.
Protocol 1
Data from each of the three experiments was separately filtered for a VERA-SAM (Marzolf et al. 2006) λ likelihood significance cutoff of 7 in at least five consecutive time points (previously determined to be a significant cutoff above the signal/noise ratio by self-self hybridizations; N. Baliga, unpubl.; Ideker et al. 2000) and subsequently subjected to principal component analysis (PCA). This analysis resulted in ∼600 genes for each experiment that were either correlated (∼300) or anticorrelated (∼300) with oxygen. These gene groups were expanded to include genes putatively associated in operons. These operon associations were calculated using a two-step nonhomology model in which (1) operon boundaries were set by intergenic distance constraints (Moreno-Hagelsieb and Collado-Vides 2002), and (2) operon membership required a significantly correlated mRNA coexpression over ∼950 microarray conditions (Baliga et al. 2004; Kaur et al. 2006; Reiss et al. 2006; Whitehead et al. 2006). The intersection of the three separately computed gene groups and the list derived from protocol 2 (described below) comprises the final list of 215 genes.
Protocol 2
K-means clustering was used to group the profiles of the entire transcriptome data set (61 time points). To choose an appropriate value for k in our data set, we investigated the mean residuals of the genes from the cluster means for a wide range of k’s (10–200) and k of 30 enabled the best solution for maintaining simplicity (small number of clusters) and optimizing cluster coherence. Principal component analysis (PCA) was then used to assign a numerical measure for each cluster that correlated with its response to oxygen (Fig. 3A). We found that the projected position of each cluster’s mean profile along the first principal component (PC1) (Fig. 3A) correlated most strongly with the ability to predict its dynamics based upon the measured oxygen tension levels via a linear dynamical model (Supplemental Fig. 2; Bonneau et al. 2006). The third principal component (PC3) was also more strongly correlated with oxygen than the second component (Supplemental Fig. 1). In addition, the majority of the variance in the transcriptome profiles could be explained by the first and third principal components (Supplemental Fig. 1). We therefore used PC1 to assign to each cluster a numerical “oxic score,” which varied from −5 (repressed by oxygen) to +10 (activated by oxygen) (Fig. 3A); and used PC3 as the second axis. This analysis yielded 771 genes in nine clusters with highly significant correlation or anticorrelation with oxygen. The intersection between these genes and those from protocol 1 (described above) yielded the final list of 215 “oxygen-responsive” genes (Fig. 3; Supplemental Tables 1, 2).
Gene annotations were assigned (Fig. 4) based on the following three criteria: (1) Gaggle-integrated functional annotation predictions from the GO, KEGG, COG, and PFAM databases (Kanehisa 1997; Tatusov et al. 1997, 2003; Kanehisa and Goto 2000; Finn et al. 2006; Kanehisa et al. 2006); (2) matches to the Protein Data Bank (PDB) (http://www.pdb.org; Berman et al. 2000) of structures predicted by the Rosetta protein-folding algorithm (Bonneau et al. 2004); and (3) experimental characterizations found in the literature. Through this analysis, 98 putative functions were either revised or newly assigned for previously misannotated or unannotated oxygen-responsive genes, respectively. In summary, annotations were updated for 7% of all differentially expressed genes, 22% of all oxygen-anticorrelated, and 5% of all oxygen-correlated genes; these updated annotations have been incorporated into the annotation database, publicly accessible at http://baliga.systemsbiology.net/halobacterium. Complete datasets for all differentially expressed genes including ORF numbers, gene aliases, detailed up-to-date annotations, and transcript ratios over the complete oxygen time series are listed in Supplemental Table 1 (induced genes) and Supplemental Table 2 (repressed genes). P-values for over-representation of these genes in GO categories were determined using the cumulative hypergeometric distribution and were corrected for multiple hypothesis testing.
Protein preparation and mass spectrometry analysis
A total of 5 mL of mid-logarithmic phase H. salinarum NRC-1 (∼5 × 10⁹ cells) culture was pelleted at room temperature by centrifugation for 2 min at 9000g. Culture supernatant was discarded and pellets were immediately snap-frozen on a dry-ice ethanol bath and stored overnight at −80°C. Lysis of cell pellets was achieved by resuspending in 1 mM phenylmethylsulfonyl fluoride in water (PMSF, a protease inhibitor; H. salinarum NRC-1 cells lyse readily at osmolarities lower than 2 M NaCl due to their obligate halophilicity); soluble and insoluble protein fractions were separated by centrifugation at 25°C, 16,000g for 5 min. Insoluble protein pellets were dissolved in 3 μL of 10% SDS, mixed with the soluble fraction, and stored at −80°C. Nucleic acid was subsequently removed from protein extracts by incubating at 37°C for 45 min with 37.5 U of Benzonase nuclease (Novagen). Complete digestion of nucleic acid was verified on a 4% agarose gel (data not shown). Proteins were then precipitated with six volumes of cold acetone (as instructed by the iTRAQ reagents kit, Applied Biosystems) to remove interfering SDS and PMSF, followed by resuspension in water. Total protein concentration was determined using the bicinchoninic acid method (Pierce), and 100 μg of protein from untreated reference and oxygen-treated cells were digested with trypsin at 37°C for 12–16 h. Resultant peptides were labeled at primary amines using the iTRAQ reagents multiplex kit (Applied Biosystems) according to the manufacturer’s instructions. Reference samples were labeled with a 114 Da reagent, whereas oxygen-treated time point samples were labeled with each of 115-, 116-, or 117-Da reagents. Detailed multiplex labeling parameters for each of the 10 four-plex time-course sample sets are listed in Table 2.
iTRAQ-labeled peptide samples were analyzed via LC-MS/MS using an Applied Biosystems API QSTAR Pulsar i, equipped with an in-house nanospray device. Samples were eluted onto a 10 cm × 75 μm-fused silica microcapillary reversed phase column (packed with 5 μm, 100 Å pore Magic C18AQTM beads; Michrom Bioresources) over a 60-min gradient, ranging from 10:90 (acetonitrile: 0.1% Formic acidaq) to 35:65 with a flow rate of 200 nL/min. Eluting peptides were analyzed using the IDA (Information Dependent Acquisition) function of the Analyst QS software with the two most abundant ions selected for MS/MS. The MS mass range scanned was from 350 to 1300 m/z, and the MS/MS mass range scanned was from 60 to 1800 m/z.
Proteomics data analysis
Proteomics data analysis was performed essentially as described in Whitehead et al. (2006). Briefly, MS/MS spectra peptide and protein assignment was achieved using SEQUEST and software within the Trans Proteomic Pipeline (TPP) package (Keller et al. 2005) to match spectra against the H. salinarum NRC-1 protein database digested in silico with trypsin (Ng et al. 2000). The static modifications given to SEQUEST for the iTRAQ reagents were an addition of 144.23 to the N terminus, an addition of 45.86 to cysteine, and an addition of 144.102 to lysine. In the assignment process, SEQUEST was allowed to use one missed cleavage. The script running SEQUEST constrained the MS/MS identifications to those spectra with at least five peaks and having a peptide mass between 600 and 4200 Da. Additionally, the region of the spectrum containing the iTRAQ peaks was not passed to SEQUEST for assignment. Subsequent peptide and protein-relative quantitation and error estimation was conducted using the Libra algorithm within the TPP as previously described (Nesvizhskii et al. 2003; Keller et al. 2005; Nesvizhskii and Aebersold 2005; Whitehead et al. 2006) (Supplemental Methods). The data for the 10 iTRAQ sets were then merged and loaded into the Gaggle software package to facilitate data integration and visualization (Shannon et al. 2006; Whitehead et al. 2006). Codon adaptation indices were calculated with a web-based CAI calculator (http://www.evolvingcode.net/codon/cai/cais.php) using the halobacterial codon usage table based on ribosomal protein codons. Similar results were obtained using alternative codon usage tables for H. salinarum NRC-1 (Puigbo et al. 2007; Supplemental material).
Integrated statistical systems analysis of proteomic and microarray data
The time-lagged correlation profiles (TLCPs) between mRNA and protein time-series responses for each gene or operon are a series of Pearson correlations computed between time-shifted protein measurements and the corresponding interpolated time points from the mRNA measurements. The mRNA profiles, rather than protein profiles, were chosen for interpolation because they were, in general, less noisy and had no missing values. We used cross-validated cubic spline interpolation (Berloff et al. 2002) for the final analysis, although we found that the significant results described in this report were independent of the interpolation method chosen. TLCPs were computed only for genes that had nine or more protein-level observations. Resultant TLCPs (correlation as a function of protein time lag) were computed for time lags between −5 and +40 min. Peak time-lagged correlations (PTLCs) for each gene were assessed, and the corresponding time lag, Δt, was identified.
To validate and assess the significance of the observed PTLC for each gene, we performed two permutation tests, in which the TLC analysis was performed on data that were randomized by: (1) permuting the rows of the mRNA data matrix such that each gene's protein profile is compared with the mRNA profile for a different, randomly selected gene, but where the mRNA profile is correctly time-ordered (hereafter, the “shuffle” test); and (2) randomizing all values in the mRNA data matrix so that the protein profile is compared against randomly ordered mRNA data that contains the same variance structure as the original mRNA data matrix (hereafter, the “scramble” test). Each permutation test was repeated 100 times for each gene (Fig. 5C) to obtain P-values that measure the significance of each gene's TLC profile as a function of time lag, Δt. The gene's reported time lag Δt (and its significance) corresponds to the Δt that maximizes the TLC profile. Thus, two sets of P-values are computed for each gene: one (more conservative) P-value based upon the shuffle permutation test and one based on the scramble test. For genes with fewer than nine time point detections in the protein data, time lags were computed for operons in a similar fashion to the gene analysis. Briefly, both mRNA and protein profiles for all genes in the operon were combined and interpolated, and PTLC and randomization tests were conducted. Operon associations were calculated as described above (see Microarray Data Analysis section).
We computed an aggregate, global time-lag profile by counting the total fraction of occurrences, whereby each gene obtained a TLC better than each of its 100 permutation-test-based TLCs (Fig. 5D). Because these fractions are based upon 100 permutation tests over ∼500 genes, they represent a total of >5000 permutated TLC profile calculations. In order to estimate the significance of the difference in observed fractions at each time lag Δti versus that at Δt = 0 (Fig. 5D), we counted the frequency at which 100,000 bootstrap samples of pairs of TLCs at Δti were less than those at Δt = 0. The results of these bootstraps for each time lag are shown in Figure 5E.
Acknowledgments
We thank Marc T. Facciotti and Kenia Whitehead for their ideas, support, and critical reading of the manuscript at all stages. We thank Vesteinn Thorsson for enlightening discussions on the time-lagging model and Paul Shannon and Christopher Bare for their expert Gaggle and Cytoscape software support throughout this project. This work was funded by grants from DOE (DE-FG02-04ER63807 and DE-AC02-05CH11231), NSF (EF-0313754), NASA (NNG05GN58G), and NIH (P50 GM076547) to N.S.B., and a postdoctoral fellowship to A.K.S. from NIH (5F32GM078980-02).
Footnotes
[Supplemental material is available online at www.genome.org. The microarray data from this study have been submitted to GEO under accession nos. GSE7559 and GSE5929.]
Article published online before print. Article and publication date are at http://www.genome.org/cgi/doi/10.1101/gr.6728007
References
- Andersson S.G., Buckingham R.H., Kurland C.G., Buckingham R.H., Kurland C.G., Kurland C.G. Does codon composition influence ribosome function? EMBO J. 1984;3:91–94. doi: 10.1002/j.1460-2075.1984.tb01766.x. [DOI] [PMC free article] [PubMed] [Google Scholar]
- Ashburner M., Ball C.A., Blake J.A., Botstein D., Butler H., Cherry J.M., Davis A.P., Dolinski K., Dwight S.S., Eppig J.T., Ball C.A., Blake J.A., Botstein D., Butler H., Cherry J.M., Davis A.P., Dolinski K., Dwight S.S., Eppig J.T., Blake J.A., Botstein D., Butler H., Cherry J.M., Davis A.P., Dolinski K., Dwight S.S., Eppig J.T., Botstein D., Butler H., Cherry J.M., Davis A.P., Dolinski K., Dwight S.S., Eppig J.T., Butler H., Cherry J.M., Davis A.P., Dolinski K., Dwight S.S., Eppig J.T., Cherry J.M., Davis A.P., Dolinski K., Dwight S.S., Eppig J.T., Davis A.P., Dolinski K., Dwight S.S., Eppig J.T., Dolinski K., Dwight S.S., Eppig J.T., Dwight S.S., Eppig J.T., Eppig J.T., et al. Gene Ontology: Tool for the unification of biology. The Gene Ontology Consortium. Nat. Genet. 2000;25:25–29. doi: 10.1038/75556. [DOI] [PMC free article] [PubMed] [Google Scholar]
- Baliga N.S., Pan M., Goo Y.A., Yi E.C., Goodlett D.R., Dimitrov K., Shannon P., Aebersold R., Ng W.V., Hood L., Pan M., Goo Y.A., Yi E.C., Goodlett D.R., Dimitrov K., Shannon P., Aebersold R., Ng W.V., Hood L., Goo Y.A., Yi E.C., Goodlett D.R., Dimitrov K., Shannon P., Aebersold R., Ng W.V., Hood L., Yi E.C., Goodlett D.R., Dimitrov K., Shannon P., Aebersold R., Ng W.V., Hood L., Goodlett D.R., Dimitrov K., Shannon P., Aebersold R., Ng W.V., Hood L., Dimitrov K., Shannon P., Aebersold R., Ng W.V., Hood L., Shannon P., Aebersold R., Ng W.V., Hood L., Aebersold R., Ng W.V., Hood L., Ng W.V., Hood L., Hood L. Coordinate regulation of energy transduction modules in Halobacterium sp. analyzed by a global systems approach. Proc. Natl. Acad. Sci. 2002;99:14913–14918. doi: 10.1073/pnas.192558999. [DOI] [PMC free article] [PubMed] [Google Scholar]
- Baliga N.S., Bjork S.J., Bonneau R., Pan M., Iloanusi C., Kottemann M.C., Hood L., DiRuggiero J., Bjork S.J., Bonneau R., Pan M., Iloanusi C., Kottemann M.C., Hood L., DiRuggiero J., Bonneau R., Pan M., Iloanusi C., Kottemann M.C., Hood L., DiRuggiero J., Pan M., Iloanusi C., Kottemann M.C., Hood L., DiRuggiero J., Iloanusi C., Kottemann M.C., Hood L., DiRuggiero J., Kottemann M.C., Hood L., DiRuggiero J., Hood L., DiRuggiero J., DiRuggiero J. Systems level insights into the stress response to UV radiation in the halophilic archaeon Halobacterium NRC-1. Genome Res. 2004;14:1025–1035. doi: 10.1101/gr.1993504. [DOI] [PMC free article] [PubMed] [Google Scholar]
- Berloff N., Perola M., Lange K., Perola M., Lange K., Lange K. Spline methods for the comparison of physical and genetic maps. J. Comput. Biol. 2002;9:465–475. doi: 10.1089/106652702760138565. [DOI] [PubMed] [Google Scholar]
- Berman H.M., Westbrook J., Feng Z., Gilliland G., Bhat T.N., Weissig H., Shindyalov I.N., Bourne P.E., Westbrook J., Feng Z., Gilliland G., Bhat T.N., Weissig H., Shindyalov I.N., Bourne P.E., Feng Z., Gilliland G., Bhat T.N., Weissig H., Shindyalov I.N., Bourne P.E., Gilliland G., Bhat T.N., Weissig H., Shindyalov I.N., Bourne P.E., Bhat T.N., Weissig H., Shindyalov I.N., Bourne P.E., Weissig H., Shindyalov I.N., Bourne P.E., Shindyalov I.N., Bourne P.E., Bourne P.E. The Protein Data Bank. Nucleic Acids Res. 2000;28:235–242. doi: 10.1093/nar/28.1.235. [DOI] [PMC free article] [PubMed] [Google Scholar]
- Bernstein J.A., Khodursky A.B., Lin P.H., Lin-Chao S., Cohen S.N., Khodursky A.B., Lin P.H., Lin-Chao S., Cohen S.N., Lin P.H., Lin-Chao S., Cohen S.N., Lin-Chao S., Cohen S.N., Cohen S.N. Global analysis of mRNA decay and abundance in Escherichia coli at single-gene resolution using two-color fluorescent DNA microarrays. Proc. Natl. Acad. Sci. 2002;99:9697–9702. doi: 10.1073/pnas.112318199. [DOI] [PMC free article] [PubMed] [Google Scholar]
- Beyer A., Hollunder J., Nasheuer H.P., Wilhelm T., Hollunder J., Nasheuer H.P., Wilhelm T., Nasheuer H.P., Wilhelm T., Wilhelm T. Post-transcriptional expression regulation in the yeast Saccharomyces cerevisiae on a genomic scale. Mol. Cell. Proteomics. 2004;3:1083–1092. doi: 10.1074/mcp.M400099-MCP200. [DOI] [PubMed] [Google Scholar]
- Bonneau R., Baliga N.S., Deutsch E.W., Shannon P., Hood L., Baliga N.S., Deutsch E.W., Shannon P., Hood L., Deutsch E.W., Shannon P., Hood L., Shannon P., Hood L., Hood L. Comprehensive de novo structure prediction in a systems-biology context for the archaea Halobacterium sp. NRC-1. Genome Biol. 2004;5:R52. doi: 10.1186/gb-2004-5-8-r52. [DOI] [PMC free article] [PubMed] [Google Scholar]
- Bonneau R., Reiss D.J., Shannon P., Facciotti M., Hood L., Baliga N.S., Thorsson V., Reiss D.J., Shannon P., Facciotti M., Hood L., Baliga N.S., Thorsson V., Shannon P., Facciotti M., Hood L., Baliga N.S., Thorsson V., Facciotti M., Hood L., Baliga N.S., Thorsson V., Hood L., Baliga N.S., Thorsson V., Baliga N.S., Thorsson V., Thorsson V. The Inferelator: An algorithm for learning parsimonious regulatory networks from systems-biology data sets de novo. Genome Biol. 2006;7:R36. doi: 10.1186/gb-2006-7-5-r36. [DOI] [PMC free article] [PubMed] [Google Scholar]
- Borriello G., Werner E., Roe F., Kim A.M., Ehrlich G.D., Stewart P.S., Werner E., Roe F., Kim A.M., Ehrlich G.D., Stewart P.S., Roe F., Kim A.M., Ehrlich G.D., Stewart P.S., Kim A.M., Ehrlich G.D., Stewart P.S., Ehrlich G.D., Stewart P.S., Stewart P.S. Oxygen limitation contributes to antibiotic tolerance of Pseudomonas aeruginosa in biofilms. Antimicrob. Agents Chemother. 2004;48:2659–2664. doi: 10.1128/AAC.48.7.2659-2664.2004. [DOI] [PMC free article] [PubMed] [Google Scholar]
- Branco-Price C., Kawaguchi R., Ferreira R.B., Bailey-Serres J., Kawaguchi R., Ferreira R.B., Bailey-Serres J., Ferreira R.B., Bailey-Serres J., Bailey-Serres J. Genome-wide analysis of transcript abundance and translation in Arabidopsis seedlings subjected to oxygen deprivation. Ann. Bot. (Lond.) 2005;96:647–660. doi: 10.1093/aob/mci217. [DOI] [PMC free article] [PubMed] [Google Scholar]
- Brauer M.J., Yuan J., Bennett B.D., Lu W., Kimball E., Botstein D., Rabinowitz J.D., Yuan J., Bennett B.D., Lu W., Kimball E., Botstein D., Rabinowitz J.D., Bennett B.D., Lu W., Kimball E., Botstein D., Rabinowitz J.D., Lu W., Kimball E., Botstein D., Rabinowitz J.D., Kimball E., Botstein D., Rabinowitz J.D., Botstein D., Rabinowitz J.D., Rabinowitz J.D. Conservation of the metabolomic response to starvation across two divergent microbes. Proc. Natl. Acad. Sci. 2006;103:19302–19307. doi: 10.1073/pnas.0609508103. [DOI] [PMC free article] [PubMed] [Google Scholar]
- Brockmann R., Beyer A., Heinisch J.J., Wilhelm T., Beyer A., Heinisch J.J., Wilhelm T., Heinisch J.J., Wilhelm T., Wilhelm T. Posttranscriptional expression regulation: What determines translation rates? PLoS Comput. Biol. 2007;3:e57. doi: 10.1371/journal.pcbi.0030057. [DOI] [PMC free article] [PubMed] [Google Scholar]
- Cox B., Kislinger T., Wigle D.A., Kannan A., Brown K., Okubo T., Hogan B., Jurisica I., Frey B., Rossant J., Kislinger T., Wigle D.A., Kannan A., Brown K., Okubo T., Hogan B., Jurisica I., Frey B., Rossant J., Wigle D.A., Kannan A., Brown K., Okubo T., Hogan B., Jurisica I., Frey B., Rossant J., Kannan A., Brown K., Okubo T., Hogan B., Jurisica I., Frey B., Rossant J., Brown K., Okubo T., Hogan B., Jurisica I., Frey B., Rossant J., Okubo T., Hogan B., Jurisica I., Frey B., Rossant J., Hogan B., Jurisica I., Frey B., Rossant J., Jurisica I., Frey B., Rossant J., Frey B., Rossant J., Rossant J., et al. Integrated proteomic and transcriptomic profiling of mouse lung development and Nmyc target genes. Mol. Syst. Biol. 2007;3:109. doi: 10.1038/msb4100151. [DOI] [PMC free article] [PubMed] [Google Scholar]
- Farrish E.E., Baker H.V., Wolf R.E., Baker H.V., Wolf R.E., Wolf R.E. Different control circuits for growth rate-dependent regulation of 6-phosphogluconate dehydrogenase and protein components of the translational machinery in Escherichia coli. J. Bacteriol. 1982;152:584–594. doi: 10.1128/jb.152.2.584-594.1982. [DOI] [PMC free article] [PubMed] [Google Scholar]
- Finn R.D., Mistry J., Schuster-Bockler B., Griffiths-Jones S., Hollich V., Lassmann T., Moxon S., Marshall M., Khanna A., Durbin R., Mistry J., Schuster-Bockler B., Griffiths-Jones S., Hollich V., Lassmann T., Moxon S., Marshall M., Khanna A., Durbin R., Schuster-Bockler B., Griffiths-Jones S., Hollich V., Lassmann T., Moxon S., Marshall M., Khanna A., Durbin R., Griffiths-Jones S., Hollich V., Lassmann T., Moxon S., Marshall M., Khanna A., Durbin R., Hollich V., Lassmann T., Moxon S., Marshall M., Khanna A., Durbin R., Lassmann T., Moxon S., Marshall M., Khanna A., Durbin R., Moxon S., Marshall M., Khanna A., Durbin R., Marshall M., Khanna A., Durbin R., Khanna A., Durbin R., Durbin R., et al. Pfam: Clans, web tools and services. Nucleic Acids Res. 2006;34:D247–D251. doi: 10.1093/nar/gk149. [DOI] [PMC free article] [PubMed] [Google Scholar]
- Georgellis D., Barlow T., Arvidson S., von Gabain A., Barlow T., Arvidson S., von Gabain A., Arvidson S., von Gabain A., von Gabain A. Retarded RNA turnover in Escherichia coli: A means of maintaining gene expression during anaerobiosis. Mol. Microbiol. 1993;9:375–381. doi: 10.1111/j.1365-2958.1993.tb01698.x. [DOI] [PubMed] [Google Scholar]
- Griffin T.J., Gygi S.P., Ideker T., Rist B., Eng J., Hood L., Aebersold R., Gygi S.P., Ideker T., Rist B., Eng J., Hood L., Aebersold R., Ideker T., Rist B., Eng J., Hood L., Aebersold R., Rist B., Eng J., Hood L., Aebersold R., Eng J., Hood L., Aebersold R., Hood L., Aebersold R., Aebersold R. Complementary profiling of gene expression at the transcriptome and proteome levels in Saccharomyces cerevisiae. Mol. Cell. Proteomics. 2002;1:323–333. doi: 10.1074/mcp.m200001-mcp200. [DOI] [PubMed] [Google Scholar]
- Gropp F., Betlach M.C., Betlach M.C. The bat gene of Halobacterium halobium encodes a trans-acting oxygen inducibility factor. Proc. Natl. Acad. Sci. 1994;91:5475–5479. doi: 10.1073/pnas.91.12.5475. [DOI] [PMC free article] [PubMed] [Google Scholar]
- Gygi S.P., Rochon Y., Franza B.R., Aebersold R., Rochon Y., Franza B.R., Aebersold R., Franza B.R., Aebersold R., Aebersold R. Correlation between protein and mRNA abundance in yeast. Mol. Cell. Biol. 1999;19:1720–1730. doi: 10.1128/mcb.19.3.1720. [DOI] [PMC free article] [PubMed] [Google Scholar]
- Hambraeus G., von Wachenfeldt C., Hederstedt L., von Wachenfeldt C., Hederstedt L., Hederstedt L. Genome-wide survey of mRNA half-lives in Bacillus subtilis identifies extremely stable mRNAs. Mol. Genet. Genomics. 2003;269:706–714. doi: 10.1007/s00438-003-0883-6. [DOI] [PubMed] [Google Scholar]
- Hartmann R., Sickinger H.D., Oesterhelt D., Sickinger H.D., Oesterhelt D., Oesterhelt D. Anaerobic growth of halobacteria. Proc. Natl. Acad. Sci. 1980;77:3821–3825. doi: 10.1073/pnas.77.7.3821. [DOI] [PMC free article] [PubMed] [Google Scholar]
- Hochachka P.W., Buck L.T., Doll C.J., Land S.C., Buck L.T., Doll C.J., Land S.C., Doll C.J., Land S.C., Land S.C. Unifying theory of hypoxia tolerance: Molecular/metabolic defense and rescue mechanisms for surviving oxygen lack. Proc. Natl. Acad. Sci. 1996;93:9493–9498. doi: 10.1073/pnas.93.18.9493. [DOI] [PMC free article] [PubMed] [Google Scholar]
- Ideker T., Thorsson V., Siegel A.F., Hood L.E., Thorsson V., Siegel A.F., Hood L.E., Siegel A.F., Hood L.E., Hood L.E. Testing for differentially-expressed genes by maximum-likelihood analysis of microarray data. J. Comput. Biol. 2000;7:805–817. doi: 10.1089/10665270050514945. [DOI] [PubMed] [Google Scholar]
- Ideker T., Thorsson V., Ranish J.A., Christmas R., Buhler J., Eng J.K., Bumgarner R., Goodlett D.R., Aebersold R., Hood L., Thorsson V., Ranish J.A., Christmas R., Buhler J., Eng J.K., Bumgarner R., Goodlett D.R., Aebersold R., Hood L., Ranish J.A., Christmas R., Buhler J., Eng J.K., Bumgarner R., Goodlett D.R., Aebersold R., Hood L., Christmas R., Buhler J., Eng J.K., Bumgarner R., Goodlett D.R., Aebersold R., Hood L., Buhler J., Eng J.K., Bumgarner R., Goodlett D.R., Aebersold R., Hood L., Eng J.K., Bumgarner R., Goodlett D.R., Aebersold R., Hood L., Bumgarner R., Goodlett D.R., Aebersold R., Hood L., Goodlett D.R., Aebersold R., Hood L., Aebersold R., Hood L., Hood L. Integrated genomic and proteomic analyses of a systematically perturbed metabolic network. Science. 2001;292:929–934. doi: 10.1126/science.292.5518.929. [DOI] [PubMed] [Google Scholar]
- Imlay J.A. How oxygen damages microbes: Oxygen tolerance and obligate anaerobiosis. Adv. Microb. Physiol. 2002;46:111–153. doi: 10.1016/s0065-2911(02)46003-1. [DOI] [PubMed] [Google Scholar]
- Kanehisa M. A database for post-genome analysis. Trends Genet. 1997;13:375–376. doi: 10.1016/s0168-9525(97)01223-7. [DOI] [PubMed] [Google Scholar]
- Kanehisa M., Goto S., Goto S. KEGG: Kyoto encyclopedia of genes and genomes. Nucleic Acids Res. 2000;28:27–30. doi: 10.1093/nar/28.1.27. [DOI] [PMC free article] [PubMed] [Google Scholar]
- Kanehisa M., Goto S., Hattori M., Aoki-Kinoshita K.F., Itoh M., Kawashima S., Katayama T., Araki M., Hirakawa M., Goto S., Hattori M., Aoki-Kinoshita K.F., Itoh M., Kawashima S., Katayama T., Araki M., Hirakawa M., Hattori M., Aoki-Kinoshita K.F., Itoh M., Kawashima S., Katayama T., Araki M., Hirakawa M., Aoki-Kinoshita K.F., Itoh M., Kawashima S., Katayama T., Araki M., Hirakawa M., Itoh M., Kawashima S., Katayama T., Araki M., Hirakawa M., Kawashima S., Katayama T., Araki M., Hirakawa M., Katayama T., Araki M., Hirakawa M., Araki M., Hirakawa M., Hirakawa M. From genomics to chemical genomics: New developments in KEGG. Nucleic Acids Res. 2006;34:D354–D357. doi: 10.1093/nar/gkj102. [DOI] [PMC free article] [PubMed] [Google Scholar]
- Kaur A., Pan M., Meislin M., Facciotti M.T., El-Gewely R., Baliga N.S., Pan M., Meislin M., Facciotti M.T., El-Gewely R., Baliga N.S., Meislin M., Facciotti M.T., El-Gewely R., Baliga N.S., Facciotti M.T., El-Gewely R., Baliga N.S., El-Gewely R., Baliga N.S., Baliga N.S. A systems view of haloarchaeal strategies to withstand stress from transition metals. Genome Res. 2006;16:841–854. doi: 10.1101/gr.5189606. [DOI] [PMC free article] [PubMed] [Google Scholar]
- Keller A., Eng J., Zhang N., Li X.J., Aebersold R., Eng J., Zhang N., Li X.J., Aebersold R., Zhang N., Li X.J., Aebersold R., Li X.J., Aebersold R., Aebersold R.2005A uniform proteomics MS/MS analysis platform utilizing open XML file formats Mol. Syst. Biol .1 10.1038/msb4100024 [DOI] [PMC free article] [PubMed] [Google Scholar]
- Kislinger T., Gramolini A.O., Pan Y., Rahman K., MacLennan D.H., Emili A., Gramolini A.O., Pan Y., Rahman K., MacLennan D.H., Emili A., Pan Y., Rahman K., MacLennan D.H., Emili A., Rahman K., MacLennan D.H., Emili A., MacLennan D.H., Emili A., Emili A. Proteome dynamics during C2C12 myoblast differentiation. Mol. Cell. Proteomics. 2005;4:887–901. doi: 10.1074/mcp.M400182-MCP200. [DOI] [PubMed] [Google Scholar]
- Kolkman A., Daran-Lapujade P., Fullaondo A., Olsthoorn M.M., Pronk J.T., Slijper M., Heck A.J., Daran-Lapujade P., Fullaondo A., Olsthoorn M.M., Pronk J.T., Slijper M., Heck A.J., Fullaondo A., Olsthoorn M.M., Pronk J.T., Slijper M., Heck A.J., Olsthoorn M.M., Pronk J.T., Slijper M., Heck A.J., Pronk J.T., Slijper M., Heck A.J., Slijper M., Heck A.J., Heck A.J. Proteome analysis of yeast response to various nutrient limitations. Mol. Syst. Biol. 2006;2 doi: 10.1038/4100069. [DOI] [PMC free article] [PubMed] [Google Scholar]
- Kuzj A.E., Medberry P.S., Schottel J.L., Medberry P.S., Schottel J.L., Schottel J.L. Stationary phase, amino acid limitation and recovery from stationary phase modulate the stability and translation of chloramphenicol acetyltransferase mRNA and total mRNA in Escherichia coli. Microbiology. 1998;144:739–750. doi: 10.1099/00221287-144-3-739. [DOI] [PubMed] [Google Scholar]
- Lander E.S. Array of hope. Nat. Genet. 1999;21:3–4. doi: 10.1038/4427. [DOI] [PubMed] [Google Scholar]
- Lipton M.S., Pasa-Tolic L., Anderson G.A., Anderson D.J., Auberry D.L., Battista J.R., Daly M.J., Fredrickson J., Hixson K.K., Kostandarithes H., Pasa-Tolic L., Anderson G.A., Anderson D.J., Auberry D.L., Battista J.R., Daly M.J., Fredrickson J., Hixson K.K., Kostandarithes H., Anderson G.A., Anderson D.J., Auberry D.L., Battista J.R., Daly M.J., Fredrickson J., Hixson K.K., Kostandarithes H., Anderson D.J., Auberry D.L., Battista J.R., Daly M.J., Fredrickson J., Hixson K.K., Kostandarithes H., Auberry D.L., Battista J.R., Daly M.J., Fredrickson J., Hixson K.K., Kostandarithes H., Battista J.R., Daly M.J., Fredrickson J., Hixson K.K., Kostandarithes H., Daly M.J., Fredrickson J., Hixson K.K., Kostandarithes H., Fredrickson J., Hixson K.K., Kostandarithes H., Hixson K.K., Kostandarithes H., Kostandarithes H., et al. Global analysis of the Deinococcus radiodurans proteome by using accurate mass tags. Proc. Natl. Acad. Sci. 2002;99:11049–11054. doi: 10.1073/pnas.172170199. [DOI] [PMC free article] [PubMed] [Google Scholar]
- Liu L., Simon M.C., Simon M.C. Regulation of transcription and translation by hypoxia. Cancer Biol. Ther. 2004;3:492–497. doi: 10.4161/cbt.3.6.1010. [DOI] [PubMed] [Google Scholar]
- Marzolf B., Deutsch E.W., Moss P., Campbell D., Johnson M.H., Galitski T., Deutsch E.W., Moss P., Campbell D., Johnson M.H., Galitski T., Moss P., Campbell D., Johnson M.H., Galitski T., Campbell D., Johnson M.H., Galitski T., Johnson M.H., Galitski T., Galitski T. SBEAMS-Microarray: Database software supporting genomic expression analyses for systems biology. BMC Bioinformatics. 2006;7:286. doi: 10.1186/1471-2105-7-286. [DOI] [PMC free article] [PubMed] [Google Scholar]
- Molloy M.P., Donohoe S., Brzezinsky E.E., Kilby G.W., Stevenson T.I., Baker J.D., Goodlett D.R., Gage D.A., Donohoe S., Brzezinsky E.E., Kilby G.W., Stevenson T.I., Baker J.D., Goodlett D.R., Gage D.A., Brzezinsky E.E., Kilby G.W., Stevenson T.I., Baker J.D., Goodlett D.R., Gage D.A., Kilby G.W., Stevenson T.I., Baker J.D., Goodlett D.R., Gage D.A., Stevenson T.I., Baker J.D., Goodlett D.R., Gage D.A., Baker J.D., Goodlett D.R., Gage D.A., Goodlett D.R., Gage D.A., Gage D.A. Large scale evaluation of quantitative reproducibility and proteome coverage using acid cleavable isotope coded affinity tag mass spectrometry for proteomic profiling. Proteomics. 2005;5:1204–1208. doi: 10.1002/pmic.200400994. [DOI] [PubMed] [Google Scholar]
- Moreno-Hagelsieb G., Collado-Vides J., Collado-Vides J. A powerful non-homology method for the prediction of operons in prokaryotes. Bioinformatics. 2002;18:S329–S336. doi: 10.1093/bioinformatics/18.suppl_1.S329. [DOI] [PubMed] [Google Scholar]
- Muller J.A., DasSarma S., DasSarma S. Genomic analysis of anaerobic respiration in the archaeon Halobacterium sp. strain NRC-1: Dimethyl sulfoxide and trimethylamine N-oxide as terminal electron acceptors. J. Bacteriol. 2005;187:1659–1667. doi: 10.1128/JB.187.5.1659-1667.2005. [DOI] [PMC free article] [PubMed] [Google Scholar]
- Nakano M.M., Zuber P., Zuber P. Anaerobic growth of a “strict aerobe” (Bacillus subtilis) Annu. Rev. Microbiol. 1998;52:165–190. doi: 10.1146/annurev.micro.52.1.165. [DOI] [PubMed] [Google Scholar]
- Nesvizhskii A.I., Aebersold R., Aebersold R. Interpretation of shotgun proteomic data: The protein inference problem. Mol. Cell. Proteomics. 2005;4:1419–1440. doi: 10.1074/mcp.R500012-MCP200. [DOI] [PubMed] [Google Scholar]
- Nesvizhskii A.I., Keller A., Kolker E., Aebersold R., Keller A., Kolker E., Aebersold R., Kolker E., Aebersold R., Aebersold R. A statistical model for identifying proteins by tandem mass spectrometry. Anal. Chem. 2003;75:4646–4658. doi: 10.1021/ac0341261. [DOI] [PubMed] [Google Scholar]
- Newman J.R., Ghaemmaghami S., Ihmels J., Breslow D.K., Noble M., DeRisi J.L., Weissman J.S., Ghaemmaghami S., Ihmels J., Breslow D.K., Noble M., DeRisi J.L., Weissman J.S., Ihmels J., Breslow D.K., Noble M., DeRisi J.L., Weissman J.S., Breslow D.K., Noble M., DeRisi J.L., Weissman J.S., Noble M., DeRisi J.L., Weissman J.S., DeRisi J.L., Weissman J.S., Weissman J.S. Single-cell proteomic analysis of S. cerevisiae reveals the architecture of biological noise. Nature. 2006;441:840–846. doi: 10.1038/nature04785. [DOI] [PubMed] [Google Scholar]
- Ng W.V., Kennedy S.P., Mahairas G.G., Berquist B., Pan M., Shukla H.D., Lasky S.R., Baliga N.S., Thorsson V., Sbrogna J., Kennedy S.P., Mahairas G.G., Berquist B., Pan M., Shukla H.D., Lasky S.R., Baliga N.S., Thorsson V., Sbrogna J., Mahairas G.G., Berquist B., Pan M., Shukla H.D., Lasky S.R., Baliga N.S., Thorsson V., Sbrogna J., Berquist B., Pan M., Shukla H.D., Lasky S.R., Baliga N.S., Thorsson V., Sbrogna J., Pan M., Shukla H.D., Lasky S.R., Baliga N.S., Thorsson V., Sbrogna J., Shukla H.D., Lasky S.R., Baliga N.S., Thorsson V., Sbrogna J., Lasky S.R., Baliga N.S., Thorsson V., Sbrogna J., Baliga N.S., Thorsson V., Sbrogna J., Thorsson V., Sbrogna J., Sbrogna J., et al. Genome sequence of Halobacterium species NRC-1. Proc. Natl. Acad. Sci. 2000;97:12176–12181. doi: 10.1073/pnas.190337797. [DOI] [PMC free article] [PubMed] [Google Scholar]
- Oesterhelt D., Krippahl G., Krippahl G. Phototrophic growth of halobacteria and its use for isolation of photosynthetically-deficient mutants. Ann. Microbiol. (Paris) 1983;134B:137–150. doi: 10.1016/s0769-2609(83)80101-x. [DOI] [PubMed] [Google Scholar]
- Pang H., Winkler H.H., Winkler H.H. The concentrations of stable RNA and ribosomes in Rickettsia prowazekii. Mol. Microbiol. 1994;12:115–120. doi: 10.1111/j.1365-2958.1994.tb01000.x. [DOI] [PubMed] [Google Scholar]
- Partridge J.D., Scott C., Tang Y., Poole R.K., Green J., Scott C., Tang Y., Poole R.K., Green J., Tang Y., Poole R.K., Green J., Poole R.K., Green J., Green J. Escherichia coli transcriptome dynamics during the transition from anaerobic to aerobic conditions. J. Biol. Chem. 2006;281:27806–27815. doi: 10.1074/jbc.M603450200. [DOI] [PubMed] [Google Scholar]
- Partridge J.D., Sanguinetti G., Dibden D.P., Roberts R.E., Poole R.K., Green J., Sanguinetti G., Dibden D.P., Roberts R.E., Poole R.K., Green J., Dibden D.P., Roberts R.E., Poole R.K., Green J., Roberts R.E., Poole R.K., Green J., Poole R.K., Green J., Green J. Transition of Escherichia coli from aerobic to micro-aerobic conditions involves fast and slow reacting regulatory components. J. Biol. Chem. 2007;282:11230–11237. doi: 10.1074/jbc.M700728200. [DOI] [PubMed] [Google Scholar]
- Puigbo P., Guzman E., Romeu A., Garcia-Vallve S., Guzman E., Romeu A., Garcia-Vallve S., Romeu A., Garcia-Vallve S., Garcia-Vallve S. OPTIMIZER: A web server for optimizing the codon usage of DNA sequences. Nucleic Acids Res. 2007;35 (Suppl. 2):W126–W131. doi: 10.1093/nar/gkm219. [DOI] [PMC free article] [PubMed] [Google Scholar]
- Redon E., Loubiere P., Cocaign-Bousquet M., Loubiere P., Cocaign-Bousquet M., Cocaign-Bousquet M. Transcriptome analysis of the progressive adaptation of Lactococcus lactis to carbon starvation. J. Bacteriol. 2005;187:3589–3592. doi: 10.1128/JB.187.10.3589-3592.2005. [DOI] [PMC free article] [PubMed] [Google Scholar]
- Reiss D.J., Baliga N.S., Bonneau R., Baliga N.S., Bonneau R., Bonneau R. Integrated biclustering of heterogeneous genome-wide datasets for the inference of global regulatory networks. BMC Bioinformatics. 2006;7:280. doi: 10.1186/1471-2105-7-280. [DOI] [PMC free article] [PubMed] [Google Scholar]
- Robb F.T., Place A.R., Sowers K.R., Schreier H.J., DasSarma S., Fleischmann E.M., Place A.R., Sowers K.R., Schreier H.J., DasSarma S., Fleischmann E.M., Sowers K.R., Schreier H.J., DasSarma S., Fleischmann E.M., Schreier H.J., DasSarma S., Fleischmann E.M., DasSarma S., Fleischmann E.M., Fleischmann E.M. Archaea: A laboratory manual. Cold Spring Harbor Laboratory Press; Cold Spring Harbor, New York: 1995. [Google Scholar]
- Ross P.L., Huang Y.N., Marchese J.N., Williamson B., Parker K., Hattan S., Khainovski N., Pillai S., Dey S., Daniels S., Huang Y.N., Marchese J.N., Williamson B., Parker K., Hattan S., Khainovski N., Pillai S., Dey S., Daniels S., Marchese J.N., Williamson B., Parker K., Hattan S., Khainovski N., Pillai S., Dey S., Daniels S., Williamson B., Parker K., Hattan S., Khainovski N., Pillai S., Dey S., Daniels S., Parker K., Hattan S., Khainovski N., Pillai S., Dey S., Daniels S., Hattan S., Khainovski N., Pillai S., Dey S., Daniels S., Khainovski N., Pillai S., Dey S., Daniels S., Pillai S., Dey S., Daniels S., Dey S., Daniels S., Daniels S., et al. Multiplexed protein quantitation in Saccharomyces cerevisiae using amine-reactive isobaric tagging reagents. Mol. Cell. Proteomics. 2004;3:1154–1169. doi: 10.1074/mcp.M400129-MCP200. [DOI] [PubMed] [Google Scholar]
- Ruepp A., Soppa J., Soppa J. Fermentative arginine degradation in Halobacterium salinarium (formerly Halobacterium halobium): Genes, gene products, and transcripts of the arcRACB gene cluster. J. Bacteriol. 1996;178:4942–4947. doi: 10.1128/jb.178.16.4942-4947.1996. [DOI] [PMC free article] [PubMed] [Google Scholar]
- Shannon P.T., Reiss D.J., Bonneau R., Baliga N.S., Reiss D.J., Bonneau R., Baliga N.S., Bonneau R., Baliga N.S., Baliga N.S. The Gaggle: An open-source software system for integrating bioinformatics software and data sources. BMC Bioinformatics. 2006;7:176. doi: 10.1186/1471-2105-7-176. [DOI] [PMC free article] [PubMed] [Google Scholar]
- Sharp P.M., Li W.H., Li W.H. The codon Adaptation Index—A measure of directional synonymous codon usage bias, and its potential applications. Nucleic Acids Res. 1987;15:1281–1295. doi: 10.1093/nar/15.3.1281. [DOI] [PMC free article] [PubMed] [Google Scholar]
- Stensjo K., Ow S.Y., Barrios-Llerena M.E., Lindblad P., Wright P.C., Ow S.Y., Barrios-Llerena M.E., Lindblad P., Wright P.C., Barrios-Llerena M.E., Lindblad P., Wright P.C., Lindblad P., Wright P.C., Wright P.C. An iTRAQ-based quantitative analysis to elaborate the proteomic response of Nostoc sp. PCC 7120 under N2 fixing conditions. J. Proteome Res. 2007;6:621–635. doi: 10.1021/pr060517v. [DOI] [PubMed] [Google Scholar]
- Storz G., Altuvia S., Wassarman K.M., Altuvia S., Wassarman K.M., Wassarman K.M. An abundance of RNA regulators. Annu. Rev. Biochem. 2005;74:199–217. doi: 10.1146/annurev.biochem.74.082803.133136. [DOI] [PubMed] [Google Scholar]
- Takayama K., Kjelleberg S., Kjelleberg S. The role of RNA stability during bacterial stress responses and starvation. Environ. Microbiol. 2000;2:355–365. doi: 10.1046/j.1462-2920.2000.00119.x. [DOI] [PubMed] [Google Scholar]
- Tatusov R.L., Koonin E.V., Lipman D.J., Koonin E.V., Lipman D.J., Lipman D.J. A genomic perspective on protein families. Science. 1997;278:631–637. doi: 10.1126/science.278.5338.631. [DOI] [PubMed] [Google Scholar]
- Tatusov R.L., Fedorova N.D., Jackson J.D., Jacobs A.R., Kiryutin B., Koonin E.V., Krylov D.M., Mazumder R., Mekhedov S.L., Nikolskaya A.N., Fedorova N.D., Jackson J.D., Jacobs A.R., Kiryutin B., Koonin E.V., Krylov D.M., Mazumder R., Mekhedov S.L., Nikolskaya A.N., Jackson J.D., Jacobs A.R., Kiryutin B., Koonin E.V., Krylov D.M., Mazumder R., Mekhedov S.L., Nikolskaya A.N., Jacobs A.R., Kiryutin B., Koonin E.V., Krylov D.M., Mazumder R., Mekhedov S.L., Nikolskaya A.N., Kiryutin B., Koonin E.V., Krylov D.M., Mazumder R., Mekhedov S.L., Nikolskaya A.N., Koonin E.V., Krylov D.M., Mazumder R., Mekhedov S.L., Nikolskaya A.N., Krylov D.M., Mazumder R., Mekhedov S.L., Nikolskaya A.N., Mazumder R., Mekhedov S.L., Nikolskaya A.N., Mekhedov S.L., Nikolskaya A.N., Nikolskaya A.N., et al. The COG database: An updated version includes eukaryotes. BMC Bioinformatics. 2003;4:41. doi: 10.1186/1471-2105-4-41. [DOI] [PMC free article] [PubMed] [Google Scholar]
- Warner J.R. Synthesis of ribosomes in Saccharomyces cerevisiae. Microbiol. Rev. 1989;53:256–271. doi: 10.1128/mr.53.2.256-271.1989. [DOI] [PMC free article] [PubMed] [Google Scholar]
- Whitehead K., Kish A., Pan M., Kaur A., Reiss D.J., King N., Hohmann L., Diruggiero J., Baliga N.S., Kish A., Pan M., Kaur A., Reiss D.J., King N., Hohmann L., Diruggiero J., Baliga N.S., Pan M., Kaur A., Reiss D.J., King N., Hohmann L., Diruggiero J., Baliga N.S., Kaur A., Reiss D.J., King N., Hohmann L., Diruggiero J., Baliga N.S., Reiss D.J., King N., Hohmann L., Diruggiero J., Baliga N.S., King N., Hohmann L., Diruggiero J., Baliga N.S., Hohmann L., Diruggiero J., Baliga N.S., Diruggiero J., Baliga N.S., Baliga N.S. An integrated systems approach for understanding cellular responses to gamma radiation. Mol. Syst. Biol. 2006;2:47. doi: 10.1038/msb4100091. [DOI] [PMC free article] [PubMed] [Google Scholar]
- Wu G., Culley D.E., Zhang W., Culley D.E., Zhang W., Zhang W. Predicted highly expressed genes in the genomes of Streptomyces coelicolor and Streptomyces avermitilis and the implications for their metabolism. Microbiology. 2005;151:2175–2187. doi: 10.1099/mic.0.27833-0. [DOI] [PubMed] [Google Scholar]
- Yildirim N., Mackey M.C., Mackey M.C. Feedback regulation in the lactose operon: A mathematical modeling study and comparison with experimental data. Biophys. J. 2003;84:2841–2851. doi: 10.1016/S0006-3495(03)70013-7. [DOI] [PMC free article] [PubMed] [Google Scholar]
- Yura T., Nakahigashi K., Nakahigashi K. Regulation of the heat-shock response. Curr. Opin. Microbiol. 1999;2:153–158. doi: 10.1016/S1369-5274(99)80027-7. [DOI] [PubMed] [Google Scholar]