Abstract
We describe three droplet sensing techniques: a digital electrode, an analog electrode, and a thermal method. All three techniques use a single layer of metal lines that is easy to microfabricate and an electronic signal can be produced using low DC voltages. While the electrode methods utilize changes in electrical conductivity when the air/liquid interface of the droplet passes over a pair of electrodes, the thermal method is based on convective heat loss from a locally heated region. For the electrode method, the analog technique is able to detect 25 nL droplets while the digital technique is capable of detecting droplets as small as 100 pL. For thermal sensing, temperature profiles in the range of 36 °C and higher were used. Finally, we have used the digital electrode method and an array of electrodes located at preset distances to automate the operation of a previously described microfluidic viscometer. The viscometer is completely controlled by a laptop computer, and the total time for operation including setup, calibration, sample addition and viscosity calculation is approximately 4 minutes.
Introduction
Microfluidic devices are increasingly being used to perform complex multiplexed reactions, measurements and assays for chemical and biological applications.1–6 A significant part in fully automating these devices is liquid detection techniques that can determine in real time the location and velocity of multiple streams inside microfluidic channels. Within an integrated device, liquid detection techniques may be used to locate sample and reagent aliquots, track the flow of liquid samples, and analyze the reacted and separated liquid products. In general, liquid detection techniques find applications in flow analysis, liquid dispensing and metering, micro-dialysis, sample pre-concentration, flow titration, chromatography, and capillary electrophoresis.
Liquid detection in microfluidics may be divided into the two broad categories of continuous liquid detection and discrete droplet sensing. Continuous liquid flow is widely used in microanalytical devices because the flow is easy to control using external electric and/or pressure fields.7–10 In continuous streams, liquid detectors can be used to track the advancing interface of a liquid column as it fills the device although further sensing is usually based on optically (visible, UV, or fluorescence) detecting the presence of a solute.11–14 Discrete droplets, which are used as tiny storage containers, mixers and miniaturized batch reactors for multiplexed “lab on a chip” applications 15–20 may also be sensed by detecting the solute. Additionally, since a droplet shares an interface with either air or another liquid at all times, the droplet may be sensed simply by detecting its advancing or receding interface. The ability to sense a liquid droplet by tracking an interface allows a variety of other non-optical detection techniques to be used that require minimal fabrication complexity and do not require derivatization of liquid sample.
Examples of liquid interface sensing methods that introduce minimal additional fabrication include droplet sensors that consist of metal lines. Gold, platinum and aluminium metal lines that are routinely used to build heaters and electrodes in microfabricated devices can also be used to build droplet sensors. One such technique is capacitive sensing that uses an inter-digitated array of metal electrodes to sense a drop based on the change of electrical capacitance between a gas and a liquid.21 Another method is temperature based sensing that uses a combination of metal resistive heaters and resistive temperature detectors to detect thermal capacitance changes.22 Finally, electrical conductance changes using on-chip metal electrodes is a third technique and is attractive due to its high sensitivity and fast response time provided electrolysis and other unwanted reactions are not allowed.23,24 A sensing method that exposes the droplet to minimal external thermal or electric field and does not interfere with the microanalysis system may then be used towards automating microanalytical devices.
As an example, we have developed and integrated drop sensors into a previously described viscometer to fully automate its operation.25 These sensors are used to electronically track the advancing interface of a moving liquid column as it fills a microfluidic channel. Additionally, another set of sensors aids in self-calibrating the viscometer by determining the static liquid/air interface of a trapped nanoliter droplet. These drop sensors are easy to fabricate, do not interfere with the viscosity measurements, are completely controlled using a computer and use a low DC electrical power input. The design, working principle and operational challenges of three different liquid drop-sensing techniques that operate by sensing changes in either electrical conductivity or temperature at the air/liquid interface are discussed.
Materials and methods
Fabrication and assembly
Glass (channel) microfabrication
The detailed procedure for fabricating channels in glass is outlined elsewhere.25 Briefly, a thin metal film (500 Å Cr/4000 Å Au) is deposited and patterned on annealed glass wafers (Dow Corning Pyrex 7740, 500 μm thick, 10 cm dia). The glass is then etched in hydrofluoric acid (49%) to the desired depth (etching rate ~ 7 μm min −1). Finally, the photoresist and metal layers are removed and the glass wafer is diced on a dicing saw to yield individual glass dies.
Silicon microfabrication
Electrodes, resistive heaters and temperature detectors (RTD) were fabricated on silicon using the lift-off process. Silicon wafer (<100>, 500 μm thick, 10 cm diameter) with 1 μm thick thermal oxide layer (University Wafers, South Boston, MA) was spin-coated with photoresist (Microposit SC 1827) at 3000 rpm, soft-baked at 90 °C for 5 min and exposed with a mask aligner. The wafer was then developed in MF 319 (Shipley) for 1.5 min followed with evaporating 500 Å Cr/4500 Å Au for electrodes or 300 Å Ti/1000 Å Pt for heaters and RTD. After lift-off in acetone for 5 h, the wafer was diced on a dicing saw to yield individual silicon dies. The silicon sides with the metal heaters and RTD were coated with a 2 μm thick layer of Parylene-C (PDS 1020 Labcoater, Speciality Coatings Systems, IN) before bonding it to the glass side.
Glass-silicon device assembly
A custom designed immersion gold printed circuit board (PCB, Advanced Circuits, Aurora, CO) serves as the platform for chip-to-world electrical connections. The diced silicon die is fixed to the PCB using a double stick tape. The gold contact pads on the silicon die are wire bonded (Kulicke & Soffa 4124 Ball Bonder) using 1.0 mil gold wire. After wire bonding, the glass die is visually aligned to the silicon side and UV curable optical glue (SK-9, 40 cP, Summers Optical, Fort Washington, PA) is wicked between glass and silicon through the edges. The device is cured in UV light (365 nm) for 6 hours.
Experimental method, set-up and operation
Data acquisition
The setup for automated portable measurement of viscosity consists of a DC power supply (hp 6234A, American Test Equipment, Ashland, VA), a data acquisition card (DAQCard™ -AI-16XE-50 -with CB-68 LP board, National Instruments, Austin, TX), a digital relay board (ER-16, National Instruments), a laptop computer (Macintosh, Apple Computer Inc) and LabVIEW™ control program (National Instruments). Edge connectors from the PCB connect each pair of on-chip electrodes in series with a 10 MΩ external resistor; one of the electrodes in each pair is grounded while the other is connected to the power supply. The voltage drop across the 10 MΩ resistor is fed to the LabVIEW™ VI using the analog input of the DAQ board. The scanning rate was 100,000 samples s−1 and averaging a sample of 1000 samples.
Feedback controlled digital relays
The power to the electrodes is supplied via a digital relay board (ER-16). The digital relays shut the power off selectively to a pair electrode as soon as the liquid interface passes over the electrodes. As a result a droplet of liquid will not experience the electric field for more than 0.1 s—the rate at which each pair of electrodes is scanned. All electrodes are 400 nm thick, 100 μm wide and electrodes in each pair are separated by 50 μm in the digital method and 100 μm in the analog method.
On-chip temperature control
On-chip resistance temperature detectors (RTDs) were calibrated by heating the device in an oven and recording the temperature–resistance data for the RTDs via LabVIEW™, using a MIO-PCI6031E board. The slope–intercept data were read into another LabVIEW™ VI that used a PI module to control temperature using an AO32-PCI6704 board.
Measurement of vL
To measure vL, a, 10 μL drop of liquid is placed at the inlet of an open channel (OC) and is spontaneously drawn in by capillary pressure. While the liquid is in motion, the length of the liquid column inside the channel, L, is monitored. The incremental increase in the length (ΔL) over short times (Δt) is used to calculate the velocity (i.e., v = ΔL/Δt). Using this data of L and v, the product νL is then calculated.
Measurement of capillary pressure Pcapillary
Pcapillary is measured inside a sealed chamber (SC) that has a single inlet and no outlet. A drop of liquid placed at the inlet of the SC is spontaneously drawn in by capillary action compressing the trapped air inside the chamber. The air pressure in the sealed chamber now exceeds the atmospheric pressure by an amount equal to the capillary pressure. Using the ideal gas law, we obtain:
| (1) |
where V1 is the original volume of air inside the chamber and V2 is the volume of the compressed air found from the location of the static liquid meniscus inside the chamber.
Results and discussion
Digital and analog sensing methods
To fully automate the operation of a microfluidic device there must be reliable sensing of liquid droplets that are loaded inside the device. Droplet location and/or volume sensors that use liquid/gas interface detection can be broadly divided into two categories based on their electronic response to the presence of the liquid droplet. A digital method reacts digitally, turning “on” when the air/liquid interface of the droplet passes over the sensor. An analog sensor, in addition to turning “on”, responds as a function of the droplet size.
In our analog electrode based method, the voltage response from a pair of parallel electrodes indicates the location and volume of the droplet present over the electrodes. Fig. 1 shows a device with parallel gold electrodes (400 nm thick, 100 μm wide and 100 μm apart) fabricated along the bottom of a microfluidic channel. A drop of water displaces air over the electrodes as it moves inside the channel, partially wetting the electrodes. The front interface of the static droplet is shown in Fig. 1(b). The volume of water droplet over the parallel electrodes is proportional to the steady state response from the electrodes (Fig. 2). Droplets as small as 25 nL were detected using this method. This analog method would, however, require calibration for each liquid based on its electrical conductivity to accurately translate the voltage response into the corresponding volume measurement.
Fig. 1.
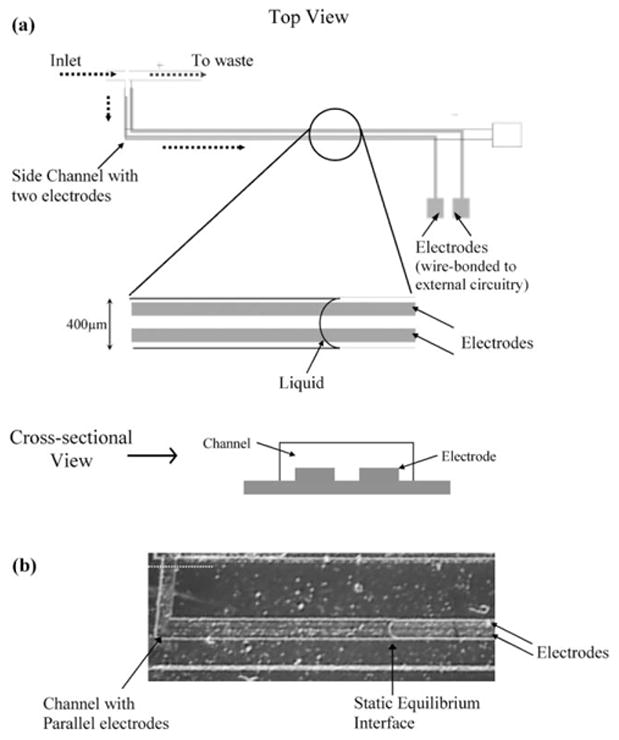
Analog electrode based droplet sensing. (a) The sketch shows the top and cross-sectional view of a microfabricated device containing a fluidic channel and two parallel gold electrodes that run all along the bottom surface of the channel. The black dotted arrows denote the direction of flow of liquid. The electrodes are 400 nm thick, 100 μm wide and 100 μm apart. (b) A static drop of water partly wetting the electrodes in the channel. A DC voltage (3 V) is the applied across the electrodes and the steady state voltage response is recorded. The white dotted line corresponds to one end of the electrodes. Droplet volume is measured from the white dotted line to the front interface.
Fig. 2.
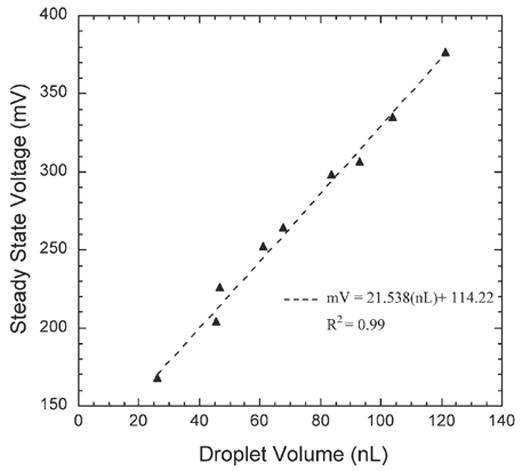
Steady state voltage response (mV) as a function of droplet volume (nL) for water inside the device shown in Fig. 1.
In our digital electrode sensing technique, pairs of electrodes are fabricated at pre-determined locations inside the microfluidic channel, and a constant DC signal (~ 2.7 V) is applied across each pair (Fig. 3). The electrodes in each pair are placed close to each other (50 μm apart) to achieve maximum conductance in the electrical circuit. In the absence of liquid over the electrodes, there is no conduction path between the electrodes of a pair. However as soon as the liquid interface passes over the electrodes, a conduction path of non-zero voltage drop (>10 mV) is observed (Fig. 3(b)). When this happens, the power to the electrodes is turned off to prevent electrolysis and the time t is recorded. The entire spectrum of times along with the corresponding position of the electrodes provides the exact location of the liquid inside the channel as a function of time. The instant response of the electrodes to the presence of a liquid makes this an excellent method to dynamically track a moving liquid drop.
Fig. 3.
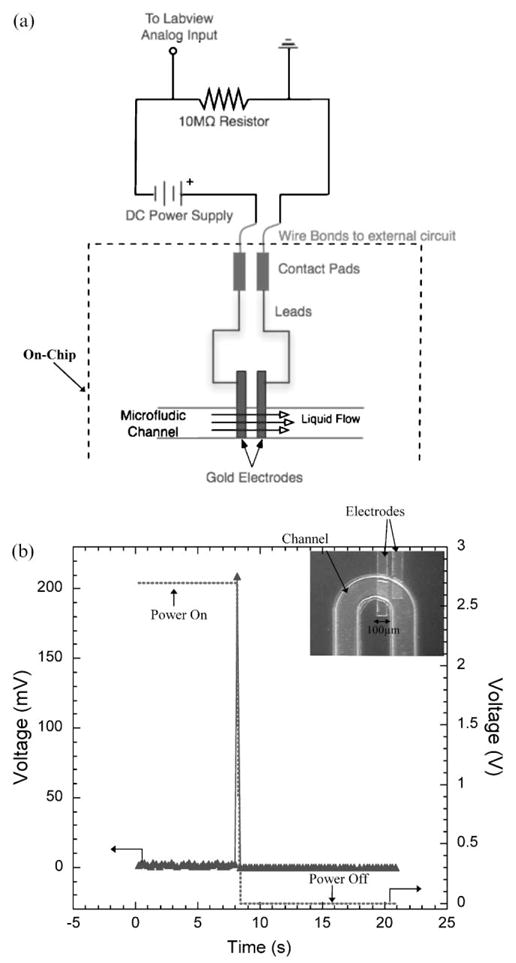
Digital electrode based droplet sensing. (a) The microfluidic chip connected to a power supply and an external resistor. The dashed line denotes the on-chip machinery. (b) A typical voltage response from the electric circuit of a pair of on-chip electrodes when the air/liquid interface passes over the electrodes. The dotted waveform is the voltage applied to the electrodes. The inset shows electrodes on a real microfluidic device.
A limitation of the above described electrode based sensing method is that it may only be used for electrically conductive liquids. The electrical conductivity of some commonly used liquids is given in Table 1.26 While the electrode based methods were able to sense body fluids, biochemical reagents and organic solvents, all of which have conductivities greater than 10−8 S cm−1, they were unable to sense the presence of mineral oils and petroleum products (10−13 S cm−1). For low conductivity liquids other sensing techniques that are based on change of temperature (described below), capacitance21 or refractive indices13 may be employed.
Table 1.
Electrical conductivities of different liquids
| Number | Liquid | Electrical conductivity/ S cm−1 |
|---|---|---|
| 1 | Pure water | 4 × 10⁻⁸ |
| 2 | Acetic acid | 6 × 10⁻⁸ |
| 3 | Human whole blood | 6 × 10⁻⁵ |
| 4 | Acetone | 6 × 10⁻⁸ |
| 5 | Ethyl alcohol | 13.5 × 10⁻⁸ |
| 6 | Human blood plasma | 6 × 10⁻⁵ |
| 7 | Human urine | 6 × 10⁻⁵ |
| 8 | Benzene | 7.6 × 10⁻⁸ |
| 9 | Carbon tetrachloride | 4 × 10⁻¹⁸ |
| 10 | Chloroform | 2 × 10⁻⁸ |
| 11 | Glycerol | 6.4 × 10⁻⁸ |
| 12 | Polyethyleneoxide (1000 ppm) | 6 × 10⁻⁸ |
| 13 | Pentane | 2 × 10⁻¹⁰ (19.5 °C) |
| 14 | Oleic acid | 2 × 10⁻¹⁰ (15 °C) |
| 15 | Hexane | 1 × 10⁻¹⁸ (18 °C) |
The thermal method for liquid detection is based on convective loss of heat when a liquid drop passes over a localized region. The thermal sensor consists of a combination of an on-chip resistive heater and a resistive temperature detector (RTD) in close proximity beneath the channel. Fig. 4 (a)–(c) shows the snapshots of a droplet of water moving inside the channel while the temperature profile from the underlying RTD is monitored. Fig. 4(d) shows a close-up of the localized region containing a heater–RTD pair while Fig. 4(e)–(f) shows the temperature profile as the liquid flows over the localized region. The electronic response as the liquid flows over the heated region is tolerable at moderate temperatures (52 °C), lower temperatures (36 °C) may need to be used avoid heating up the substrate. Although this thermal method has been used here for digital sensing, it may also be used for analog sensing by using a long RTD and monitoring the temperature profile as the liquid droplet gradually wets the RTD. In addition material properties, thermal isolation techniques, and optimized device geometry may be used to achieve better temperature response.27
Fig. 4.
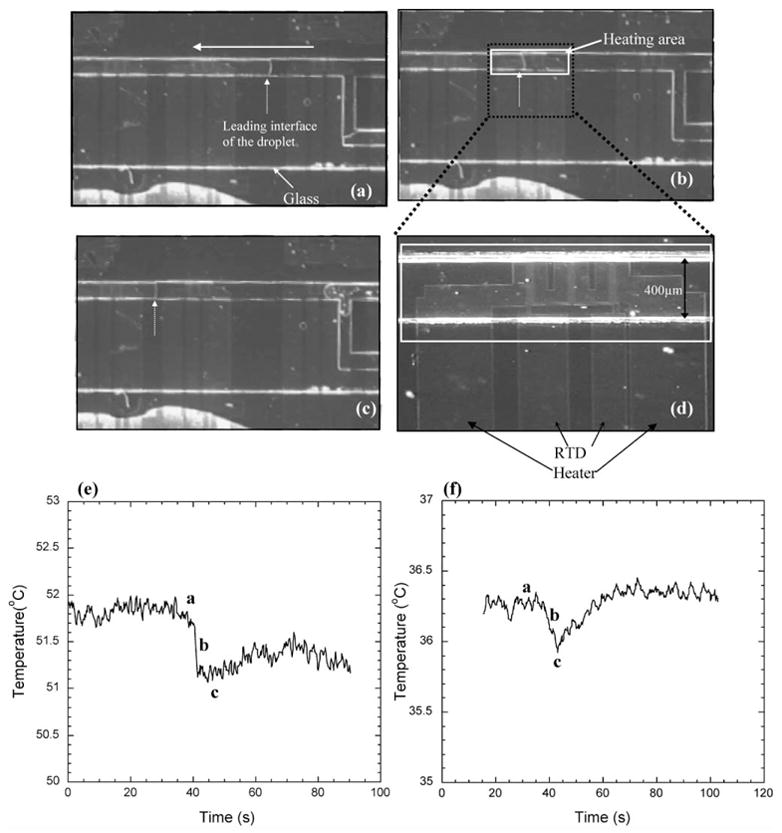
Thermal droplet sensing. (a)–(c) Snapshots of droplet moving over a pair of heaters and RTD inside a microfluidic channel. The white solid arrow denotes the direction of flow and the white dotted arrow points to the leading interface. (d) Closer view of the heater and RTD. (e), (f) Decrease in the local temperature as the droplet passes over the heated region for two different temperatures: T = 36 °C and T = 52 °C. The droplet was moved using short duration (12 ms) pulses of air pressure (8 psi). The top view of the device is shown.
Dynamic and static liquid sensing
The digital electrode sensing described above was used to monitor the location of the advancing interface of a liquid column inside an open channel and calculate its mean velocity. Further, the parameter vL was electronically generated to be used in viscosity measurements. Since the digital electrode method works as a toggle that turns “on” when a fast moving liquid passes over it, the technique is well suited for this type of motion detection. An array of eight pairs of electrodes, e1 through e8, was fabricated in the open channel (Fig. 5(a) and (b)), and their voltage response as the liquid column flows through the device is shown in Fig. 5(c). The time, t, at which a peak voltage occurs from each pair of electrodes is recorded and, knowing the distance of each electrode from the inlet of the channel, the length of the liquid droplet, L, is obtained as a function of time. From the data of L and t, the velocity of the liquid droplet, v (v = ΔL/Δt), ), is calculated at eight different locations. An average value of vL is then calculated once the liquids pass over all the eight pairs of electrodes. Liquid velocities as high as 1 cm s−1 have been measured using this method.
Fig. 5.
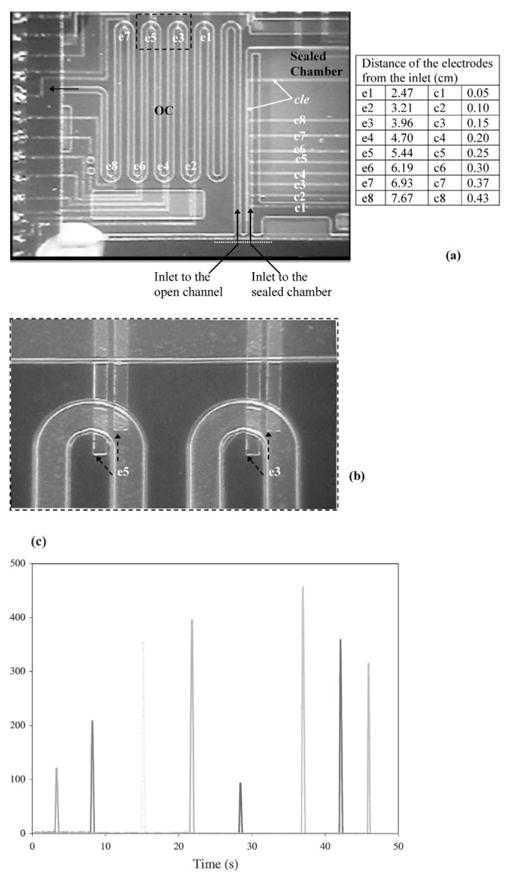
Digital electrode sensing of a dynamic interface. (a) The 8 pair of electrodes in the open channel and another 8 electrode electrodes in the sealed chamber is shown. The white dotted line indicates the inlet. (b) A closer look at the open channel (OC) electrodes. (c) Real-time response from the 8 pairs of electrodes as the droplet passes over each one of them.
The digital electrode sensing was also used to determine the location of a static liquid interface. This interface location was then used to calculate the volume of air compressed inside the sealed chamber and, therefore, the capillary pressure Pcapillary of liquid column (see eqn (1)). A common long electrode (cle) present along the inlet channel to the sealed chamber is connected to DC voltage (2.7 V) while eight electrodes, c1 through c8, protrude into the channel and are each connected to eight resistors (Fig. 6). A liquid placed at the inlet is drawn inside by capillary action. The electrode cle is energized only after the droplet attains the equilibrium static position to prevent any electrokinetic motion. Although, the current system is designed to wait for 30 s, the time for equilibrium static conditions may also be estimated using capillary pressure as the driving pressure and Hagen–Poiseuille to determine the rate of liquid imbibing in. The voltage response from the circuits of the eight electrodes is indicative of the volume of the static droplet. Fig. 6 shows the response for a drop of water and the optical micrograph of the position of the liquid. The volume of the droplet, (V1 – V2), was found to be 42 nL corresponding to the volume between the inlet and last electrode with a non-zero voltage response (c4 in this case). In this case V1 was 1700 nL (known from design) and Pcapillary was calculated, using eqn (1), to be 1615 Pa.
Fig. 6.
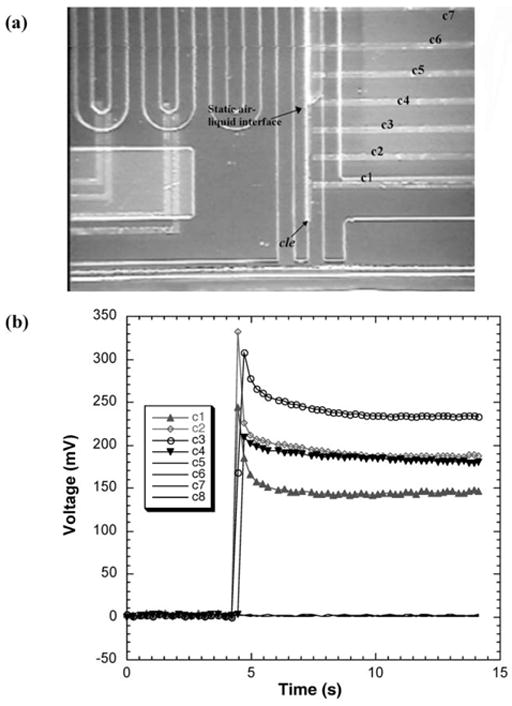
Digital electrode sensing for capillary pressure measurement. (a) Static droplet trapped inside the inlet channel to a sealed chamber. Only part of the sealed chamber can be seen. (b) Voltage response from the circuits of the 8 pairs of electrodes, c1 through c8, in the sealed chamber. The volume of the droplet in this case was measured to be 24 nL corresponding to the volume from the inlet of the last electrode with a non-zero voltage response (electrode c4 in this case).
The resolution of measuring capillary pressure will, however, be affected if the equilibrium static interface of the droplet fell between two electrodes. The resolution can be improved by increasing the density (i.e., reducing the inter-electrode spacing) and increasing the total number of electrodes in the sealed chamber. For instance, the current design contains eight electrodes (c1–c8) where the inter-electrode spacing is 500 μm up to c6, after which it is 700 μm. For this design we estimate that a maximum error of 12% is possible. The error may, however, be reduced to less than 2% with an inter-electrode spacing of 100 μm using sixteen electrodes. Alternatively the analog electrode sensing, where the voltage response is a linear function of the droplet volume (Fig. 2), may be used for enhanced accuracy although, as mentioned previously, a calibration of electrical conductivity would be necessary.
Automated viscometer operation
A completely automated system for measuring viscosity is shown in Fig. 7 and consists of a microfluidic device, laptop computer and data acquisition electronics. The microfluidic device contains two open channels (OC1 and OC2, d ~ 45 μm, w ~ 300 μm, Ltotal ~ 9 cm) and two sealed chambers (SC1 and SC2, d ~ 45 μm). The measurement of viscosity is based on capillary pressure driven flow and is given by the rearranged form of the Poiseuille flow equation.
Fig. 7.
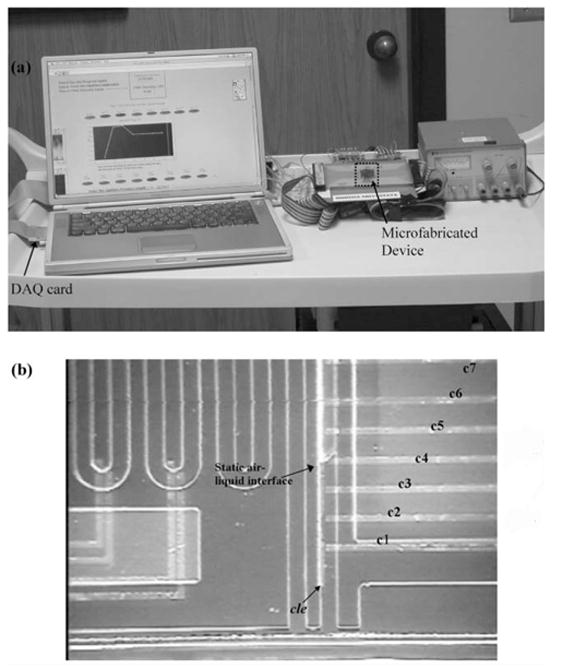
Portable viscosity measurement system. (a) The setup consists of a microfluidic device, electronics and laptop computer controlled data acquisition system. (b) A closer look at the silicon-glass microfluidic device. Metal electrodes are evaporated and patterned on the silicon side. The glass side has two open (OC1 and OC2, d ~ 45 μm, w ~ 300 μm, Ltotal ~ 9.0 cm) and two sealed channels (SC1 and SC2, d ~ 45 μm). OC1 and SC1 are used for the calibration liquid (e.g., water) and OC2 and SC2 are used for the sample. Only one drop of the liquid is used for each pair, part of which wicks into the sealed channel while another part wicks into the open channel.
| (2) |
where μ is the liquid viscosity, d is the depth of the channel, S is a shape factor, v is the mean velocity, L is the length of the liquid column inside the channel and Pcapillary is the capillary pressure drop across the advancing interface of the column. One set of open and sealed channels measures vlcalib and Pcapillary, calib, respectively, for a liquid of known viscosity, μcalib, while the other set (OC2 and SC2) is used for the liquid sample. Using eqn (2) and knowing that the geometry of OC1 and OC2 is identical (i.e., same d and S), we obtain, 25
| (3) |
The measurement of vL and Pcapillary are electronically obtained from LabVIEW™ using the dynamic and static digital electrode based sensing as described in the previous section (also see Methods).
As a demonstration, the viscosity of water was measured. First, the computer calculates vL and Pcapillary for the calibration liquid (D1.2 Viscosity standard, Paragon Medical) using OC1 and SC1 as 1.23 cm2 s−1 and 1615 Pa respectively. Next, water was added to OC2 and SC2. Pcapillary was calculated from the response of the electrodes in SC2. LabVIEW™ then calculates and displays a viscosity value as soon as the water column passes over the 2nd electrode (e2) based on the time it took to travel from e1 to e2 in OC2. The viscosity value is updated as water flows over the subsequent electrodes (e3–e8) and each time a new value is produced by calculating a new averaged value of “vL”. Fig. 8 shows the real time viscosity of water as obtained from six different runs on the automated viscometer system. After the liquid droplet passes over the last electrode (e8), the final viscosity is displayed and was found to be 0.99 ± 0.08 cP at 23 °C.
Fig. 8.
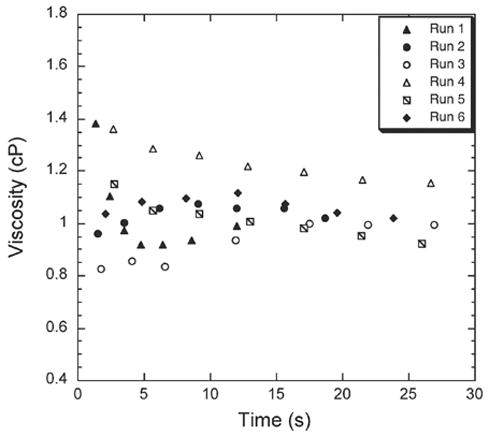
Automated measurement of viscosity of water at 23 °C using Digital Electrode Sensing. The plot shows the measurement of viscosity in real time as generated from LabVIEW™ for different viscometer devices. The seven viscosity points correspond to when the liquid column hits the 2nd, 3rd, 4th, 5th, 6th, 7th and 8th electrode in the open channel (OC). The seventh point is the final viscosity value.
Although the liquid sensing method completely automates the operation of the device, it may also influence viscosity measurements. For instance, the electrodes in the capillary pressure channel may change the surface properties. For this, control devices that had gold electrodes in one sealed chamber (SC1) and none on the other (SC2) were fabricated. A 10 μL drop of water was added to both SC1 and SC2 and the capillary pressure was measured. It was noticed that the shape of the static meniscus over the electrodes in the inlet to the sealed chamber was sometimes distorted as shown in Fig. 9; there was less wetting on the common gold electrode (cle). In such cases, the volume corresponding to the leading meniscus, shown with a dotted line, was used in the measurement of capillary pressure. These control experiments, however, did not reveal any significant change in the capillary pressure due to the presence of gold electrodes.
Fig. 9.
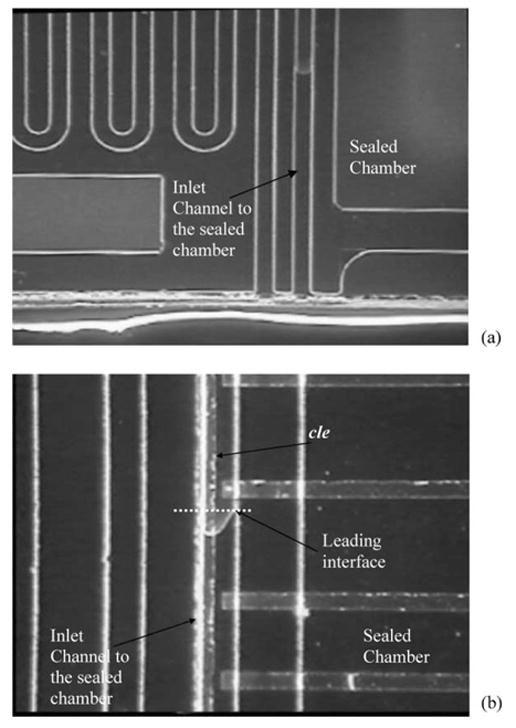
Shape of the equilibrium static meniscus on a metal and non-metal surface inside the sealed chamber of the microfluidic viscometer.
Conclusion
The present work is a significant advancement over the previous work reported on nanoliter viscometers.25 In the previous work, only the microscale fluid mechanics of measuring viscosity was addressed. Besides the nanoliter viscometer, the previous system also included cumbersome accessories such as the stereoscope, digital imaging system, video capture and a detailed image analysis platform, and therefore, did not allow for portable and automated operation for use at the point of care. The present work now includes a liquid sensing system that facilitates complete computerized operation of the nanoliter viscometer and may now be used as is in several applications including bedside patient monitoring for hyperviscosity and cardiovascular risk assessment.
Many different sensing schemes were discussed in the paper of which the digital electrode method was used in the viscometer. Other methods such as the thermal and the analog electrode method may also be used to automate the viscometer and may in fact provide better accuracy and wider applicability. For instance, the temperature-based method may be used with liquids of low electrical conductivity. Thermal isolation techniques such as silicon back etching 27 may be used to bring down the heating requirements and provide faster response times. Similarly, analog electrode detection, with appropriate calibration for electrical conductivity, may be used to convey both the presence and the total volume of liquid present inside a microfluidic channel.
Acknowledgments
The authors would like to acknowledge the Rackham Pre-doctoral doctoral fellowship for supporting this work. The authors would like to acknowledge support from NIH through grants P01 HG01984 and R01 AI49541. The authors are also grateful to Brian N. Johnson for help with LabVIEW™ and related electronics.
References
- 1.Vilkner T, Janasek D, Manz A. Anal Chem. 2004;76:3373. doi: 10.1021/ac040063q. [DOI] [PubMed] [Google Scholar]
- 2.Landers JP. Anal Chem. 2003;75:2919. doi: 10.1021/ac0301705. [DOI] [PubMed] [Google Scholar]
- 3.Jensen KF. AIChE J. 1999;45:2051. [Google Scholar]
- 4.Gulliksen A, Solli LA, Drese KS, Sorensen O, Karlsen F, Rogne H, Hovig E, Sirevag R. Lab Chip. 2005;5:416. doi: 10.1039/b415525d. [DOI] [PubMed] [Google Scholar]
- 5.Pal R, Yang M, Lin R, Johnson BN, Srivastava N, Razzacki SZ, Chomistek KJ, Heldsinger D, Haque RM, Ugaz VM, Thwar P, Chen Z, Alfano K, Yim M, Krishnan M, Fuller AO, Larson RG, Burke DT, Burns MA. Lab Chip. 2005;5:1024. doi: 10.1039/b505994a. [DOI] [PubMed] [Google Scholar]
- 6.Lagally ET, Scherer JR, Blazej RG, Toriello NM, Diep BA, Ramchandani M, Sensabaugh GF, Riley LW, Mathies RA. Anal Chem. 2004;76:3162. doi: 10.1021/ac035310p. [DOI] [PubMed] [Google Scholar]
- 7.Bruin GJM. Electrophoresis. 2000;21:3931–39 3951. doi: 10.1002/1522-2683(200012)21:18<3931::AID-ELPS3931>3.0.CO;2-M. [DOI] [PubMed] [Google Scholar]
- 8.Pennathur S, Santiago JG. Anal Chem. 2005;77:6782–67. doi: 10.1021/ac0508346. [DOI] [PubMed] [Google Scholar]
- 9.Jacobson SC, McKnight TE, Ramsey JM. Anal Chem. 1999;71:4455–4459. [Google Scholar]
- 10.Kikutani Y, Hisamoto H, Tokeshi M, Kitamori T. Lab Chip. 2004;4:328–332. doi: 10.1039/b400233d. [DOI] [PubMed] [Google Scholar]
- 11.Dittrich PS, Schwille P. Anal Chem. 2003;75:5767. doi: 10.1021/ac034568c. [DOI] [PubMed] [Google Scholar]
- 12.Wang GR. Lab Chip. 2005;5:450. doi: 10.1039/b416209a. [DOI] [PubMed] [Google Scholar]
- 13.Namasivayam V, Lin R, Johnson B, Br Brahmasandra S, Razzacki Z, Burke DT, Burns MA. J Micromech Microeng. 2004;14:81. [Google Scholar]
- 14.Valentino JP, Troian SM, Wagner S. Appl Phys Lett. 2005;86:18. 184101. [Google Scholar]
- 15.Link DR, Anna SL, Weitz DA, Stone HA. Phys Rev Lett. 92;5:054503. doi: 10.1103/PhysRevLett.92.054503. [DOI] [PubMed] [Google Scholar]
- 16.Cho SK, Moon H, Kim C. J Microelectromech Syst. 2003;12:70. [Google Scholar]
- 17.Atencia J, Beebe DJ. Nature. 2005;437:648. doi: 10.1038/nature04163. [DOI] [PubMed] [Google Scholar]
- 18.Paik P, Pamula VK, Pollack MG, Fair RB. Lab Chip. 2003;3:28–33. doi: 10.1039/b210825a. [DOI] [PubMed] [Google Scholar]
- 19.El-Ali J, Gaudet S, Günther A, Sorger PK, Jensen KF. Anal Chem. 2005;77:3629–3636. doi: 10.1021/ac050008x. [DOI] [PubMed] [Google Scholar]
- 20.Chiou J, Matsudaira P, Sonin A, Ehrlich D. Anal Chem. 2001;73:2018–2021. doi: 10.1021/ac001227f. [DOI] [PubMed] [Google Scholar]
- 21.Chen JZ, Darhuber AA, Troain SM, Wagner S. Lab Chip. 2004;4:473–480. doi: 10.1039/b315815b. [DOI] [PubMed] [Google Scholar]; Ren H, Fair RB, Pollack MG. Sens Actuators, B. 98:319–327. [Google Scholar]
- 22.Pagonis DN, Kaltsas G, Nassiopoulou AG. J Micromech Microeng. 2004;14:793–797. [Google Scholar]
- 23.Collins J, Lee AP. Lab Chip. 2004;4:7–10. doi: 10.1039/b310282c. [DOI] [PubMed] [Google Scholar]
- 24.Marchand G, Delattre C, Campagnoio R, Pouteau P, Ginot F. Anal Chem. 2005;77:5189. doi: 10.1021/ac0505066. [DOI] [PubMed] [Google Scholar]
- 25.Srivastava N, Davenport RD, Burns MA. Anal Chem. 2005;77:383–392. doi: 10.1021/ac0494681. [DOI] [PubMed] [Google Scholar]
- 26.Dean JA. Lange’s Handbook of Chemistry. McGraw-Hill Inc; 1998. [Google Scholar]; Texter EC, Hirsch FG, Horan FE, Wood LA, Ballard WC, Wright IS. Blood. 1950;5:1036––10 104848. [PubMed] [Google Scholar]; Manocha K, Kuhar SS, Chabra HL. Ind J Med Res. 1987;86:124–127. [PubMed] [Google Scholar]
- 27.Darhuber AA, Troian SM, Wagner S. J Appl Phys. 2002;91:5686. [Google Scholar]; Yang M, Pal R, Burns MA. J Micromech Microeng. 2005;15:221–230. [Google Scholar]


