Abstract
We propose a simple moving-average (MA) model that uses the low-frequency (LF) component of the peroneal muscle sympathetic nerve spike rate (LFspike rate) and the high-frequency (HF) component of respiration (HFResp) to describe the LF neurovascular fluctuations and the HF mechanical oscillations in systolic blood pressure (SBP), respectively. This method was validated by data from eight healthy subjects (23–47 yr old, 6 male, 2 female) during a graded tilt (15° increments every 5 min to a 60° angle). The LF component of SBP (LFSBP) had a strong baroreflex-mediated feedback correlation with LFspike rate (r = −0.69 ± 0.05) and also a strong feedforward relation to LFspike rate [r = 0.58 ± 0.03 with LFSBP delay (τ) = 5.625 ± 0.15 s]. The HF components of spike rate (HFspike rate) and SBP (HFSBP) were not significantly correlated. Conversely, HFResp and HFSBP were highly correlated (r = −0.79 ± 0.04), whereas LFResp and LFSBP were significantly less correlated (r = 0.45 ± 0.08). The mean correlation coefficients between the measured and model-predicted LFSBP (r = 0.74 ± 0.03) in the supine position did not change significantly during tilt. The mean correlation between the measured and model-predicted HFSBP was 0.89 ± 0.02 in the supine position. R2 values for the regression analysis of the model-predicted and measured LF and HF powers indicate that 78 and 91% of the variability in power can be explained by the linear relation of LFspike rate to LFSBP and HFResp to HFSBP. We report a simple two-component model using neural sympathetic and mechanical respiratory inputs that can explain the majority of blood pressure fluctuation at rest and during orthostatic stress in healthy subjects.
Keywords: wavelet transform, blood pressure variability, Mayer waves, respiration, muscle sympathetic nerve activity
various rhythmic oscillations in human blood pressure (BP) have been proposed to reflect the action of different physiological mechanisms on BP regulation. For instance, it has been suggested that very low-frequency (VLF) trends (period >25 s, frequency <0.04 Hz) in BP represent the influence of hormonal regulation and thermoregulation and that high-frequency (HF, 0.15–0.4 Hz) fluctuations mark the effect of respiration on BP. A more hotly debated issue is the idea that low-frequency (LF, 0.04–0.14 Hz) BP oscillations with a 10-s periodicity, generally referred to as Mayer waves, reflect sympathetically mediated vasomotor BP modulation. It has been proposed that the origin of these waves is a resonance phenomenon of the baroreflex pathway (12), and the LF power has been used as a marker of sympathetic activity (34, 35, 37), although this practice remains controversial (31, 48).
Several lines of indirect evidence have been used to associate the oscillations in BP with oscillations in these other physiological rhythms. For example, physiological maneuvers have identified changes in the oscillatory patterns of sympathetic nerve activity and respiration that correspond to those in BP during sympathetic activation (20). During head-up tilt (HUT), 1) LF oscillations are evident in the nerve activity and BP, 2) HF oscillations are expressed in each of the three signals, i.e., respiration, BP, and nerve activity, and 3) relative changes in the LF component of spike rate (LFspike rate) and the HF component of respiration (HFResp) are also reflected in the BP (Fig. 1). Coherence analysis has objectively shown that the frequency-domain relations between these signals are significant under normal physiological conditions (18, 20, 40).
Fig. 1.
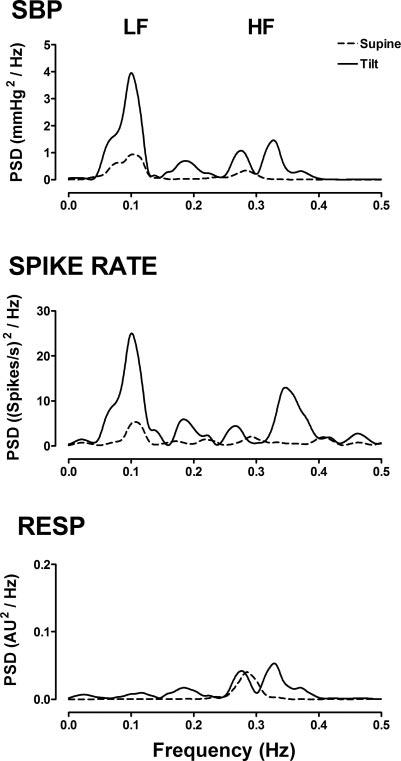
Spectral characteristics [power spectral density (PSD)] of systolic blood pressure (SBP), sympathetic spike rate, and respiration (Resp) at rest in the supine position and at 60° head-up tilt (HUT) in a representative subject. AU, abitrary units.
Similarly, pharmacological interventions and the study of autonomic pathologies have also indirectly supported the idea that sympathetic activity and respiration contribute to the oscillations in BP. The LF component of BP (LFBP) oscillations is attenuated during ganglionic blockade in healthy subjects (15, 32, 56) and is absent in patients with pure autonomic failure with peripheral sympathetic nerve lesions (15, 19), suggesting a sympathetic origin for this rhythm. On the other hand, the HF component of BP (HFBP) fluctuations is unaffected by ganglionic blockade (15, 32, 56) and remains after thoracic sympathectomy in transplant patients (27). Additionally, the neurovascular interface has been suggested to possess low-pass characteristics that effectively filter out the HF components of sympathetic activity (12, 25, 43, 55). These findings indicate that the HFBP rhythm is not neurally mediated but, instead, largely the result of the mechanical interaction between BP and respiration or cardiac output (CO).
Although there is much indirect evidence, a mathematical model may provide a more direct description of the relation between the BP oscillations and fluctuations in other cardiovascular parameters. A number of models using heart rate (HR) and respiration (12, 29, 30, 47) have been developed to help explain the fluctuations in human BP. One limitation of most models is that they do not include sympathetic activity as a direct input parameter. Modeling of BP fluctuations from sympathetic activity in animals has been successfully applied using a system identification approach (5, 22, 24). Kamiya et al. (23) adapted a transfer function approach used in rabbits to explain the LF fluctuations in human BP and sympathetic activity during tilt but applied this model only to simulated data. In their explanation of human BP fluctuations, Myers et al. (31) used a linear model with integrated sympathetic activity as an input parameter, which yielded less accurate results than the transfer functions used in animals. However, the primary concern of this model was explanation of LFBP; it utilized integrated burst areas with arbitrary units to quantify sympathetic activity, rather than the spike rates typically found in animal models, and involved euglycemic clamping to enhance sympathetic activation, a procedure that induces vasodilation through increased insulin release and may alter the neurovascular coupling (11).
We propose a different mathematical model that combines subbands of the sympathetic spike rate and respiration to explain the LF and HF oscillations in human BP. A technique to detect action potentials in raw human sympathetic nerve recordings has been recently introduced and can be used to form a spike rate density series to quantify sympathetic activity (3, 14). Using the spike rate density along with measured respiratory patterns, we examine the accuracy of a two-component linear model that attempts to describe the LF-neurovascular interaction and the HF mechanical effects of respiration on the fluctuations in human BP.
METHODS
Subjects and Clinical Conditions
Eight healthy subjects (6 male, 2 female; 23–47 yr old) were recruited from the Vanderbilt University General Clinical Research Center volunteer database. All subjects underwent extensive physical examination and had no signs of cardiovascular disease or history of syncope before the study. The subjects abstained from all drugs, including caffeine and nicotine, for ≥72 h before testing. Their body mass index was 26 ± 1.7 kg/m2, resting HR was 61 ± 2 beats/min, and BP was 111 ± 2/65 ± 2 mmHg.
Protocol
Straps were used to secure the subjects to a tilt table. The subjects were instructed to remain relaxed and quiet throughout all studies and were monitored for any signs of presyncope during all tests (53). After 15 min of supine rest, the subjects were tilted by 15° increments every 5 min until an angle of 60° was reached. All studies were conducted at Vanderbilt University General Clinical Research Center, and all procedures were approved by the local Institutional Review Board.
Instrumentation
The following variables were measured: electrocardiogram (ECG), BP, respiration, and muscle sympathetic nerve activity (MSNA). The ECG of lead II was recorded with an ECG/Biotach amplifier (Gould Electronics, Cleveland, OH). The continuous finger BP waveform was measured by a photoplethysmograph-based volume-clamp method (39) with a finger cuff (Finapres, Ohmeda, Englewood, CO) on the middle finger of the nondominant hand and verified by brachial BP, which was obtained by an automated auscultometric device (Dinamap BP monitor, model 1846SX, Critikon, Tampa, FL) on the contralateral arm. The hand with the Finapres sensor was fixed at heart level. Respiration was measured by a pneumobelt (Pneumotrace II, UFI, Morro Bay, CA).
Microneurography
MSNA of the peroneal nerve was recorded randomly in either of the legs (51). A unipolar tungsten electrode with a 1- to 5-μm-diameter uninsulated tip and a 200-μm-diameter shaft (Frederick Haer, Bowdoinham, MA) was inserted into the muscle nerve fascicles of the peroneal nerve at the fibular head for multiunit recordings. Raw nerve activity was amplified with a total gain of 100,000, band-pass filtered from 0.7 to 2 kHz (662C-3 Nerve Traffic Analysis System, University of Iowa, Iowa City, IA). Satisfactory recordings of MSNA were defined by 1) heart pulse synchronicity, 2) facilitation during Valsalva straining and suppression during the hypertensive overshoot after release, 3) increases in response to breath holding, and 4) no change during tactile or auditory stimulation (13).
Data Preprocessing
Data were acquired at 5,000 Hz, 14-bit resolution using the Windaq data acquisition system (DI-720, DATAQ Instruments, Akron, OH) and analyzed off-line with custom software written in the PV Wave (Visual Numerics, Houston, TX) and MATLAB (Mathworks, Natick, MA) environments. QRS detection was performed using a modified Pan-Tompkins algorithm (38). Systolic and diastolic values in the continuous BP recordings were automatically identified as the maxima and minima for each cardiac cycle. All detections were visually verified.
A modified form of a technique described elsewhere (4, 14) was used to detect action potential spikes in raw MSNA recordings. A stationary wavelet transform with the Symlet 7 wavelet was used to decompose the MSNA into four bands of wavelet detail coefficients. Regions dominated by normally distributed noise in each band were identified as those with a kurtosis value <4. A kurtosis value of 3 indicates an ideal Gaussian distribution, and signal episodes with spike activity usually have higher kurtosis values. All coefficients with an absolute value less than four times the standard deviation of the identified noise regions were set to zero, and the denoised signal was reconstructed using the inverse stationary wavelet transform. Action potential spikes were then automatically detected from the denoised signal using a peak detector with a 3-ms time window.
We analyzed diastolic (DBP), systolic (SBP), and mean blood pressure (MBP) series, continuous respiration, and MSNA spikes detected over 200-s periods after 100 s of stabilization in the supine position and at 15°, 30°, 45°, and 60° HUT. DBP, SBP, and MBP variability series were formed by linear interpolation of the detected values onto regular 200-ms intervals (5 Hz). The detected MSNA spikes were used to form a spike rate series as previously described (3, 45). Briefly, a binary spike train was formed by insertion of delta functions into a 5-kHz sampled series at the detected spike times. The spike train was converted to a spike rate series by convolution with a Gaussian filter with a 3-Hz cutoff frequency (3). The spike rate signal was decimated by iterative convolution with an antialiasing Gaussian filter with a corner frequency of 0.4 times the current sample rate and downsampling by 2 until a sample rate of 4.88 Hz was reached. The resultant series was linearly interpolated at 5 Hz. The respiration signal was also decimated to 5 Hz after application of an eighth-order, antialiasing, Chebyshev type I low-pass filter with a corner frequency of 2 Hz. Each series was detrended by removal of the mean offset plus the VLF (0–0.04 Hz) components by filtering with a high-pass, finite-impulse response filter with a corner frequency of 0.04 Hz before any analysis or comparisons.
LF and HF time series were formed using a set of band-pass filters based on the Meyer wavelet, a modulated sinusoid with compact support (10), with approximate respective pass bands of 0.04–0.15 Hz (LF) and 0.15–0.5 Hz (HF) (see Ref. 49 for details of wavelet filtering).
Data Analysis
For study of the relation between each BP series (SBP, DBP, and MBP) and the MSNA spike rate and respiration, time-based cross-correlations were performed. In general, during the cross-correlation procedure, one time series, x, was delayed between the time constants τstart and τend (in seconds) while the other series, y, remained stationary. After each delay, correlation between the two series was determined. First, the LF components of each series were compared, with LFspike rate and LFResp as x and LFSBP, LFDBP, and LFMBP as y. The procedure was repeated using the HF components of each series. For the HFspike rate and respiratory series, the maximum absolute correlation was recorded for time delays between τstart = 10 s and τend = 0 s, meaning that our only interest was the relation in which changes in respiration and HFspike rate preceded changes in the BP. For the LFspike rate and LF components of the BP series, two relations were investigated. The minimum negative cross-correlation value, termed the baroreflex-feedback relation, was studied between τstart = 2 s and τend = −2 s. In this case, a negative time delay (e.g., τ = −2 s) would indicate that the spike rate is advanced in time. The positive maximum cross-correlation value, termed the feedforward relation, was studied between τstart = 10 s and τend = 0 s.
Before the BP fluctuations were modeled, LFspike rate was delayed by an amount equal to the feedforward delay and HFResp was delayed by an amount equal to the time shift that produced the maximum absolute correlation to HFBP.
Data Predictive Modeling
The LF oscillations in sympathetic nerve activity and the HF fluctuations in respiration were used in a two-component, MA linear model to predict the fluctuations in BP. First, the LF model predicts the current value of LFBP with use of the MA model, in which the output is a linear combination of p previous values of the LF components of the spike rate series (LFspike rate). The term wspike rate is added to indicate the presence of randomly distributed noise in the measurement of sympathetic spike rate
| (1) |
Similarly, the HF model predicts the current value of the HF BP series (HFBP) with use of a linear combination of k previous values from the HF respiration series (HFResp). The term wResp is added to indicate the presence of random noise in the recording of respiration
| (2) |
The proposed total model (Fig. 2) is a summation of the outputs of the LF and HF models and predicts the current value of the detrended BP series.
Fig. 2.
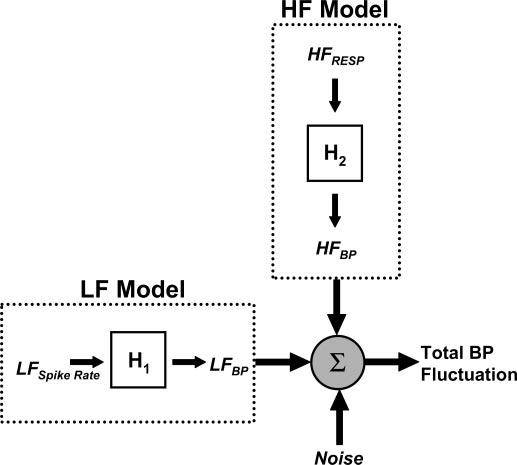
Components used to predict fluctuations in blood pressure (BP). H1, moving-average (MA) model used to convert low-frequency (LF) spike rate (LFspike rate) to LFSBP; H2, MA model used to convert high-frequency (HF) respiration (HFResp) to HFBP. Sum of LF and HF models predicts total BP fluctuation.
The coefficients for each model were computed using the Steiglitz-McBride method (44), and the optimal values for p or k (model order) were selected as those that minimized the final prediction error (FPE) (42) with a maximum order of 25 coefficients, or 5 s of past data. The model is based on equidistant data because of the continuous nature of the spike rate and respiratory input signal
| (3) |
where is the mean squared error between the model and true output, n is the total number of points in the signal, and p is the current model order. This modeling technique was applied to components of the signals recorded during a baseline period and over increasing orthostatic load during graded HUT. The values predicted by each model were compared with the corresponding measured values by point-by-point linear regression analysis and by comparison of their power spectral density (PSD) in specific frequency ranges.
PSD
The Welch periodogram method (54) is used to compare the estimated PSD of the measured BP series with that of the BP series predicted by the total model. The 200-s signals, which were recorded and predicted during each angle of tilt, were divided into 60-s segments that overlapped by 50%. Each segment was detrended, multiplied by a Hamming window, and zero padded to the next power of 2. The power in the LF (0.04–0.15 Hz) and HF (0.15–0.5 Hz) ranges was estimated as the area under the PSD curve.
Statistics
Regression analysis was performed using a linear least squares fit, and the Pearson correlation coefficient (r) or the coefficient of determination (R2) was used to quantify the goodness of fit. Wilcoxon's signed ranks test was used to test for significant differences in the correlation between the components of three different BP series (SBP, DBP, and MBP) and the components of the sympathetic spike rate and respiration. This test was also used to determine whether significant differences existed between measured and model-predicted BP values at different degrees of HUT. P = 0.05 was defined as the significance level. Unless otherwise noted, values are means ± SE.
RESULTS
Correlations Between Oscillatory Components
A representative temporal relation between SBP and MSNA spike rate is shown in Fig. 3. The sample-to-sample correlation between the unfiltered SBP and spike rate does not reveal an inherent linear relation between the two series (r = −0.37; Fig. 3A, bottom). However, their LF components appear to have two distinct relations. A shift in the LFspike rate series back in time by 0.4 s results in a strong negative correlation to LFSBP (r = −0.87; Fig. 3B, bottom), which indicates the strength of the baroreflex-mediated feedback (high spike rates during low BP). A shift in the LFspike rate series back in time by 5.2 s yields a strong positive correlation to LFSBP (r = 0.70; Fig. 3C, bottom), which suggests a feedforward relation between the two series, meaning that an increase in LFspike rate will produce a corresponding increase in LFBP.
Fig. 3.
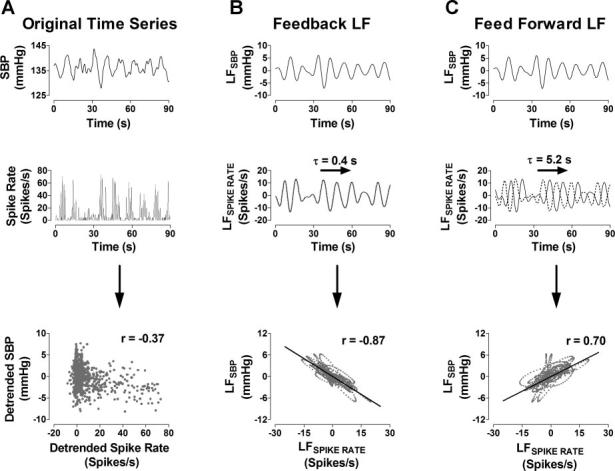
A: correlation between SBP and spike rate time series. B: baroreflex-mediated feedback relation between LFSBP and LFspike rate. C: feedforward relation between LFSBP and LFspike rate. Dashed lines, unshifted LFspike rate time series. τ, Time constant.
A similar relation can be found between SBP, respiration, and their HF components (Fig. 4). The unfiltered time series have a lower correlation coefficient (r = −0.41; Fig. 4A, bottom), but after application of an HF-band wavelet filter, the sample-to-sample correlation improves significantly (r = −0.86; Fig. 4B, bottom).
Fig. 4.
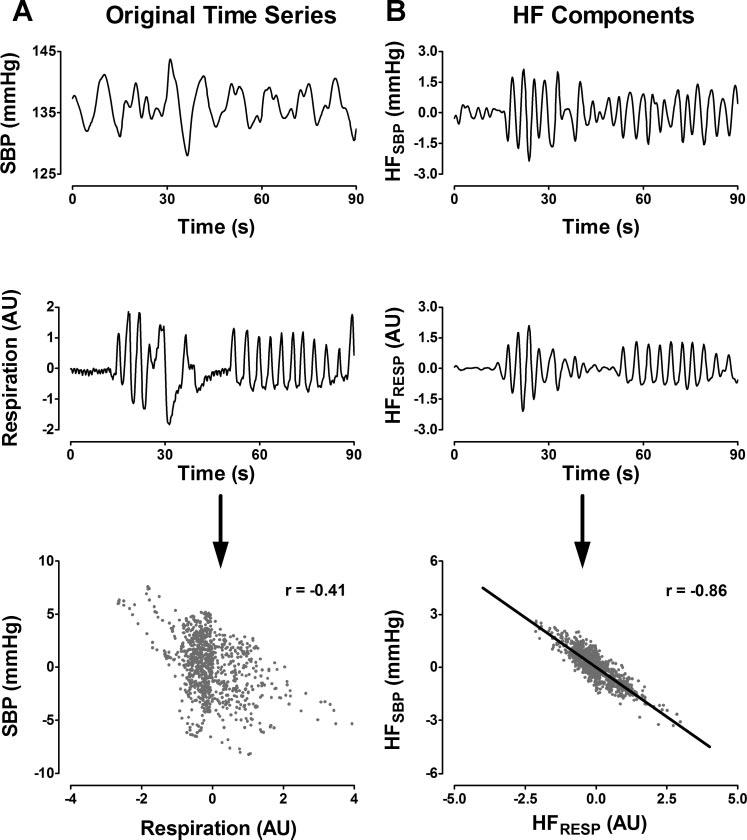
A: correlation between SBP and respiration time series (positive direction is inspiration). B: correlation between HF components of each time series. AU, arbitrary units.
A complete correlation analysis was performed between the LF and HF components of the SBP, MSNA spike rate, and respiration for all eight subjects during the baseline period (Fig. 5). The baroreflex-mediated feedback correlation (r = −0.69 ± 0.05) was significantly greater than the feedforward relation (r = 0.58 ± 0.03; Fig. 5, top left) between LFSBP and LFspike rate. However, the feedforward time delay (τ = 5.625 ± 0.15 s, increases in spike rate lead to increases in BP) was used in favor of the feedback time delay (τ = 0.375 ± 0.10 s, spike rate decreases with increase in BP) in the predictive model, because the intention of this model is to predict LF changes in BP from the LF changes in spike rate. HFspike rate and HFSBP are not significantly correlated (r = −0.22 ± 0.04; Fig. 5, top right). Conversely, HFResp and HFSBP are highly correlated (r = −0.79 ± 0.04; Fig. 5, bottom right), whereas LFResp and LFSBP have a significantly lower and less consistent correlation across subjects (r = 0.45 ± 0.08; Fig. 5, bottom left).
Fig. 5.
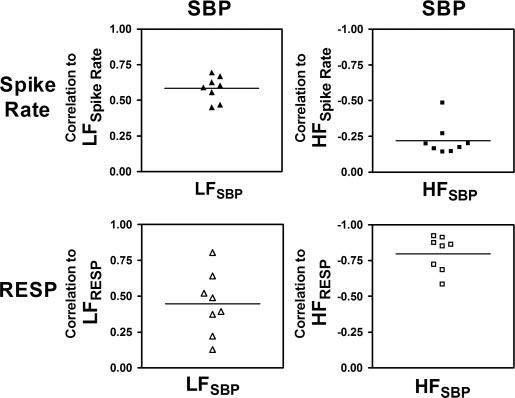
Correlations between LF (left) and HF (right) components of SBP and LF and HF components of spike rate (top) and respiration (bottom) at baseline.
When the correlation analysis was repeated using DBP and MBP, the feedback and feedforward correlations to LFspike rate did not differ significantly from those of SBP (P > 0.05 in each case). LFSBP (r = −0.58 ± 0.03, τ = 5.625 ± 0.15 s), LFDBP (r = 0.62 ± 0.05, τ = 5.1 ± 0.14 s), and LFMBP (r = 0.62 ± 0.04, τ = 4.8 ± 0.17 s) also had statistically similar feedforward correlations to LFspike rate. However, the correlations between HFResp and HFDBP and HFMBP were significantly less than the correlation between HFResp and HFSBP (P < 0.01 in both cases). Consequently, LFSBP and HFSBP will serve as the output of the predictive model.
Predictive Modeling at Rest in the Supine Position
The LF model (Fig. 2) used previously determined values of LFspike rate to predict the current values of LFSBP. The results of this model at baseline are displayed in Fig. 6A. The oscillations in the predicted LFSBP follow those in the measured LFSBP (Fig. 6A, top), and the two series have a strong linear correlation (r = 0.80; Fig. 6B, top). The HF model (Fig. 2) used previously determined values of the HFResp time series to predict the current values of the HFSBP series. This model also demonstrates an ability to follow the measured HFSBP (Fig. 6A, middle), and the measured and predicted sequences show a high positive correlation (r = 0.94; Fig. 6B, middle). When the outputs of the LF and HF models were summed, the resultant series was able to predict the total fluctuations in SBP (Fig. 6A, bottom). The sum of the LF and HF models produces a greater correlation to the measured SBP (r = 0.78; Fig. 6C, bottom) than either the individual LF (r = 0.70; Fig. 6C, top) or HF (r = 0.37; Fig. 6C, middle) models. (Statistical analyses for the supine model are discussed in the following section.)
Fig. 6.
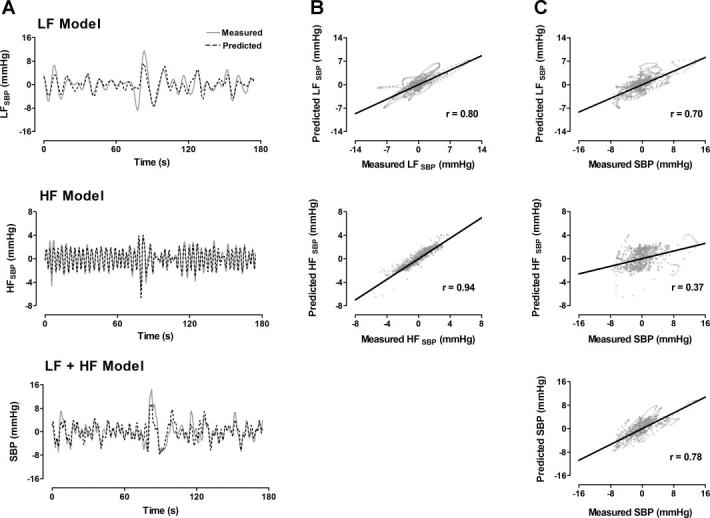
A: measured and model-predicted time series for LF component (top), HF component (middle), and total (LF + HF, bottom) detrended SBP. B: correlations between measured and predicted LF and HF time series in A. C: correlations between predicted time series in A and measured total SBP. LFspike rate and HFResp were used as LF and HF model inputs, respectively (see Fig. 2).
Predictive Modeling During Orthostatic Stress
The LF, HF, and total models were also tested over increasing degrees of orthostatic stress during HUT. Two methods were used to predict the BP fluctuations during HUT: 1) the unmodified model coefficients computed at baseline were applied to the spike rate and respiratory sequences during HUT, and 2) the optimal coefficients were recomputed for each degree of HUT. Method 2 achieved significantly higher correlation coefficients than method 1 (P < 0.01 in all cases). Consequently, optimal model coefficients were computed separately during each degree of HUT.
The model is effective in predicting the total oscillations in the SBP components (Fig. 7, left), and the correlation between measured and predicted SBP fluctuations remains strong during increasing orthostatic load (Fig. 7, right).
Fig. 7.
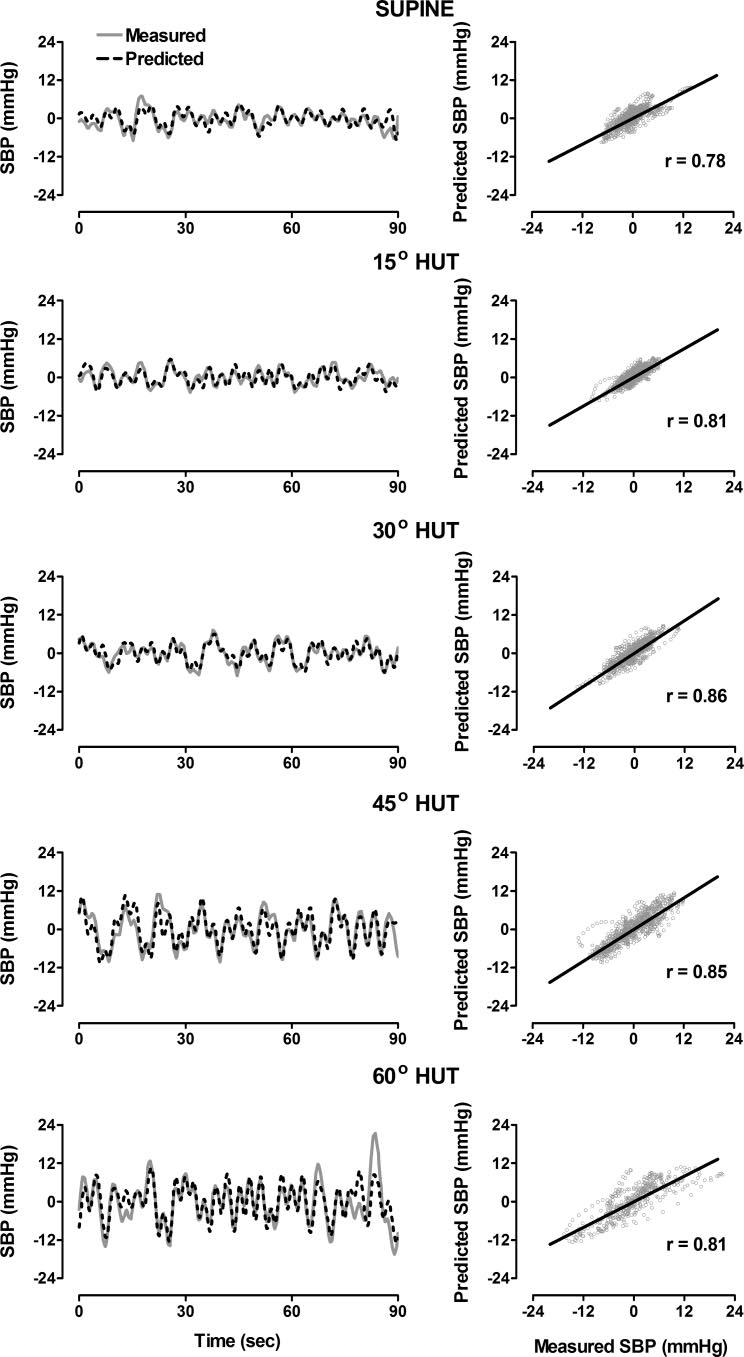
Left: measured and model-predicted detrended SBP in supine position and at 15°, 30°, 45°, and 60° HUT. Right: correlations between measured and predicted time series.
The mean value of the correlation coefficients between the measured and model-predicted LFSBP for eight subjects at rest in the supine position (r = 0.74 ± 0.03) did not change significantly during increased orthostatic load (P > 0.05 in all cases). The average order used for the LF model was 14–19 coefficients (from 2.8–3.8 s of past data) but did not differ significantly (P > 0.05) over all degrees of HUT. The mean correlation for the measured and predicted HFSBP (r = 0.89 ± 0.02) at baseline in the supine position was significantly reduced during 30° (r = 0.68 ± 0.04, P < 0.01) and 45° (r = 0.74 ± 0.06, P < 0.05) HUT but was not statistically different from baseline at 15° or 60° HUT. The average HF model order varied between 14 and 18 coefficients (from 2.8–3.6 s of past data) but did not differ significantly (P > 0.05) over all degrees of HUT. Figure 8 displays the correlation between total measured and model-predicted fluctuations in SBP during supine and graded tilt conditions. The mean correlations between the measured and model-predicted SBP fluctuations during each degree of tilt (r = 0.68 – 0.79) were not statistically different from one another. (Three subjects fainted during 60° HUT and were not included in the results at this tilt angle.)
Fig. 8.
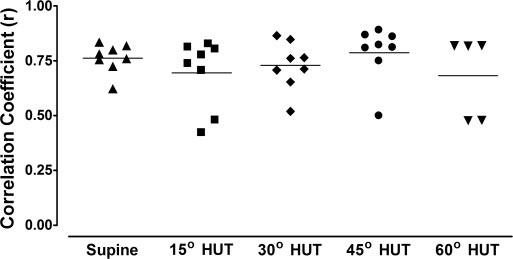
Correlations between measured and model-predicted SBP in supine position and at 15°, 30°, 45°, and 60° HUT.
The relation between the LF and HF power of the measured and predicted SBP signals for each subject during each degree of HUT is shown in Fig. 9. The slope of both regression lines is near 1 (0.9 for LF power and 1.1 for HF power) and the y-intercepts are 0, indicating a close identity of the model-predicted and measured values. The respective R2 values for the regression analysis of the LF and HF powers indicate that 78% and 91% of the variability in power can be explained by the linear relation.
Fig. 9.
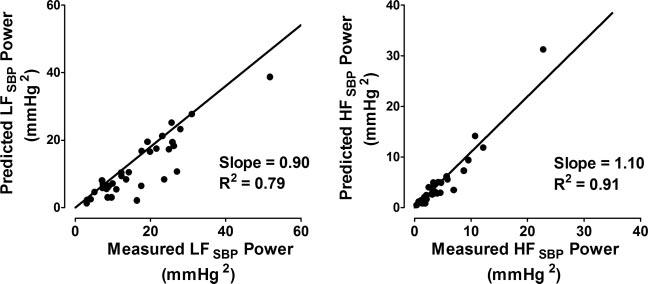
Cumulative relation between LF (left) and HF (right) power derived from measured and model-predicted SBP series in supine position and at 15°, 30°, 45°, and 60° HUT.
Zero-Order vs. Optimal-Order Model
When a simple slope model (model order = 0, 1 coefficient) was used to predict the components of the SBP from the components of the spike rate and respiration, the correlation between the measured and predicted values still indicated a strong linear relation (mean r = 0.60 for total model), but the correlations were significantly less than those computed using the optimal model order defined by the minimum FPE (P < 0.01).
DISCUSSION
In this study, we report three main findings: 1) LFBP has a strong, linear, temporal correlation to LFspike rate. 2) HFSBP and HFResp also have a strong temporal correlation. 3) A large portion of the fluctuations in human BP can be explained using LFspike rate and HFResp as the inputs to linear MA models.
LFSBP-LFspike rate Relation
A great deal of indirect evidence supports the hypothesis that LF changes in MSNA contribute to the LF changes in BP. For example, LFSBP has been shown to increase during sympathetic activation, including orthostatic stress, such as lower body negative pressure (7, 41, 52) and upright tilt (9, 20), infusion of vasoactive drugs such as nitroprusside (41), and hypovolemia (26). Similarly, LFSBP power has been shown to decrease significantly during ganglionic blockade in normal subjects (15, 32, 56) and in patients with essential hypertension and multiple system atrophy (15), indicating that it is largely mediated by the sympathetic nervous system. Finally, LFSBP and LFMSNA power exhibited similar increases and decreases during pharmacological infusions of sodium nitroprusside and phenylephrine, respectively (36), and coherence analysis has quantifiably demonstrated that patterns in LFSBP and LFMSNA are correlated at baseline (18, 20) and during HUT in humans (20), whereas HFSBP and HFMSNA are not highly correlated (18).
Conversely, a model of human BP by Myers et al. (31) showed that the sympathetic activity contributes little to the LF oscillations in BP. In the present work, however, we have demonstrated a strong temporal forward and feedback correlation between the LF fluctuations in SBP and the LF changes in MSNA spike rate in healthy humans at rest. The relation also improves when past values of LFspike rate are incorporated to predict the present value of LFSBP (Fig. 6, top) and is unaffected by increased orthostatic load.
The discrepancy in these results may be explained by several differences in protocol. 1) The previous model used normalized arbitrary units of integrated sympathetic burst area to form a sympathetic activity series, whereas our process involved detected sympathetic action potentials. The action potential detection is not based on arbitrary units and is less sensitive to the pass-band noise and artifacts that influence the burst area. 2) We used a physiological maneuver (HUT), rather than vasoactive or metabolic drugs, to induce an increased sympathetic state. These pharmacological agents may block or reduce the ability of the vasculature to accept modulatory sympathetic input, particularly at high doses when operating on the nonlinear portion of the baroreflex curve. 3) For the LF range, Myers et al. (31) elected to use 0.05–0.20 Hz, which is broader than the range recommended by the Autonomic Task Force (0.04–0.15 Hz) (46), although breathing was controlled at a higher frequency (0.25 Hz).
In the present work, we have identified two distinct time constants between LFBP and LFMSNA. The strongest linear relation between LFSBP and LFspike rate occurred near 0 s (average τ = −0.375 s), which results in a highly negative correlation between the two (MSNA is high at low BP, and vice versa). We have termed this the baroreflex “feedback” relation, although the change in LFMSNA often precedes or occurs concurrently with changes in LFSBP. Although several authors have computed the transfer function between sympathetic activity and BP in humans, the phase relation between these components is rarely reported (18, 20). Interestingly, Myers et al. (31) also identified the strongest linear relation between LFSBP and LFMSNA near 0 s and also reported a negative correlation. This finding is also consistent with the 180° neural arc phase relation reported in closed- and open-loop identification of the MSNA-BP relation in animals (22, 25). We hypothesize that this could be a sympathetic response to the change in BP (first deviation), rather than the absolute BP itself (17). This is supported by animal studies that have shown a strong response of baroreceptor afferents to changes in pressure (28).
In this previous model of LFSBP using LFMSNA, Myers et al. (31) chose to use this inverse, feedback relation as the input to their model, which necessitated the use of a negative model coefficient. Instead, we have elected to use the feedforward relation, defined as the maximum positive cross-correlation between LFspike rate and LFSBP (high values of MSNA ultimately leading to high values in BP). This relation is more closely related to the peripheral arc of the closed-loop model used in animal studies (25). The feedforward time delay was found to be ∼5.6 s, meaning a peak in LFSBP occurred 5.6 s after a peak in LFspike rate. This finding supports the reported peripheral arc phase values for animals, which are generally near 180° in the LF range (a 5-s time shift in a 10-s cycle) (25). It has been suggested that this phase shift is the combined result of the fixed physiological processing and transmission times from the baroreflex pathways, along with the slow response of the vascular smooth muscle to increased sympathetic activity (21). However, use of the feedback relation as the input to the LF model results in significantly higher correlations between the measured and predicted LFSBP (r = 0.744 ± 0.03 vs. 0.81 ± 0.03, P < 0.025 for the mean feedforward and feedback time shifts).
HFSBP-HFResp Relation
Oscillations in BP corresponding to respiratory rhythms have been well documented using spectral methods (2, 8, 16). The HF range of the BP variability contains the range of frequencies associated with normal breathing rhythms. Ganglionic blockade has little or no effect on HFBP, suggesting that these oscillations are unrelated to the sympathetic activity and primarily due to changes in intrathoracic pressure caused by the mechanical aspects of respiration (15, 32, 56).
Here we report similar findings. We show that the temporal correlation between HFSBP and HFspike rate is low (r = −0.22 ± 0.04), meaning that vessels act as a neural low-pass filter (55), blocking transmission of the HF oscillations in MSNA to the arterial pressure. On the other hand, respiration has a strong mechanical influence on BP, evidenced by the high temporal correlation (r = −0.79 ± 0.04) between HFSBP and HFResp at rest in the supine position.
The correlation of HFSBP to HFResp was significantly higher than the correlation of HFDBP or HFMBP to HFResp (r = −0.45 ± 0.06 and 0.56 ± 0.08, respectively) at rest. This is consistent with the model proposed by Saul et al. (40), which showed that the mechanical effects of breathing would have a larger impact on SBP than on DBP because of the increased capacitance of the ventricles during systole.
Predictive Model
We have described how the fluctuations in SBP can be predicted by summing an optimized linear combination of past LF spike rate values, which predict LFSBP, and past HFResp values, which predict HFSBP. Using this approach, we were able to generate predicted SBP fluctuation series with good correlations to the measured values at baseline and during graded HUT. The relation between the power of the predicted and measured SBP also indicated that the models were able to explain a large majority of the fluctuations.
The optimized models produced predicted values that were more strongly correlated to the measured SBP fluctuations than a simple slope model, suggesting that some past information from the respiration and sympathetic spike rate contributes to the fluctuations in the SBP. Also, when model coefficients computed at baseline were used to predict the SBP oscillations during varying degrees of HUT, the correlations between measured and predicted SBP values were reasonable but significantly less than those predicted with the optimal models for each recording. This indicates that the relation between BP, sympathetic activity, and respiration changes during orthostatic load and cannot completely be explained by models created during baseline conditions. Indeed, some evidence suggests that the properties of the cardiac baroreflex (HR-BP relation) change during upright tilt (1, 33), but limited information about the sympathetic branch of the baroreflex has been reported during tilt. The results of the current model should be interpreted with caution, however, since a model will always have greater predictive value when its coefficients are reoptimized during each condition, as is the case here.
Limitations
VLF (0.004–0.04 Hz) fluctuations were excluded from the present model mainly because the length of each segment analyzed was too short (∼200 s) for accurate calculation of the influence of oscillations at this frequency range on the SBP. In this study, all subjects maintained a spontaneous breathing rate above 0.15 Hz (in the HF range); however, respiratory frequencies below 0.15 Hz would cause additional respiratory input in the LF range, and an LF model based solely on LFspike rate could not accurately predict changes in LFSBP. The present model takes into account only open-loop properties of the baroreflex system and ignores its closed-loop properties, i.e., feedback from the baroreceptors, which may also contribute to changes in BP and spike rate fluctuations (24). It has also been suggested that CO contributes to mean sympathetic activity (6) and BP fluctuations (31, 50). HR, one of the determinants of CO, has been associated with Mayer wave fluctuations (31). It has also been shown that respiratory fluctuations in BP can largely be explained by respiratory variation in the stroke volume (the other determinant of CO), independent of the vagally mediated changes in HR (50). Therefore, the addition of CO as an input parameter may help explain the remaining variability in the BP oscillations.
In conclusion, we have shown that a simple two-component model of neural sympathetic and mechanical respiratory input can explain the majority of BP fluctuation at rest and during orthostatic stress in a healthy subject.
ACKNOWLEDGMENTS
We thank Sachin Y. Paranjape, Indu Taneja, and Bonnie Black for support of this study.
Footnotes
The costs of publication of this article were defrayed in part by the payment of page charges. The article must therefore be hereby marked “advertisement” in accordance with 18 U.S.C. Section 1734 solely to indicate this fact.
GRANTS
This work was supported in part by National Institutes of Health Grants RR-00095 and 1PO1 HL-56693.
REFERENCES
- 1.Bahjaoui-Bouhaddi M, Cappelle S, Henriet MT, Dumoulin G, Wolf JP, Regnard J. Graded vascular autonomic control versus discontinuous cardiac control during gradual upright tilt. J Auton Nerv Syst. 2000;79:149–155. doi: 10.1016/s0165-1838(99)00068-5. [DOI] [PubMed] [Google Scholar]
- 2.Baselli G, Cerutti S, Badilini F, Biancardi L, Porta A, Pagani M, Lombardi F, Rimoldi O, Furlan R, Malliani A. Model for the assessment of heart period and arterial pressure variability interactions and of respiration influences. Med Biol Eng Comput. 1994;32:143–152. doi: 10.1007/BF02518911. [DOI] [PubMed] [Google Scholar]
- 3.Brychta RJ, Charoensuk W, Bernardi L, Furlan R, Shiavi R, Diedrich A. Spectral analysis of multiunit action potential trains of muscle sympathetic nerve activity in humans. Comput Cardiol. 2002;29:457–460. [Google Scholar]
- 4.Brychta RJ, Tuntrakool S, Appalsamy M, Keller NR, Finney C, Robertson D, Shiavi R, Diedrich A. Spike detection in mouse renal sympathetic nerve activity using the stationary wavelet transform with automated noise level estimation. IEEE Trans Biomed Eng. 2007;54:82–93. doi: 10.1109/TBME.2006.883830. [DOI] [PMC free article] [PubMed] [Google Scholar]
- 5.Chapuis B, Vidal-Petiot E, Orea V, Barres C, Julien C. Linear modelling analysis of baroreflex control of arterial pressure variability in rats. J Physiol. 2004;559:639–649. doi: 10.1113/jphysiol.2004.065474. [DOI] [PMC free article] [PubMed] [Google Scholar]
- 6.Charkoudian N, Joyner MJ, Johnson CP, Eisenach JH, Dietz NM, Wallin BG. Balance between cardiac output and sympathetic nerve activity in resting humans: role in arterial pressure regulation. J Physiol. 2005;568:315–321. doi: 10.1113/jphysiol.2005.090076. [DOI] [PMC free article] [PubMed] [Google Scholar]
- 7.Convertino VA, Ludwig DA, Cooke WH. Stroke volume and sympathetic responses to lower-body negative pressure reveal new insight into circulatory shock in humans. Auton Neurosci. 2004;111:127–134. doi: 10.1016/j.autneu.2004.02.007. [DOI] [PubMed] [Google Scholar]
- 8.Cooke WH, Cox JF, Diedrich AM, Taylor JA, Beightol LA, Ames JE, Hoag JB, Seidel H, Eckberg DL. Controlled breathing protocols probe human autonomic cardiovascular rhythms. Am J Physiol Heart Circ Physiol. 1998;274:H709–H718. doi: 10.1152/ajpheart.1998.274.2.h709. [DOI] [PubMed] [Google Scholar]
- 9.Cooke WH, Hoag JB, Crossman AA, Kuusela TA, Tahvanainen KU, Eckberg DL. Human responses to upright tilt: a window on central autonomic integration. J Physiol. 1999;517:617–628. doi: 10.1111/j.1469-7793.1999.0617t.x. [DOI] [PMC free article] [PubMed] [Google Scholar]
- 10.Daubechies I. Ten Lectures on Wavelets. Capital City Press; Montpelier, VT: 1992. [Google Scholar]
- 11.Davis SN, Shavers C, Costa F, Mosqueda-Garcia R. Role of cortisol in the pathogenesis of deficient counterregulation after antecedent hypoglycemia in normal humans. J Clin Invest. 1996;98:680–691. doi: 10.1172/JCI118839. [DOI] [PMC free article] [PubMed] [Google Scholar]
- 12.DeBoer RW, Karemaker JM, Strackee J. Hemodynamic fluctuations and baroreflex sensitivity in humans: a beat-to-beat model. Am J Physiol Heart Circ Physiol. 1987;253:H680–H689. doi: 10.1152/ajpheart.1987.253.3.H680. [DOI] [PubMed] [Google Scholar]
- 13.Delius W, Hagbarth KE, Hongell A, Wallin BG. General characteristics of sympathetic activity in human muscle nerves. Acta Physiol Scand. 1972;84:65–81. doi: 10.1111/j.1748-1716.1972.tb05158.x. [DOI] [PubMed] [Google Scholar]
- 14.Diedrich A, Charoensuk W, Brychta RJ, Ertl AC, Shiavi R. Analysis of raw microneurographic recordings based on wavelet de-noising technique and classification algorithm: wavelet analysis in microneurography. IEEE Trans Biomed Eng. 2003;50:41–50. doi: 10.1109/TBME.2002.807323. [DOI] [PMC free article] [PubMed] [Google Scholar]
- 15.Diedrich A, Jordan J, Tank J, Shannon JR, Robertson R, Luft FC, Robertson D, Biaggioni I. The sympathetic nervous system in hypertension: assessment by blood pressure variability and ganglionic blockade. J Hypertens. 2003;21:1677–1686. doi: 10.1097/00004872-200309000-00017. [DOI] [PubMed] [Google Scholar]
- 16.Eckberg DL. Physiological basis for human autonomic rhythms. Ann Med. 2000;32:341–349. doi: 10.3109/07853890008995937. [DOI] [PubMed] [Google Scholar]
- 17.Eckberg DL, Sleight P. Human Baroreflexes in Health and Disease. Clarendon; Oxford, UK: 1992. [Google Scholar]
- 18.Floras JS. Sympathetic activation in human heart failure: diverse mechanisms, therapeutic opportunities. Acta Physiol Scand. 2003;177:391–398. doi: 10.1046/j.1365-201X.2003.01087.x. [DOI] [PubMed] [Google Scholar]
- 19.Furlan R, Piazza S, Bevilacqua M, Turiel M, Norbiato G, Lombardi F, Malliani A. Pure autonomic failure: complex abnormalities in the neural mechanisms regulating the cardiovascular system. J Auton Nerv Syst. 1995;51:223–235. doi: 10.1016/0165-1838(94)00135-7. [DOI] [PubMed] [Google Scholar]
- 20.Furlan R, Porta A, Costa F, Tank J, Baker L, Schiavi R, Robertson D, Malliani A, Mosqueda-Garcia R. Oscillatory patterns in sympathetic neural discharge and cardiovascular variables during orthostatic stimulus. Circulation. 2000;101:886–892. doi: 10.1161/01.cir.101.8.886. [DOI] [PubMed] [Google Scholar]
- 21.Hammer PE, Saul JP. Resonance in a mathematical model of baroreflex control: arterial blood pressure waves accompanying postural stress. Am J Physiol Regul Integr Comp Physiol. 2005;288:R1637–R1648. doi: 10.1152/ajpregu.00050.2004. [DOI] [PubMed] [Google Scholar]
- 22.Ikeda Y, Kawada T, Sugimachi M, Kawaguchi O, Shishido T, Sato T, Miyano H, Matsuura W, Alexander J, Jr, Sunagawa K. Neural arc of baroreflex optimizes dynamic pressure regulation in achieving both stability and quickness. Am J Physiol Heart Circ Physiol. 1996;271:H882–H890. doi: 10.1152/ajpheart.1996.271.3.H882. [DOI] [PubMed] [Google Scholar]
- 23.Kamiya A, Hayano J, Kawada T, Michikami D, Yamamoto K, Ariumi H, Shimizu S, Uemura K, Miyamoto T, Aiba T, Sunagawa K, Sugimachi M. Low-frequency oscillation of sympathetic nerve activity decreases during development of tilt-induced syncope preceding sympathetic withdrawal and bradycardia. Am J Physiol Heart Circ Physiol. 2005;289:H1758–H1769. doi: 10.1152/ajpheart.01027.2004. [DOI] [PubMed] [Google Scholar]
- 24.Kawada T, Sato T, Inagaki M, Shishido T, Tatewaki T, Yanagiya Y, Zheng C, Sugimachi M, Sunagawa K. Closed-loop identification of carotid sinus baroreflex transfer characteristics using electrical stimulation. Jpn J Physiol. 2000;50:371–380. doi: 10.2170/jjphysiol.50.371. [DOI] [PubMed] [Google Scholar]
- 25.Kawada T, Sugimachi M, Sato T, Miyano H, Shishido T, Miyashita H, Yoshimura R, Takaki H, Alexander J, Jr, Sunagawa K. Closed-loop identification of carotid sinus baroreflex open-loop transfer characteristics in rabbits. Am J Physiol Heart Circ Physiol. 1997;273:H1024–H1031. doi: 10.1152/ajpheart.1997.273.2.H1024. [DOI] [PubMed] [Google Scholar]
- 26.Kimmerly DS, Shoemaker JK. Hypovolemia and MSNA discharge patterns: assessing and interpreting sympathetic responses. Am J Physiol Heart Circ Physiol. 2003;284:H1198–H1204. doi: 10.1152/ajpheart.00229.2002. [DOI] [PubMed] [Google Scholar]
- 27.Kingma R, TenVoorde BJ, Scheffer GJ, Karemaker JM, Mackaay AJ, Wesseling KH, de Lange JJ. Thoracic sympathectomy: effects on hemodynamics and baroreflex control. Clin Auton Res. 2002;12:35–42. doi: 10.1007/s102860200008. [DOI] [PubMed] [Google Scholar]
- 28.Kirchheim HR. Systemic arterial baroreceptor reflexes. Physiol Rev. 1976;56:100–177. doi: 10.1152/physrev.1976.56.1.100. [DOI] [PubMed] [Google Scholar]
- 29.Mukkamala R, Mathias JM, Mullen TJ, Cohen RJ, Freeman R. System identification of closed-loop cardiovascular control mechanisms: diabetic autonomic neuropathy. Am J Physiol Regul Integr Comp Physiol. 1999;276:R905–R912. doi: 10.1152/ajpregu.1999.276.3.r905. [DOI] [PubMed] [Google Scholar]
- 30.Mullen TJ, Appel ML, Mukkamala R, Mathias JM, Cohen RJ. System identification of closed-loop cardiovascular control: effects of posture and autonomic blockade. Am J Physiol Heart Circ Physiol. 1997;272:H448–H461. doi: 10.1152/ajpheart.1997.272.1.H448. [DOI] [PubMed] [Google Scholar]
- 31.Myers CW, Cohen MA, Eckberg DL, Taylor JA. A model for the genesis of arterial pressure Mayer waves from heart rate and sympathetic activity. Auton Neurosci. 2001;91:62–75. doi: 10.1016/S1566-0702(01)00289-2. [DOI] [PubMed] [Google Scholar]
- 32.Nakata A, Takata S, Yuasa T, Shimakura A, Maruyama M, Nagai H, Sakagami S, Kobayashi K. Spectral analysis of heart rate, arterial pressure, and muscle sympathetic nerve activity in normal humans. Am J Physiol Heart Circ Physiol. 1998;274:H1211–H1217. doi: 10.1152/ajpheart.1998.274.4.H1211. [DOI] [PubMed] [Google Scholar]
- 33.Nollo G, Faes L, Porta A, Antolini R, Ravelli F. Exploring directionality in spontaneous heart period and systolic pressure variability interactions in humans: implications in the evaluation of baroreflex gain. Am J Physiol Heart Circ Physiol. 2005;288:H1777–H1785. doi: 10.1152/ajpheart.00594.2004. [DOI] [PubMed] [Google Scholar]
- 34.Pagani M, Lucini D. Sympathetic contribution to blood pressure variability. Fundam Clin Pharmacol. 1998;12(Suppl 1):42S–47S. doi: 10.1111/j.1472-8206.1998.tb01031.x. [DOI] [PubMed] [Google Scholar]
- 35.Pagani M, Lucini D, Rimoldi O, Furlan R, Piazza S, Porta A, Malliani A. Low and high frequency components of blood pressure variability. Ann NY Acad Sci. 1996;783:10–23. doi: 10.1111/j.1749-6632.1996.tb26704.x. [DOI] [PubMed] [Google Scholar]
- 36.Pagani M, Malliani A. Interpreting oscillations of muscle sympathetic nerve activity and heart rate variability. J Hypertens. 2000;18:1709–1719. doi: 10.1097/00004872-200018120-00002. [DOI] [PubMed] [Google Scholar]
- 37.Pagani M, Montano N, Porta A, Malliani A, Abboud FM, Birkett C, Somers VK. Relationship between spectral components of cardiovascular variabilities and direct measures of muscle sympathetic nerve activity in humans. Circulation. 1997;95:1441–1448. doi: 10.1161/01.cir.95.6.1441. [DOI] [PubMed] [Google Scholar]
- 38.Pan J, Tompkins WJ. A real-time QRS detection algorithm. IEEE Trans Biomed Eng. 1985;32:230–236. doi: 10.1109/TBME.1985.325532. [DOI] [PubMed] [Google Scholar]
- 39.Penaz J. Photoelectric measurement of blood pressure, volume and flow in the finger (Abstract); Digest 10th Int Conf Med Biol Eng Dresden; 1973. p. 104. [Google Scholar]
- 40.Saul JP, Berger RD, Albrecht P, Stein SP, Chen MH, Cohen RJ. Transfer function analysis of the circulation: unique insights into cardiovascular regulation. Am J Physiol Heart Circ Physiol. 1991;261:H1231–H1245. doi: 10.1152/ajpheart.1991.261.4.H1231. [DOI] [PubMed] [Google Scholar]
- 41.Saul JP, Rea RF, Eckberg DL, Berger RD, Cohen RJ. Heart rate and muscle sympathetic nerve variability during reflex changes of autonomic activity. Am J Physiol Heart Circ Physiol. 1990;258:H713–H721. doi: 10.1152/ajpheart.1990.258.3.H713. [DOI] [PubMed] [Google Scholar]
- 42.Shiavi RG. Introduction to Applied Statistical Signal Analysis. Academic; San Diego, CA: 1999. [Google Scholar]
- 43.Stauss HM, Anderson EA, Haynes WG, Kregel KC. Frequency response characteristics of sympathetically mediated vasomotor waves in humans. Am J Physiol Heart Circ Physiol. 1998;274:H1277–H1283. doi: 10.1152/ajpheart.1998.274.4.H1277. [DOI] [PubMed] [Google Scholar]
- 44.Steiglitz K, McBride L. A technique for identification of linear systems. IEEE Trans Automat Contr. 1965;AC10:461–464. [Google Scholar]
- 45.Szucs A. Applications of the spike density function in analysis of neuronal firing patterns. J Neurosci Methods. 1998;81:159–167. doi: 10.1016/s0165-0270(98)00033-8. [DOI] [PubMed] [Google Scholar]
- 46.Task Force of the European Society of Cardiology and the North American Society of Pacing and Electrophysiology Heart rate variability: standards of measurement, physiological interpretation and clinical use. Circulation. 1996;93:1043–1065. [PubMed] [Google Scholar]
- 47.Taylor JA, Eckberg DL. Fundamental relations between short-term RR interval and arterial pressure oscillations in humans. Circulation. 1996;93:1527–1532. doi: 10.1161/01.cir.93.8.1527. [DOI] [PubMed] [Google Scholar]
- 48.Taylor JA, Williams TD, Seals DR, Davy KP. Low-frequency arterial pressure fluctuations do not reflect sympathetic outflow: gender and age differences. Am J Physiol Heart Circ Physiol. 1998;274:H1194–H1201. doi: 10.1152/ajpheart.1998.274.4.H1194. [DOI] [PubMed] [Google Scholar]
- 49.Torrence C, Compo G. A practical guide to wavelet analysis. B Am Meteorol Soc. 1998;79:61–78. [Google Scholar]
- 50.Toska K, Eriksen M. Respiration-synchronous fluctuations in stroke volume, heart rate and arterial pressure in humans. J Physiol. 1993;472:501–512. doi: 10.1113/jphysiol.1993.sp019958. [DOI] [PMC free article] [PubMed] [Google Scholar]
- 51.Vallbo AB, Hagbarth KE, Torebjork HE, Wallin BG. Somatosensory, proprioceptive, and sympathetic activity in human peripheral nerves. Physiol Rev. 1979;59:919–957. doi: 10.1152/physrev.1979.59.4.919. [DOI] [PubMed] [Google Scholar]
- 52.Victor RG, Leimbach WN., Jr Effects of lower body negative pressure on sympathetic discharge to leg muscles in humans. J Appl Physiol. 1987;63:2558–2562. doi: 10.1152/jappl.1987.63.6.2558. [DOI] [PubMed] [Google Scholar]
- 53.Watenpaugh DE, Breit GA, Buckley TM, Ballard RE, Murthy G, Hargens AR. Human cutaneous vascular responses to whole-body tilting, Gz centrifugation, and LBNP. J Appl Physiol. 2004;96:2153–2160. doi: 10.1152/japplphysiol.00198.2003. [DOI] [PubMed] [Google Scholar]
- 54.Welch PD. The use of fast Fourier transform for the estimation of power spectra: a method based on time averaging over short modified periodograms. IEEE Trans Audio Electroacoust. 1967;AU-15:70–73. [Google Scholar]
- 55.Yingthawornsuk T, Kawada T, Sato T, Inagaki M, Sunagawa K, Cox J, Shiavi R, Diedrich A. Identification of open-loop transfer functions in closed-loop baroreflex system using randomized breathing in humans. Comput Cardiol. 2002;29:461–464. [Google Scholar]
- 56.Zhang R, Iwasaki K, Zuckerman JH, Behbehani K, Crandall CG, Levine BD. Mechanism of blood pressure and R-R variability: insights from ganglion blockade in humans. J Physiol. 2002;543:337–348. doi: 10.1113/jphysiol.2001.013398. [DOI] [PMC free article] [PubMed] [Google Scholar]


