Abstract
The 9–23 amino acid region of the insulin B chain (B(9-23)) is a dominant epitope recognized by pathogenic T lymphocytes in nonobese diabetic mice, the animal model for type 1 diabetes. We describe herein similar B(9-23)-specific T-cell responses in peripheral lymphocytes obtained from patients with recent-onset type 1 diabetes and from prediabetic subjects at high risk for disease. Short-term T-cell lines generated from patient peripheral lymphocytes showed significant proliferative responses to B(9-23), whereas lymphocytes isolated from HLA and/or age-matched nondiabetic normal controls were unresponsive. Antibody-mediated blockade demonstrated that the response was HLA class II restricted. Use of the highly sensitive cytokine-detection ELISPOT assay revealed that these B(9-23)-specific cells were present in freshly isolated lymphocytes from only the type 1 diabetics and prediabetics and produced the proinflammatory cytokine IFN-γ. This study is, to our knowledge, the first demonstration of a cellular response to the B(9-23) insulin epitope in human type 1 diabetes and suggests that the mouse and human diseases have strikingly similar autoantigenic targets, a feature that should facilitate development of antigen-based therapeutics.
Introduction
Genetic and environmental factors cooperate to precipitate type 1 diabetes, a spontaneous organ-specific autoimmune disease in humans and in the nonobese diabetic (NOD) mouse (reviewed in refs. 1, 2). The disease is characterized by an initial leukocyte infiltration into the pancreas that eventually leads to inflammatory lesions within islets, a process called “insulitis.” Overt disease is characterized by the subsequent destruction of insulin-producing β cells within the islets, leading to impaired glucose metabolism and attendant complications that are hallmarks of type 1 diabetes.
Although the critical events that trigger the autoreactive process in type 1 diabetes are unclear, destruction of islet β cells in both diabetic patients and the NOD mouse appears to be mediated by the activation of autoreactive T cells that recognize several islet β-cell antigens (βCAs), including insulin, glutamic acid decarboxylase (GAD) 65 and 67 isotypes, heat shock protein 60, and some uncharacterized βCAs (reviewed in refs. 1–3). These antigen specificities have been defined in primary T-cell assays and by the generation of T-cell lines and clones from type 1 diabetic patients and high-risk first-degree relatives and from lymph nodes, spleens, and pancreata of NOD mice. The majority of pathogenic CD4+ T-cell clones derived from pancreata of NOD mice with insulitis or frank diabetes not only recognize insulin, but react specifically with the 9–23 peptide region of the B chain (4–6). Moreover, the 15-23 region of the insulin B chain was identified as a major antigenic epitope recognized by a pathogenic CD8+ T-cell clone after screening an NOD islet β-cell cDNA library expressed in COS cells (expressing MHC class I) as antigen presenting cells (7). In addition, the use of fluorescent-labeled MHC class I tetrameric complexes bound to the B chain 15–23 peptide demonstrated that as much as 87% of CD8+ T cells in the pancreata from young NOD mice recognized this epitope (7). This finding is consistent with the fact that insulin is the only type 1 diabetes–associated autoantigen that has an expression limited to islet β cells and is the most abundantly produced protein by that tissue. Although cellular responses to GAD appear to be required for the initial antipancreatic response in the NOD (8), anti-insulin cellular responses occur shortly after the initial anti-GAD response, presumably as a result of antigenic-spreading within the pancreas (3), and correlate with most of the islet β-cell destruction in the NOD mouse (5, 6, 8, 9).
The B(9–23) response is strongly associated with overt disease in the NOD mouse; however, it is unknown whether this response is observed in human type 1 diabetes. The insulin B(9–23) amino acid sequence is identical in mice and in humans, which suggests that this epitope may play an immunodominant and perhaps a pathogenic role in human disease as well. Indeed, a diagnostic characteristic of human type 1 diabetes is the pronounced humoral response to proinsulin and whole insulin proteins, which is evident by elevated serum levels of anti-insulin antibodies (IAAs) observed in predisease (i.e., high-risk individuals) and patients with recent-onset type 1 diabetes (1, 10). However, there is no compelling evidence for a pathogenic role of autoantibodies in either human or murine type 1 diabetes (11). Rather, the disease is predominantly mediated by autoreactive cellular responses to βCAs (2). Unexpectedly, however, the T-cell proliferative responses to proinsulin or to the whole insulin protein do not appear elevated in prediabetic patients or in those with recent-onset type 1 diabetes compared with normal control subjects (12–18). Although this observation appears inconsistent with the predominant anti-insulin cellular responses found in the NOD disease, it is the insulin B(9–23)-specific response that is characteristic of the murine disease (4–6), and not necessarily the response to whole insulin protein. Therefore, we addressed whether a more restricted-epitope response to insulin is also characteristic of human type 1 diabetes by determining whether elevated insulin B(9–23)-specific cellular responses exist in prediabetic and recent-onset type 1 diabetic patients.
Methods
Subjects.
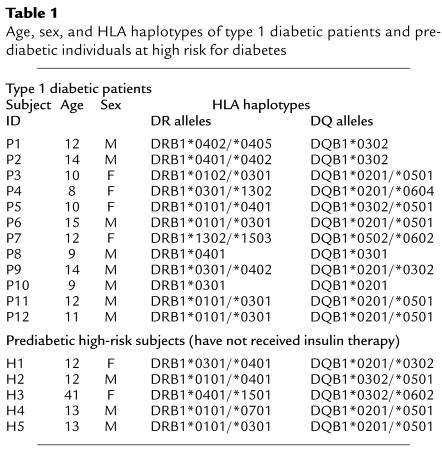
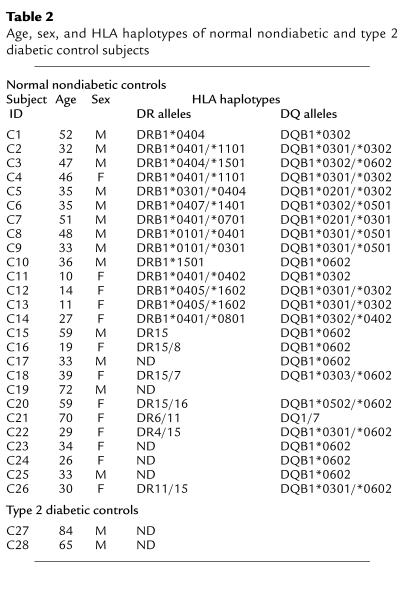
Written and informed consent was obtained from 12 patients with recent-onset type 1 diabetes (P1–P12), five prediabetic first-degree relatives of type 1 diabetics who were at high risk for diabetes (H1–H5), 26 nondiabetic normal control subjects (C1–C26), and two type 2 diabetic control subjects (C27 and C28) who have received insulin therapy for 5 and 20 years, respectively, before enrollment in this study (Tables 1 and 2). Patients were considered to have a recent-onset status within 3 months (i.e., 130 days) of diagnosis. Criteria for patient diagnosis for type 1 diabetes were diabetic ketosis and ketoacidosis, polyuria, polydypsia, and weight loss, followed by assessment of serum autoantibody levels and human leukocyte antigen (HLA) typing.
Table 1.
Age, sex, and HLA haplotypes of type 1 diabetic patients and prediabetic individuals at high risk for diabetes
Table 2.
Age, sex, and HLA haplotypes of normal nondiabetic and type 2 diabetic control subjects
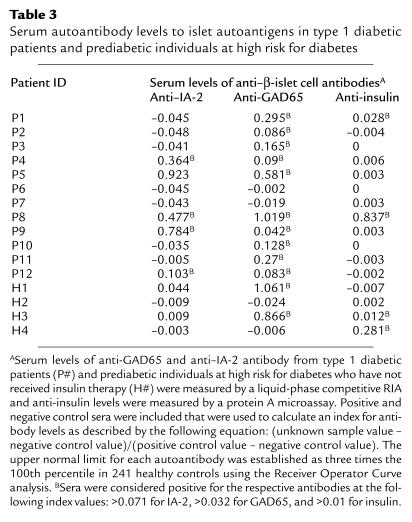
Serum levels of anti-GAD65 and anti–IA-2 antibody were measured by a liquid-phase competitive RIA as described previously (19, 20) and IAA levels were measured by a protein A microassay (21). Positive and negative control sera were included that were used to calculate an index for antibody levels as described by the following equation: (unknown sample value – negative control value)/(positive control value – negative control value). The upper normal limits for each autoantibody serum level were established as three times the 100th percentile in 241 healthy controls, using the Receiver Operator Curve analysis, which were greater than 0.071 (IA-2), greater than 0.032 (GAD65), and greater than 0.01 (insulin) (22). Measurement of serum levels of autoantibodies from the 12 type 1 diabetic patients showed that ten patients were positive for anti-GAD65 antibody, five were positive for anti–IA-2 antibody, and only two were positive for anti-insulin antibody (Table 3). Interestingly, Patient P8 was the only patient who demonstrated a dramatic endogenous anti-insulin antibody response, which was accompanied by substantial anti-GAD65 and anti-IA-2 antibody responses. Criteria for assessing prediabetics at high-risk of diabetes were the following: (a) first-degree relative, (b) expression of disease-associated HLA-haplotypes (i.e., HLA-DR3/4, -DQ2/8; Table 1), and (c) positive for serum autoantibodies (Table 3). Autoantibody levels were secondary to first-degree relative status and HLA haplotype, as only three of four subjects tested were positive for autoantibodies.
Table 3.
Serum autoantibody levels to islet autoantigens in type 1 diabetic patients and prediabetic individuals at high risk for diabetes
HLA typing was done by PCR amplification with sequence-specific primers for DR and DQ alleles (23) at the University of California, Los Angeles, Tissue Typing Laboratory. The majority of type 1 diabetic patients expressed high-risk DQ and DR alleles [i.e., HLA-DQ8 (DQB1*0302; 33%), -DQ2 (DQB1*0201; 58%), -DR3 (DRB1*0301; 58%) and -DR4 (DRB1*0401 to 0405; 42%)] (Table 1), which were also represented in 12 of the first 14 nondiabetic control subjects [i.e., HLA-DQ8 (DQB1*0302; 64%), -DQ2 (DQB1*0201; 21%), -DR3 (DRB1*0301; 21%) and -DR4 (DRB1*0401 to 0405; 79%)] (Table 2). In fact, the high-risk DR4/DQ8 or DR3/DQ2 combinations were present in ten of the 12 patients and in 14 of the 26 nondiabetic normal control subjects. The average age of the type 1 diabetic patient group was 11 ± 3 years (range: 8–15 years), which was represented in three nondiabetic, first-degree relative normal control subjects (C11–C13; 11 ± 1 years) and in four of five high-risk first-degree relative controls (i.e., 12 ± 0.3 years). Control-patient sibling matches included C11 with P1, C12, C13, with P2 and H5 with P12, whereas control patient HLA-haplotype matches were C5 with P9, C11 with P2, and H5 with both P11 and P12. All recent-onset diabetic patients received human insulin therapy after diagnosis, which ranged from 2 to 127 days (mean = 64 days) before blood sampling. To control for the possibility that B(9–23)-specific immune responses developed as a result of insulin therapy, responsiveness to B(9–23) was studied in two patients (C27 and C28) that had type 2 diabetes (i.e., a non–autoimmune-mediated disease) who received insulin therapy because of their suppressed insulin production. In addition, five high-risk first-degree relatives of type 1 diabetics who had not received insulin therapy were also studied for responsiveness to B(9–23). This study was approved by the Investigational Review Boards of the University of California, San Diego, and Children’s Hospital and Health Center.
Peptides, reagents, and tissue culture medium.
The following peptides were synthesized by a solid-phase method as described elsewhere (24): human insulin B-chain (9–23) amide (B(9–23)) [SHLVEALYLVCGERG], sperm whale myoglobin 110-121 (SWM), and biotinylated herpes simplex virus peptide-2 (HSV-2) VP16 430-444 (EEVDMTPADALDDFD). Medium used for all cell cultures and assays was DMEM containing high glucose (Cellgro, Herndon, Virginia, USA) supplemented with 2 mM L-glutamine, 10 mM HEPES (Cellgro), nonessential amino acids (Sigma Chemical Co., St Louis, Missouri, USA), 1 mM sodium pyruvate, 50 μg/ml gentamicin, 126 μg/ml L-arginine, 20 μg/ml L-aspartic acid (Life Technologies Inc., Grand Island, New York, USA), 50 μM 2-Mercaptoethanol (Sigma Chemical Co.), 5 μg/ml penicillin and 100 U/ml streptomycin (Life Technologies Inc.), and 5% autologous human serum or plasma. Azide-free preparations of murine anti-human HLA-DQ (SPV-L3) and HLA-DR (LN3) mAb’s (Neomarkers Inc., Fremont, California, USA) and isotype-matched control mAb’s were used at an optimal concentration (20 μg/ml).
Generation of short-term insulin B(9–23)-specific T-cell lines from peripheral blood.
PBMCs from all subjects were isolated by centrifugation through Ficoll-Hypaque density gradients (Vacutainer CPT; Becton Dickinson Labware, Lincoln Park, New Jersey, USA), and lymphocytes were washed and either stimulated with B(9–23) peptide to generate T-cell lines or stored frozen in aliquots for future evaluation of cytokine production using the ELISPOT assay. Insulin B(9–23)-specific T-cell lines were generated by culturing 5 × 10⁶ purified PBMCs per well of a 24-well culture plate (Falcon; Becton Dickinson Labware) in the presence of 10 μM insulin B(9–23) for 7–10 days. After washing, 3 × 10⁶ T cells were restimulated in 25 cm2 tissue culture flasks with 6 × 10⁵ irradiated (30 Gy) autologous PBMCs as antigen presenting cells (1:5 ratio of antigen-presenting cells/T cells) in the presence of B(9–23) peptide (10 μM) and recombinant human IL-2 (5 U/ml; Boehringer Mannheim, Germany) for another 7–10 days. After an additional stimulation cycle, lymphocytes were used in proliferation assays. Autologous PBMCs used for restimulation of T-cell lines were stored frozen until use.
T lymphocyte–proliferation assay.
A total of 105 T lymphocytes from cell lines were cultured in 96-well round-bottom plates (Costar; Corning Inc., Corning, New York, USA) with 7 × 10⁴ irradiated autologous PBMCs (optimal cell number) in the presence or absence of different concentrations of insulin B(9–23) peptide or phytohemagglutinin (PHA-M; L8902; Sigma Chemical Co.). Cells were cultured at 37°C, 7.5% CO2 atmosphere in a humidified incubator for 5 days, and each well was pulsed with 1 μCi tritiated thymidine ([3H]TdR; sp. act. 25 Ci/mmol; Amersham Life Science, Arlington Heights, Illinois, USA) for the final 18–20 hours. Cells were harvested onto glass fiber-lined plates (Unifilter-96 GF/B; Packard Instrument Co., Meriden, Connecticut, USA) and the amount of radioactivity incorporated into de novo synthesized DNA was measured in a scintillation counter (Top Count NXT; Packard Instrument Co.).
ELISPOT assay.
The number of cytokine-expressing cells in PBMCs from control subjects and type 1 diabetic patients was quantified by the ELISPOT assay as described elsewhere (25). Briefly, 3 × 10⁵ PBMCs obtained from frozen aliquots were seeded per well of 96-well plates coated with anti-human IFN-γ mAb (Endogen Inc., Cambridge, Massachusetts, USA) or other anti-cytokine mAb (PharMingen Inc., San Diego, California, USA) in the presence or absence of either B(9–23) peptide, tetanus toxoid (Accurate Chemical & Scientific Corp., Westbury, New York, USA), or PHA (Sigma Chemical Co.). After 24 to 48 hours of incubation at 37°C, 5% CO2, cells were washed away and cytokines were detected with anti-human IFN-γ (Endogen Inc.) or anti-human IL-2, IL-4, IL-5, or IL-13 (PharMingen Inc.) secondary biotinylated-mAb plus avidin-peroxidase. AEC substrate solution (3-amino-9-ethyl carbazole; Pierce Chemical Co., Rockford, Illinois, USA) was used to develop the reaction, which was stopped by washing the plate with water. Spots derived from cytokine-producing cells were quantified using the Series-1 Immunospot and Satellite Analyzers (Autoimmun Diagnostika Inc., Strassberg, Germany).
Purified HLA-DQ binding assay.
Peptide binding to HLA-DQA1*0301/DQB1*0302 (HLA-DQ8) was assessed using a competitive inhibition Europium fluorometric assay as described previously (26). The 50% inhibitory concentrations (IC50) were calculated from competitive inhibition displacement curves for each peptide and were used as estimates of the peptide-binding affinities to the HLA-DQ8 molecules.
Results
Insulin B(9–23)-proliferative response of PBMCs from patients with recent-onset type 1 diabetes.
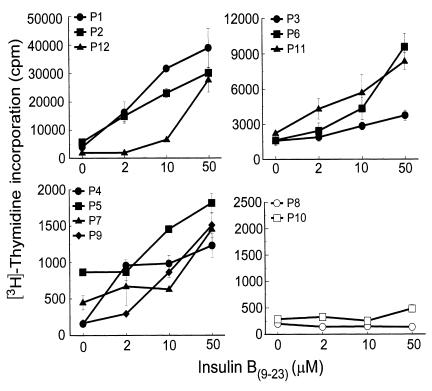
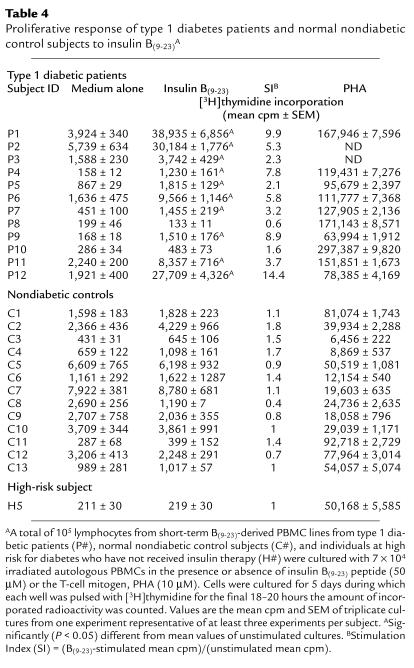
The B(9–23) epitope of insulin appears to be an immunodominant target antigen in NOD mice (4–7). We investigated whether this epitope also played a role in human type 1 diabetes by determining whether cellular responses to insulin B(9–23) had developed in peripheral blood lymphocytes from type 1 diabetic patients. Short-term T-cell lines from 12 recent-onset type 1 diabetic patients and from 13 nondiabetic HLA- or age-matched normal control subjects (C1-C13) and one high-risk first-degree relative (H5) were challenged with insulin B(9–23), and proliferation was assessed. These short-term cell lines were generated to increase the frequency of any B(9–23)-specific T cells before proliferation assays because frequencies of antigen-specific T cells in freshly isolated PBMCs are usually low. Ten of 12 diabetic patients responded to B(9–23) in a dose-dependent manner (Figure 1) and to different degrees (Table 4; mean ± SEM of stimulation index [SI, as described in legend to Table 4] = 6.4 ± 1.2), whereas the response was absent in all nondiabetic control subjects (Table 4; mean ± SEM of SI = 1.1 ± 0.1). An SI greater than 2 was considered positive. Note that the comparison of control-patient sibling-matches (i.e., C11 and P1; C12, C13, and P2; and H5 and P12) and HLA-matches (C5 and P9; C11 and P1, P2; and H5 and P11, P12) underscores the striking association of this B(9–23)-response specifically with the type 1 diabetes group. In some cases with control subject cultures, cell viability appeared to decrease dramatically after the first restimulation cycle, in which case assays were performed after the first stimulation cycle. Lack of responsiveness by control subjects or by the two patients (i.e., P8 and P10) was not attributed to cell death because these individuals responded to the T-cell mitogen, PHA (Table 4). Additionally, B(9–23) responsiveness was specific because these patients did not respond to unrelated control peptides (data not shown). These results demonstrate that the majority (83%) of diabetic patients, but not HLA- or age-matched control subjects, developed a proliferative response to the insulin B(9–23) peptide.
Figure 1.
Type 1 diabetic patient response to insulin B(9–23) peptide. A total of 105 T lymphocytes from short-term cell lines of B(9–23)-treated PBMCs from type 1 diabetic patients (i.e., P1–P12) were seeded per well of a 96-well round-bottom plate with 7 × 10⁴ irradiated autologous PBMCs in the presence or absence of different concentrations of insulin B(9–23) peptide. Cells were cultured for 5 days in which each well was pulsed with [3H]thymidine for the final 18–20 hours, and the amount of incorporated radioactivity was counted. Values in all panels are the mean cpm ± SEM of triplicate cultures from one experiment representative of at least two experiments for all patients.
Table 4.
Proliferative response of type 1 diabetes patients and normal nondiabetic control subjects to insulin B(9–23)A
Insulin B(9–23) peptide presentation by HLA class II molecules.
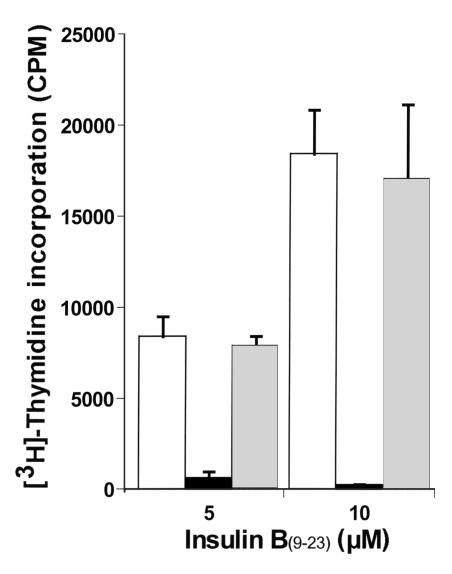
Insulin B(9–23) is an HLA class II–restricted immunodominant epitope for pathogenic CD4+ T cells isolated from the pancreata of young NOD mice (4–6). To confirm that the B(9–23)-response in type 1 diabetic patients is class II restricted, T lymphocytes from B(9–23)-reactive cell lines from patient P2, who is homozygous for HLA-DR4 (DRB1*0402/0405) and DQ8 (DQB1*0302) alleles, were challenged with B(9–23) in the presence or absence of antibodies to DR or DQ molecules, and proliferation was assessed (Figure 2). T lymphocytes from patient P2 were used because the B(9–23) peptide has been shown to bind HLA-DQ8 (DQB1*0302) molecules (26), a haplotype that is among the most strongly associated with, and predictive of, human disease (1, 27). The HLA-DQB1*0302 allele also displays a nonaspartic acid (i.e., alanine) residue in its β chain at position 57, a residue that is also characteristic of the unique disease-associated I-Ag7 MHC haplotype in the NOD mouse (28). Only blockade of DQ molecules during B(9–23) presentation completely inhibited proliferation of the short-term cell line generated from this individual (Figure 2), demonstrating that the disease-associated response to B(9–23) is HLA class II restricted and, in this patient, is restricted to the HLA-DQ8, and not to the DR4, molecule. We also determined the affinity of binding of the B(9–23) peptide to the DQ8 molecule in a competitive displacement binding assay, in which the B(9–23) peptide was evaluated for its ability to compete with the standard high-affinity peptide, biotinyl-(HSV-2)-VP16, for binding to the HLA-DQ8 molecule. B(9–23) efficiently competed for binding to HLA-DQ8 with a binding affinity (IC50 value of 0.4 μM) very similar to the unlabeled (HSV-2)-VP16 peptide (IC50 0.37 μM). A noncompetitive control peptide, SWM(110–121), had an IC50 of greater than 100 μM.
Figure 2.
Role of HLA-DQ8 in insulin B(9–23)-specific response in a type 1 diabetic patient. A total of 105 T lymphocytes from short-term cell lines of B(9–23)-treated PBMCs from type 1 diabetic patient P2, homozygous for HLA-DR4 (DRB1*0402/0405) and DQ8 (DQB1*0302), were treated in the presence or absence of 20 μg/ml anti-DQ or anti-DR blocking antibody. These antibodies were added to stimulator autologous PBMCs 30 minutes before responder T cells were added. Cells were cultured for 5 days during which each well was pulsed with [3H]thymidine for the final 18–20 hours and the amount of incorporated radioactivity was counted. Isotype control antibody had no significant effect on proliferation. Values are the mean cpm ± SEM of triplicate cultures from one experiment representative of three experiments.
Cytokine response by B(9–23)-specific primary PBMCs.
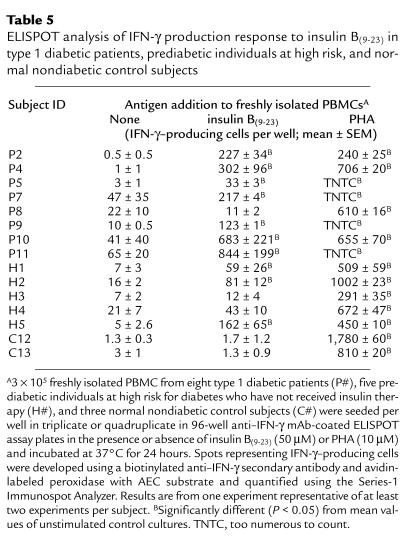
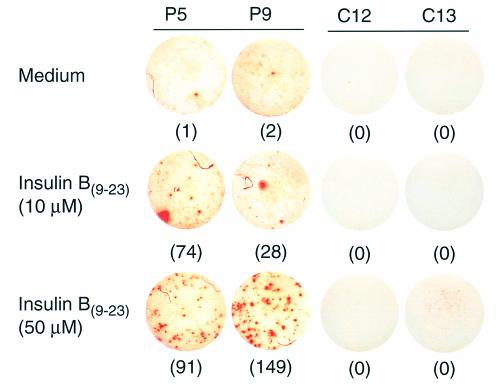
The strong B(9–23)-specific proliferative response of T-cell lines from type 1 diabetic patients suggests that a substantial number of pathogenic (i.e., IFN-γ producing) B(9–23)-specific T cells exist in the circulation of these patients. We therefore estimated the frequency and assessed cytokine production of these B(9–23)-specific cells in freshly isolated PBMCs using the ELISPOT assay. This technique has unique advantages over other cytokine detection assays in that it displays an extremely high degree of sensitivity and can be used to quantify the number of antigen-specific cytokine-producing cells in a heterogeneous T-cell receptor population (25). PBMCs were obtained from diabetic patients and control subjects and presented with B(9–23) or the positive control mitogen, PHA, on ELISPOT plates for assessment of cytokines. IL-2–, IL-4–, IL-5–, or IL-13–producing cells were not detected in either untreated or B(9–23)-treated PBMC cultures from nondiabetic (including high-risk) control or diabetic subjects (data not shown); however, activation of cultures with PHA demonstrated the appearance of these cytokine-producing cells (data not shown). In contrast, treatment with a high dose (50 μM) of B(9–23) induced substantial numbers of IFN-γ–producing cells in PBMC cultures from all but one diabetic patient tested (i.e., P8), whereas all of the nondiabetic control subjects studied were nonresponsive to B(9–23) treatment (Table 5; the mean and SEM of the B(9–23)-induced change [i.e., SI] in the number of IFN-γ–producing cells in control cultures C1–C26 was 1.11 ± 0.2). Samples from C12 and C13 were included in Table 5 as examples of nonresponders. Blood samples from diabetic patients P1, P3, P6, and P12 and control subjects C5, C9, and C11 were not available for cytokine analysis. Type 1 diabetic patients responded in a dose-dependent manner to B(9–23) because a significant number of cytokine-positive cells were induced with a 10 μM B(9–23) dose (see Figure 3 for an example of 10 and 50 μM B(9–23)-induced IFN-γ–specific spots). Lack of response in nondiabetic control samples (i.e., C#), and that of patient P8 and the high-risk subjects, H3 and H4, was not attributed to a general anergy of the cells because cells from these subjects, in addition to those of all diabetic patients (Table 5), responded to treatment with PHA (the mean and SEM of the PHA-induced change in the number of IFN-γ–producing cells in nondiabetic control cultures C1 through C26 was 17 ± 8).
Table 5.
ELISPOT analysis of IFN-γ production response to insulin B(9–23) in type 1 diabetic patients, prediabetic individuals at high risk, and normal nondiabetic control subjects
Figure 3.
Example of cytokine responses to insulin B(9–23) by type 1 diabetic patients and control subjects. 3 × 10⁵ freshly isolated PBMCs from two type 1 diabetic patients (P5 and P9) and two age-matched control subjects (C12 and C13) were seeded per well of a 96-well anti–IFN-γ mAb–coated ELISPOT assay plate in the presence or absence of insulin B(9–23) and incubated at 37°C for 24 hours. Spots representing IFN-γ–producing cells (denoted by the number in parentheses) were developed using a biotinylated anti–IFN-γ secondary antibody and avidin-labeled peroxidase with AEC substrate and quantified using the Series-1 Immunospot Analyzer.
We addressed the possibility that insulin therapy could be responsible for the B(9–23)-specific responses observed. Note that all type 1 diabetics received insulin therapy during a brief period before blood sampling (i.e., 2–127 days), in which P9 and P10 were sampled only 2 days after insulin therapy. This brief 2-day period is not likely to be sufficient for an immune response to develop against exogenous insulin. In addition, the two type 2 diabetics, C27 and C28, who had received insulin therapy for 5 and 20 years, respectively, did not respond to B(9–23) at 50 μM (the mean and SE of B(9–23)-induced change in IFN-γ–producing cells was 0.65 ± 0.22 and 1.02 ± 0.11, respectively, and that for PHA was 179 ± 17 and 49 ± 1, respectively). However, the most compelling evidence that insulin therapy did not play a role in the development of B(9–23) responses in diabetics was demonstrated by the reactivity to B(9–23) by three of five prediabetic high-risk first-degree relatives who never received insulin therapy (Table 5).
Interestingly, one (i.e., P10) of the two patients that did not display a proliferative response to B(9–23) (see Table 4 and Figure 1) showed a strong IFN-γ−production response to the antigen (Table 5), suggesting that antigen-specific responses in cytokine production are not necessarily accompanied by proliferative responses. Accordingly, B(9–23)-induced IFN-γ production by the high-risk first-degree relative, H5 (Table 5), also was not accompanied by a proliferative response (see Table 4 and Figure 1). Consistent with results of T-cell line proliferation, these results demonstrate that the B(9–23)-specific IFN-γ response is limited to type 1 diabetic patients and to high-risk prediabetic individuals. In addition, B(9–23)-specific T cells were of the pathogenic phenotype, as was previously defined in the NOD mouse and, most importantly, can be detected directly in the circulation using the ELISPOT assay.
Discussion
Consistent with the nature of autoantigenic epitopes in the pancreas of NOD mice (4–7), we found substantial T-cell responses to the B(9–23) immunodominant epitope of insulin in peripheral blood of 92% (11 of 12; i.e., proliferative and cytokine responses) of the recent-onset type 1 diabetic patients examined, but such responses were absent in age- or HLA-matched nondiabetic normal control subjects. These anti-insulin B(9–23) T cell responses are not likely to be a result of immunoreactivity to insulin therapy because we did not detect T-cell responses to B(9–23) in the type 2 diabetic control group that received insulin therapy. In addition, these B(9–23) T-cell responses were present in samples from patients P9 and P10 only 2 days after the start of insulin therapy (all other patient samples were obtained 2 to 10 weeks after insulin therapy). Most importantly, three of five prediabetic high-risk individuals who never received insulin therapy responded to B(9–23) in the ELISPOT assay.
It has been previously reported that despite statistically significant differences between control subjects and recent-onset type 1 diabetic patients in cellular responsiveness to βCAs, such as GAD, most control subjects, in fact, respond to the autoantigens, albeit to a lesser degree than do patients with type 1 diabetes (12–16, 29). Interestingly, these studies also demonstrated that the degree and frequency of responses to the whole-insulin or proinsulin proteins were comparable among controls, recent-onset diabetic patients, and their relatives, arguing against the existence of pronounced cellular responses to insulin in type 1 diabetes. However, by analyzing responses to a single insulin epitope [i.e., B(9–23)] that appears to play a strong pathogenic role in the NOD mouse disease, we demonstrate here, for the first time to our knowledge, that control subjects were clearly unresponsive to the B(9–23), which is contrasted with an almost complete responsiveness by the type 1 diabetic patient group and with a responsiveness in over half of the high-risk first-degree relative subjects studied. In fact, the frequency of the cellular response to B(9–23) in these groups was greater than that of the antibody response to any single pancreatic antigen. Our findings with the high-risk first-degree relative group are consistent with another study that shows reactivity to another insulin epitope, amino acid 24–36 of proinsulin, which is confined to first-degree relatives of type 1 diabetics (29). Indeed, the presence of circulating B(9–23)-responsive T cells in recent-onset diabetics was confirmed using the ELISPOT assay in which IFN-γ–producing B(9–23)-responsive peripheral blood cells were detected after 12 days of in vitro culturing in the presence of antigen. These results demonstrate that there is not only a strong specific response to an insulin epitope in human type 1 diabetes, but that this response is confined to the prediabetic and new-onset diabetic groups and, therefore, may be characteristic of the human disease.
We used the ELISPOT assay to analyze the quality and quantity of the B(9–23) response in freshly isolated PBMCs (25), in contrast to enriching for B(9–23) specificity in cell lines for proliferation assays. The high sensitivity of the ELISPOT assay for detection of cytokine-producing cells enabled the quantification of the low-frequency of B(9–23)-reactive cells in freshly isolated PBMCs from type 1 diabetic patients, especially in cases in which B(9–23) failed to generate T-cell lines (i.e., H5 and P10). Indeed, ELISPOT detection of a cytokine response to B(9–23) by some of the subjects in the prediabetic first-degree relative group has implications for a novel diagnostic approach.
Similar to the association of some HLA alleles with type 1 diabetes (27), humoral responses to βCAs, which are usually elevated in prediabetic and recent-onset type 1 diabetes individuals (1, 10), are also predictive of disease. Although it might be expected that both cellular and humoral responses to a particular βCA would be elevated during diabetes, several groups have reported an inverse relationship between cellular and humoral responses to βCAs (15, 30), including those to the whole-insulin protein (12). Interestingly, patient P8, who did not show a cellular (i.e., proliferative or cytokine-production) response to B(9–23) (see Tables 4 and 5; Figure 1), was the only patient that demonstrated a dramatic endogenous anti-insulin antibody response in addition to showing substantial anti-GAD65 and anti-IA-2 antibody responses (see Table 3). Conversely, all other patients demonstrated strong cellular responses to B(9–23), with little or no humoral response to insulin. To date, the mechanism underlying this inverse relationship remains elusive; however, this dichotomy is consistent with the nature of normal immune responses to antigen, which tend to be skewed toward either cellular-promoting (IFN-γ–producing) or humoral-promoting (non-IFN-γ–producing) immune responses (31).
Because type 1 diabetes is primarily mediated by destructive cellular immune responses to βCAs, the lack of a cellular B(9–23) response by patient P8 suggests that responses to other βCAs or other epitopes of insulin play a dominant pathogenic role in this patient. Indeed, the MHC haplotype of patient P8, who lacks HLA-DQB1*0302 expression, may not be able to present the B(9–23) peptide to autoreactive T cells. Alternatively, this unresponsiveness may be a result of reduced antigen [i.e., insulin B(9–23)] concentration in this patient that arose as a consequence of substantial islet β-cell damage, as has been observed in the NOD mouse (4, 6, 7).
Given the nature of this disease, direct evidence for the role of B(9–23) responsive cells in the pathogenesis of diabetes can only be addressed using animal models. Using the NOD mouse model, Wegmann and his colleagues have convincingly demonstrated that B(9–23)-reactive CD4+ T helper cells are involved in the destruction of the β-islet cells (4–6). In addition, Wong et al. (7), using a fluorescent-labeled MHC class I tetrameric complex bound to the B(15–23) peptide, demonstrated that greater than 80% of CD8+ T cells infiltrating islets of 4-week-old NOD mice (well before any clinical evidence of disease) recognized the B(15–23) epitope. Moreover, disease is prevented when thymic deletion of anti-insulin T cells is induced in transgenic NOD mice with targeted expression of the proinsulin gene in antigen-presenting cells under the control of the MHC class II promoter (32). These data and our human subject studies reported herein strongly suggest that this region of the B chain of insulin is a target of the immune system in this autoimmune disease. Thus, therapies that are directed at this autoantigenic response might be of benefit in controlling type 1 diabetes, which is supported by studies that show administration of the B chain or B(10–24) peptide of insulin induce a protective Th2 immune response in NOD mice (6, 33, 34).
Acknowledgments
The authors thank George Eisenbarth (Barbara Davis Center for Childhood Diabetes) for his critical review of the manuscript.
References
- 1.Atkinson MA, Maclaren NK. The pathogenesis of insulin-dependent diabetes mellitus. N Engl J Med. 1994;331:1428–1436. doi: 10.1056/NEJM199411243312107. [DOI] [PubMed] [Google Scholar]
- 2.Delovitch TL, Singh B. The nonobese diabetic mouse as a model of autoimmune diabetes: immune dysregulation gets the NOD [erratum 1998, 8:531] Immunity. 1997;7:727–738. doi: 10.1016/s1074-7613(00)80392-1. [DOI] [PubMed] [Google Scholar]
- 3.Durinovic-Bello I. Autoimmune diabetes: the role of T cells, MHC molecules and autoantigens. Autoimmunity. 1998;27:159–177. doi: 10.3109/08916939809003864. [DOI] [PubMed] [Google Scholar]
- 4.Wegmann DR, Norbury-Glaser M, Daniel D. Insulin-specific T cells are a predominant component of islet infiltrates in pre-diabetic NOD mice. Eur J Immunol. 1994;24:1853–1857. doi: 10.1002/eji.1830240820. [DOI] [PubMed] [Google Scholar]
- 5.Daniel D, Gill RG, Schloot N, Wegmann D. Epitope specificity, cytokine production profile and diabetogenic activity of insulin-specific T cell clones isolated from NOD mice. Eur J Immunol. 1995;25:1056–1062. doi: 10.1002/eji.1830250430. [DOI] [PubMed] [Google Scholar]
- 6.Daniel D, Wegmann DR. Protection of nonobese diabetic mice from diabetes by intranasal or subcutaneous administration of insulin peptide B-(9–23) Proc Natl Acad Sci USA. 1996;93:956–960. doi: 10.1073/pnas.93.2.956. [DOI] [PMC free article] [PubMed] [Google Scholar]
- 7.Wong FS, et al. Identification of an MHC class I-restricted autoantigen in type 1 diabetes by screening an organ-specific cDNA library. Nat Med. 1999;5:1026–1031. doi: 10.1038/12465. [DOI] [PubMed] [Google Scholar]
- 8.Yoon JW, et al. Control of autoimmune diabetes in NOD mice by GAD expression or suppression in beta cells. Science. 1999;284:1183–1187. doi: 10.1126/science.284.5417.1183. [DOI] [PubMed] [Google Scholar]
- 9.Tisch R, et al. Immune response to glutamic acid decarboxylase correlates with insulitis in non-obese diabetic mice. Nature. 1993;366:72–75. doi: 10.1038/366072a0. [DOI] [PubMed] [Google Scholar]
- 10.Bingley PJ, et al. Combined analysis of autoantibodies improves prediction of IDDM in islet cell antibody-positive relatives. Diabetes. 1994;43:1304–1310. doi: 10.2337/diab.43.11.1304. [DOI] [PubMed] [Google Scholar]
- 11.al-Attas OS. Correlates of insulin autoantibodies with beta cell function at the time of diagnosis of diabetes mellitus. Am J Med Sci. 1995;310:138–142. doi: 10.1097/00000441-199510000-00002. [DOI] [PubMed] [Google Scholar]
- 12.Schloot NC, et al. Altered immune response to insulin in newly diagnosed compared to insulin-treated diabetic patients and healthy control subjects. Diabetologia. 1997;40:564–572. doi: 10.1007/s001250050716. [DOI] [PubMed] [Google Scholar]
- 13.Durinovic-Bello I, Hummel M, Ziegler AG. Cellular immune response to diverse islet cell antigens in IDDM. Diabetes. 1996;45:795–800. doi: 10.2337/diab.45.6.795. [DOI] [PubMed] [Google Scholar]
- 14.Dubois-LaForgue D, Carel JC, Bougneres PF, Guillet JG, Boitard C. T-cell response to proinsulin and insulin in type 1 and pretype 1 diabetes. J Clin Immunol. 1999;19:127–134. doi: 10.1023/a:1020558601175. [DOI] [PubMed] [Google Scholar]
- 15.Honeyman MC, Stone N, de Aizpurua H, Rowley MJ, Harrison LC. High T cell responses to the glutamic acid decarboxylase (GAD) isoform 67 reflect a hyperimmune state that precedes the onset of insulin-dependent diabetes. J Autoimmun. 1997;10:165–173. doi: 10.1006/jaut.1996.0124. [DOI] [PubMed] [Google Scholar]
- 16.Ellis T, et al. Cellular immune responses against proinsulin: no evidence for enhanced reactivity in individuals with IDDM. Diabetes. 1999;48:299–303. doi: 10.2337/diabetes.48.2.299. [DOI] [PubMed] [Google Scholar]
- 17.Sarugeri E, et al. Autoimmune responses to the beta cell autoantigen, insulin, and the INS VNTR-IDDM2 locus. Clin Exp Immunol. 1998;114:370–376. doi: 10.1046/j.1365-2249.1998.00744.x. [DOI] [PMC free article] [PubMed] [Google Scholar]
- 18.Semana G, Gausling R, Jackson RA, Hafler DA. T cell autoreactivity to proinsulin epitopes in diabetic patients and healthy subjects. J Autoimmun. 1999;12:259–267. doi: 10.1006/jaut.1999.0282. [DOI] [PubMed] [Google Scholar]
- 19.Falorni A, Ortqvist E, Persson B, Lernmark A. Radioimmunoassays for glutamic acid decarboxylase (GAD65) and GAD65 autoantibodies using 35S or 3H recombinant human ligands. J Immunol Methods. 1995;186:89–99. doi: 10.1016/0022-1759(95)00139-2. [DOI] [PubMed] [Google Scholar]
- 20.Gianani R, et al. ICA512 autoantibody radioassay. Diabetes. 1995;44:1340–1344. doi: 10.2337/diab.44.11.1340. [DOI] [PubMed] [Google Scholar]
- 21.Naserke HE, Dozio N, Ziegler AG, Bonifacio E. Comparison of a novel micro-assay for insulin autoantibodies with the conventional radiobinding assay. Diabetologia. 1998;41:681–683. doi: 10.1007/s001250050968. [DOI] [PubMed] [Google Scholar]
- 22.Verge CF, et al. Prediction of type I diabetes in first-degree relatives using a combination of insulin, GAD, and ICA512bdc/IA-2 autoantibodies. Diabetes. 1996;45:926–933. doi: 10.2337/diab.45.7.926. [DOI] [PubMed] [Google Scholar]
- 23.Chia D, Terasaki P, Chan H, Tonai R, Siauw PA. Direct detection of PCR products for HLA class II typing. Tissue Antigens. 1993;42:146–149. doi: 10.1111/j.1399-0039.1993.tb02183.x. [DOI] [PubMed] [Google Scholar]
- 24.Merrifield RB. Solid phase peptide synthesis. I. The synthesis of tetrapeptide. J Am Chem Soc. 1963;85:2149–2154. [Google Scholar]
- 25.Tary-Lehmann M, Hricik DE, Justice AC, Potter NS, Heeger PS. Enzyme-linked immunosorbent assay spot detection of interferon-gamma and interleukin 5-producing cells as a predictive marker for renal allograft failure. Transplantation. 1998;66:219–224. doi: 10.1097/00007890-199807270-00014. [DOI] [PubMed] [Google Scholar]
- 26.Kwok WW, Nepom GT, Raymond FC. HLA-DQ polymorphisms are highly selective for peptide binding interactions. J Immunol. 1995;155:2468–2476. [PubMed] [Google Scholar]
- 27.Ridgway WM, Fasso M, Fathman CG. A new look at MHC and autoimmune disease. Science. 1999;284:749–751. doi: 10.1126/science.284.5415.749. [DOI] [PubMed] [Google Scholar]
- 28.Reizis B, Altmann DM, Cohen IR. Biochemical characterization of the human diabetes-associated HLA-DQ8 allelic product: similarity to the major histocompatibility complex class II I-A(g)7 protein of non-obese diabetic mice. Eur J Immunol. 1997;27:2478–2483. doi: 10.1002/eji.1830271003. [DOI] [PubMed] [Google Scholar]
- 29.Rudy G, et al. Similar peptides from two beta cell autoantigens, proinsulin and glutamic acid decarboxylase, stimulate T cells of individuals at risk for insulin-dependent diabetes. Mol Med. 1995;1:625–633. [PMC free article] [PubMed] [Google Scholar]
- 30.Roep BO, et al. HLA-associated inverse correlation between T cell and antibody responsiveness to islet autoantigen in recent-onset insulin-dependent diabetes mellitus. Eur J Immunol. 1996;26:1285–1289. doi: 10.1002/eji.1830260616. [DOI] [PubMed] [Google Scholar]
- 31.Swain SL. T-cell subsets. Who does the polarizing? Curr Biol. 1995;5:849–851. doi: 10.1016/s0960-9822(95)00170-9. [DOI] [PubMed] [Google Scholar]
- 32.French MB, et al. Transgenic expression of mouse proinsulin II prevents diabetes in nonobese diabetic mice [erratum 1997, 46:924] Diabetes. 1997;46:34–39. doi: 10.2337/diab.46.1.34. [DOI] [PubMed] [Google Scholar]
- 33.Muir A, et al. Insulin immunization of nonobese diabetic mice induces a protective insulitis characterized by diminished intraislet interferon-gamma transcription. J Clin Invest. 1995;95:628–634. doi: 10.1172/JCI117707. [DOI] [PMC free article] [PubMed] [Google Scholar]
- 34.Maron R, Melican NS, Weiner HL. Regulatory Th2-type T cell lines against insulin and GAD peptides derived from orally- and nasally-treated NOD mice suppress diabetes. J Autoimmun. 1999;12:251–258. doi: 10.1006/jaut.1999.0278. [DOI] [PubMed] [Google Scholar]


