

Abstract
Repeated injury to the stratum corneum of mammalian skin (caused by friction, soaps, or organic solvents) elicits hyperkeratosis and epidermal thickening. Functionally, these changes serve to restore the cutaneous barrier and protect the organism. To better understand the molecular and cellular basis of this response, we have engineered an in vitro model of acetone-induced injury using organotypic epidermal cultures. Rat epidermal keratinocytes (REKs), grown on a collagen raft in the absence of any feeder fibroblasts, developed all the hallmarks of a true epidermis including a well-formed cornified layer. To induce barrier injury, REK cultures were treated with intermittent 30-sec exposures to acetone, then were fixed and paraffin-sectioned. After two exposures, increased proliferation (Ki67 and BrdU staining) was observed in basal and suprabasal layers. After three exposures, proliferation became confined to localized buds in the basal layer and increased terminal differentiation was observed (compact hyperkeratosis of the stratum corneum, elevated levels of K10 and filaggrin, and heightened transglutaminase activity). Thus, barrier disruption causes epidermal hyperplasia and/or enhances differentiation, depending upon the extent and duration of injury. Given that no fibroblasts are present in the model, the ability to mount a hyperplastic response to barrier injury is an inherent property of keratinocytes.
INTRODUCTION
In the skin, epidermal barrier function is maintained by the stratum corneum that represents the end result of programmed keratinocyte differentiation, and is composed of terminally-differentiated keratinocytes interspersed with intercellular lipids (mainly ceramides and sphingolipids) [1]. The barrier function is absolutely essential for protecting the body from external environmental pathogens, UV radiation, and noxious chemicals, as well as for preventing water loss and aiding in thermoregulation. Barrier function can be perturbed in a number of ways, through direct physical injury and indirect physiological responses. For example, severe xerosis (dryness) is characterized by redness, fissuring, scaling, and itching, and results from an inflammatory cascade triggered by cytokines released from the epidermis in response to barrier disruption [2]. In atopic dermatitis, skin barrier disruption alone may set up a chronic inflammatory condition which leads to the pathological manifestations of dermatitis [3]. Barrier function can be impaired by stress-induced changes in hormonal profiles, for example by adrenal glucocorticoids that reduce the production of lipids and intercellular lamellae in the stratum corneum [4].
In the case of acute or subacute perturbations of the skin, e.g., by surfactants, tape stripping, or organic solvents, a rapid recovery phase occurs over the first few hours, which is followed by a period of slower recovery that requires several hours in order to complete barrier restoration. Studies with experimental barrier disruption have revealed a number of changes that appear to play a role in barrier activity including: (i) Release of cytokines that mediate the inflammatory response and may be implicated in lipid synthesis and DNA repair [1, 5] (ii) Changes in the concentrations of calcium and potassium ions that regulate the formation of lamellar bodies and keratinocyte differentiation [2, 6] (iii) Increases in hyaluronan in the matrix that help to regulate the hyperplastic response seen in vivo [7]. However, the relative importance for each of these factors in stimulating and coordinating the restoration of stratum corneum function, is an important and unresolved question.
Studies to understand the molecular mechanisms that are involved in the response to barrier injury can be inherently difficult in the intact skin, since interactions between epidermis, dermis, vascular elements, and nerve endings are difficult to dissect. Hence, a simplified model to study the response of the epidermis to barrier injury, in a well controlled setting in vitro, would be highly desirable. Monolayer cell cultures lack many of the normal physiological features (including the ability to build a cornified layer) that are present in vivo. Instead, tissue engineered models, i.e., three-dimensional (3-D) constructs that mimic the mammalian epidermis in both structure and function, are more suitable to study these phenomena.
While a number of 3-D models exist, such as the Apligraf from Organogenesis [8], Epiderm and Epiderm™ from Mat-Tek [9, 10], and a skin substitute genetically engineered by Morgan et.al. to synthesize and deliver keratinocyte growth factor [11, 12]; the main disadvantage of all 3-D systems with human keratinocytes is that co-culture with fibroblasts is required. For mouse keratinocytes, 3-D cultures are not possible at all unless performed using dead de-epidermized dermal substrates [13, 14]. In contrast, we have been utilizing a 3-D rat keratinocyte model [15] that has several distinct advantages over other systems. In this system, an immortalized line of oral keratinocytes (REK) is grown at the air-liquid interface for a period of five days on a well formed basement membrane, and these cells fully stratify and express all the markers that are seen in the normal epidermis in vivo [16, 17]. The 3-D REK cultures form a well stratified stratum corneum and exhibit significant barrier function [18]. Permeability barrier characteristics of REK organotypic cultures correspond to those in a human skin equivalent model and are similar to normal cadaver skin, as reported in a study by Pasonen et. al, in which the investigators measured transepidermal water loss (TEWL) and corticosterone permeation in REK organotypic cultures [18]. Hence the REK model has barrier properties comparable to human skin, and represents a powerful tool to study responses to epidermal barrier disruption in a well controlled environment in vitro. Another seminal feature of the REK system is that keratinocytes can grow and stratify in the complete absence of any paracrine support from fibroblasts.
Studies by us [7] and others [19, 20] showed that acetone, when applied to the skin of mice, disrupts the barrier (stratum corneum) and causes an epidermal hyperplastic response. The goal of the current study was to test whether superficial barrier disruption of the REK model would induce an epidermal hyperplasia response in vitro, in the absence of any dermal involvement (since the system has no fibroblasts, only keratinocytes). To ask this question, we disrupted the integrity of the stratum corneum in REK organotypic cultures by the repeated application of an organic solvent (acetone). Our results show that even in a purely epidermal system, barrier disruption induces a hyperplastic thickening, accompanied by moderate increases in keratinocyte proliferation. Unexpectedly, at higher levels of damage to the barrier a strong increase in keratinocyte differentiation and cornification was observed. These findings imply that the ability of skin to mount a restorative response to barrier injury is an intrinsic property of the epidermal compartment.
MATERIALS AND METHODS
REK cell line
The REK clone used in this study was isolated by Donald MacCallum [15] from neonatal rat epidermal keratinocytes (a gift from Howard Baden). The cells were grown in Dulbecco’s MEM (1 g glucose/l, 10% fetal bovine serum, 50 mg/ml gentamycin sulfate) at 37 °C in a 5% humidified CO2 incubator. REKs in monolayer culture were passaged after trypsin release (0.05% trypsin in Ca2+, Mg2+-free Earle’s balanced salt solution plus 0.02% EDTA, buffered to pH 7.4 with 20 mM HEPES); cells were seeded at a 1:6 dilution.
Preparation of collagen gels
All procedures were carried out on ice, to prevent premature polymerization of the collagen. Commercially available rat tail collagen I (BD Biosciences, Bedford, MA; 3.9 mg/ml) was mixed with Hank’s salt solution containing phenol red, and buffered with 20 mM HEPES. The pH was adjusted by adding small (25 ml) aliquots of 1 N sodium hydroxide until a pale orange (approximately pH 7), homogeneous solution was formed, being careful to avoid bubble formation during mixing. The homogeneous solution (800 ml/insert) was added to plastic Transwell inserts (Costar; diameter 2.5 cm; pore size 3.0 mm) housed in 6-well cluster plates. Polymerized collagen fibrils were formed after incubation at 37 °C for 2 h in the 5% CO2 incubator. Collagen gels, once formed, were stored immersed in PBS with 50 mg/ml gentamycin sulfate at 4 °C until use. Before use, the gels were soaked thrice in complete DMEM for 20 min, at 37 °C in the incubator.
Preparation of basement membranes
MDCK cells (gift of Donald MacCallum, University of Michigan) were seeded onto the collagen gels at a high density (200,000 cells/2.5 cm insert) in DMEM/10% FBS. The cells were allowed to grow for 21 days and the media changed thrice weekly. The cells were removed by detergent lysis and washed. Briefly, cells were immersed in hypotonic lysis buffer (10 mM Tris-HCl, pH 7.5, with 0.1% bovine serum albumin and 0.1 mM CaCl2) for 10 min at 37 °C in a humidified atmosphere. They were then treated with 0.2% deoxycholate in hypotonic lysis buffer twice for 5 min. Complete removal of adherent MDCK cells was monitored by light microscopy. Collagen gels with denuded basement membranes on their surface were stored at 4°C immersed in PBS with 50 mg/ml gentamycin sulfate until use. Before use, the gels were soaked in PBS thrice for 20 minutes at room temperature followed by a soak in DMEM thrice for 20 min, at 37 °C in the incubator.
Establishment of organotypic cultures
REKs growing in subconfluent monolayers without signs of stratification, were trypsinized and seeded onto inserts containing a collagen-basement membrane at a density of 200,000 to 250,000 cells per 2.5 cm insert. The seeded REKs were then immersed for 48 h in DMEM/10% FBS present both in the upper and lower chambers of the Transwell. When the cells reached confluence, the medium was removed from the upper chamber to expose the cells to air. The medium in the lower chamber was changed daily (3.2 ml) for the duration of the experiment. Typically, studies were carried out for 5 days at 37 °C in the 5% CO2 incubator, with Transwells harvested on the 5th day post lift.
Acetone treatment of REK lift cultures
Acetone (99.7 %, Fischer Scientific) was filtered through a 0.22 um filter and used for three different sets of experiments. Acetone was applied directly to the surface of the air lifted REK cultures as 470 μl aliquots, left on for 30 seconds, then removed with a pipette. Beginning on day 4 post lift, the first treatment was applied, and then at 8 h intervals after that, a second, third, and fourth aliquot was variably applied. Cultures were harvested on the 5th day.
H&E staining and immunohistochemistry
5-day old REK lift cultures were fixed in Histochoice Tissue Fixative MB (Amresco, code H120-1L) overnight at 4 °C, dehydrated in isoparaffinic alcohols (Richard-Allan Scientific), and embedded in paraffin. 5-μm sections were cut and then dried overnight at 40 °C. H&E staining and immunohistochemistry were done using standard protocols. Primary antibodies utilized in this study were polyclonal antibodies including rabbit anti-mouse K10 (1:500, BABCO), goat anti-rat filaggrin (1:2000, a generous gift from Dr. Beverly Dale-Crunk) and rabbit monoclonal Ki67 (1:200, NeoMarker, Inc.). Sections were mounted in Vectashield (Vector, Inc.), viewed with an Olympus BX50 microscope with epifluorescence attachments, and images were captured digitally using a Polaroid DMC-2 camera.
Image processing and analysis of cell viability
Digital TIFF files from the Polaroid DMC-2 camera were analyzed using IPLab Spectrum Software (Signal Analytics, Vienna, Virginia). To adjust for small differences in background staining between slides from different experiments, a region from the collagen gel in each slide was traced out, and its mean integrated density was used as a correction factor to normalize the epidermal intensity values across all experiments. Loss of viability (death) of keratinocytes in hematoxylin-and-eosin stained sections was defined as the presence of cytoplasmic hypereosinophilia and nuclear abnormalities (pyknosis, karyorrhexis, or karyolysis). In addition, for low-power (5x) images in which the finer cellular details could not be discerned, significant epidermal atrophy was used as an additional indicator of tissue death, as confirmed by high power examination.
BrdU uptake studies
At 5-day post lift, medium containing 1:1000 dilution of Bromo-deoxyuridine (BrdU, Amersham Biosciences) was added to the bottom well of the cultures, which were then incubated an additional 2 h and mounted in paraffin. 5-μm sections were cut and dried overnight at 40 °C. The primary antibody utilized in this study was monoclonal anti-mouse NCL-BrdU (1:100, Novocastra Labs). Sections were mounted in Vectamount (Vector Inc.), viewed on the epifluorescence microscope and images captured as described above. Identical exposure times were used for all images captured in a given series.
Fluorescein-Cadaverine uptake studies
At 5-days post-lift, medium containing 100 μM fluorescein-cadaverine (CadavF, Molecular Probes) or an equimolar amount of fluorescein (Molecular Probes) was added to the bottom well of the cultures, which were then incubated an additional 4 h and mounted in OTC (Electron Microscopy Sciences). 5-μm frozen sections were air-dried and fixed in methanol. Sections were mounted in Vectashield, viewed viewed on the epifluorescence microscope and images captured as described above..
Western Blot
The REK layer was peeled away from the collagen matrix and stored at −20 °C. Cells were then centrifuged at 5000 rpm at 4 °C for 1 min followed by a wash with ice-cold PBS. Cells in lysis buffer (7 M urea, 2% IGEPAL, 5% β-mercaptoethanol) were lysed with three 4-s bursts using an ultrasonic probe. Equal quantities of protein, along with prestained molecular size markers (BioRad), were resolved on a 12% SDS-PAGE gel and transferred to PVDF membranes (Immobilon, Millipore Corp). Western blotting with rabbit polyclonal antisera specific for K10 (1:10,000) and filaggrin (1:10,000) was done as described by Sinha, et.al.[21]. Blots were incubated with peroxidase-conjugated goat anti-rabbit IgG and developed using enhanced chemiluminescence reagents (ECL kit, Amersham) followed by exposure to X-ray film (Biomax, Kodak).
RESULTS
The overall goal of this study was to observe and quantitate the changes following barrier injury that occur in an organotypic system which lacks dermal cells or any other dermal components (Fig. 1). One specific aim was to test our hypothesis that barrier injury is an intrinsic property of the epidermal compartment. The other was to ask whether REK organotypic cultures could mimic the changes that one observes in mouse skin in vivo. To address these questions, we turned to a well established method of disrupting stratum corneum integrity, namely the repeated application of acetone over a period of time.
Figure 1. A three dimensional organotypic model of the epidermis using rat epidermal keratinocytes grown on a collagen matrix.

Production of the model epithelium involves a two-step process. First, MDCK cells are grown on a polymerized collagen gel (no dermal cells/components) in a Transwell insert for 3 weeks and are then lysed, leaving behind a fully-functional basement membrane (BM, dotted line). Second, immortalized rat epidermal keratinocytes (REKs) are cultured on the BM and allowed to stratify to produce a stratified epidermis including the stratum corneum (see Materials and Methods).
Acetone treatment affects tissue in a temporally- and spatially-dependent fashion in REK lift cultures
In order to measure the effect of acetone on cell viability, we added 470 μl of acetone to REK cultures for successive time intervals of 30, 90 and 180 seconds and harvested the cultures at 24 hours. Results are shown in Fig. 2. H&E stained sections that were exposed to acetone for 30 seconds showed a slight increase in tissue thickness (data not shown) whereas increasing time spans of acetone exposure (90, and 180 seconds) caused greater thickening at the center of the cultures, but also a marked decrease in viable cell numbers at the edge (Fig. 2K). To characterize this edge effect further, multiple lower-power images (5x objective) were obtained to encompass the entire width of each culture from all conditions (6 cultures/condition), and the length of the nonviable region at each edge was determined (see Materials and Methods for criteria of cell death). These nonviable zones, expressed as a percentage of total length, were as follows: (No. of acetone treatments, mean ± SEM): No Rx, 0%; 1 treatment, 0%; 2 treatments, 5.4 ± 2.2%; 3 treatments, 18.8 ± 8.0%; 4 treatments, 100%. Thus, with the exception of the highest dose examined, REK cells remained morphologically viable throughout the central part (>80%) of each culture after acetone injury. Because the nonviable edge region was found to vary from culture to culture (e.g., a maximum of 20% nonviable on one edge in 3-treatment cultures, but usually less), we defined the middle 50% as the “safe” portion of these cultures to use for subsequent experiments.
Figure 2. Epidermal hyperplasia in response to acetone varies significantly along the length of the specimen.

Representative Hematoxylin and eosin stained sections from an untreated REK culture on the left (A, C, E, and G), and an acetone treated culture (3-treatment, cumulative exposure 90 seconds) on the right (B, D, F, and H). The vertical arrows with horizontal bars denote the stratum corneum (s.c.). Note the thicker stratum corneum as well as the epidermal thickness in the acetone treated sample as opposed to control (A and B). The sections are from the center of the specimen (A and B), transitional zone at ~10% of the culture diameter (C and D), midway between the edge and transition zone (E and F), and from the edge (G and H). Ki67 stain (as described in Materials and Methods) are from a REK culture without treatment (I) and following treatment with acetone (J). Dotted lines, dermal-epidermal junction. Scale bar, 50 μm. (K), Analysis of acetone induced injury and cell death in REK organotypic cultures. REK cultures were treated with successive exposures to acetone as a form of graded injury over time. Paraffin sections were stained with hematoxylin and eosin, and in equally-spaced random fields from each specimen, dead cells were counted (per criteria in Materials and Methods) and reported relative to epidermal BM length (one length = 500 μm). Each bar represents the mean +/− SD of eight microscopic fields (magnification, 200x).
(L), Analysis of viable cell numbers in acetone-treated REK organotypic cultures. REK cultures were treated with successive exposures to acetone as a form of graded injury and stained with anti-Ki67 antibody. Ki67-positive cell counts were counted and normalized to the BM length (one length = 500 μm). Each bar represents the mean +/− SD of eight microscopic fields.
In order to check for possible functional toxicity after exposure to acetone, we stained REK paraffin sections with an antibody to Ki67. At 30 sec of acetone exposure, Ki67-positive cell labeling was comparable to control, but at 90 and 180 sec, the overall Ki67 staining was reduced, indicating an increase in acetone toxicity and a decrease in cell viability with long continuous acetone exposures (Fig. 2L). Therefore, in later experiments the length of each individual acetone exposure was limited to 30 sec.
The acetone-treated sample shown in Fig. 2 (a maximal exposure), illustrates the response observed along the length of the specimen (~50 high-power fields in width). While cell death is observed at the edge, as described above, in the central regions one observes an overall increase in tissue thickness relative to controls. The maximal hyperplastic effect is seen in the center, which contains the healthiest cells. A transitional zone is evident in the acetone samples at ~8–10 fields from the edge; cell death appears in acetone-treated samples but not in controls. As one approaches the edge of the specimen, acetone-treated cultures exhibit complete cell death whereas untreated controls retain a countable number of viable cells (Fig. 2G, H). By Ki67 staining, a suppression of proliferation in acetone-treated specimens began at ~10 fields from the edge, roughly corresponding to the transition zone seen by H&E staining. Hence, for quantification purposes in subsequent analyses, we have only considered the viable tissue that begins approximately 10 high-power fields from the edge of the specimens, and used this cut-off for all untreated and acetone-treated samples.
Acetone treatment results in epidermal hyperplasia with stratum corneum thickening
Acetone exposures longer than 30 sec caused unacceptable amounts of cell death (Fig. 2K). Hence, for subsequent experiments we decided to look at the graded effect of acetone, delivered as multiple applications of acetone but with each application limited to the relatively nontoxic condition of 30 sec. This design yielded two benefits: (i) it avoided extensive cell damage (especially at the center of the cultures), and (ii) it mimicked our in vivo work, wherein acetone was applied twice daily over a one-week period to induce barrier injury in mouse skin [7]. Acetone was applied at different frequencies to air lifted cultures on day 4 and 5 post lift (as described in Materials and Methods), and then the samples were analyzed as frozen or paraffin-fixed sections to assess changes in epidermal parameters. In H&E stained sections, we observed a significant epidermal hyperplastic response following two and three acetone exposures (compare Figs 3A, C, and D, respectively). A marked increase in the total cell numbers was observed in the acetone-treated samples, and was significantly different from control for two-acetone and three-acetone exposures as determined by Student’s t-test (Fig. 3F). We observed few apoptotic cells after three-acetone treatments, whereas nearly-complete cell death was observed after four treatments (Fig. 3E). The stratum corneum was significantly thickened in response to acetone injury, as observed on the H&E stains (Fig. 3C, D) and in the plotted data (Fig. 3G) of three different experiments. Also, the thickened stratum corneum appeared more compact in comparison to the wavy and lacy consistency seen in control cultures.
Figure 3. Hyperplastic response of 3-D organotypic raft cultures to acetone injury.

(A–E) Appearance of the model tissue in the absence of acetone (A), or in response to 1, 2, 3, and 4-treatments (B–E, respectively) (Scale bar, 50 μm). Samples were fixed in paraffin and the sections were cut and stained with the routine H&E stains. The stratum corneum became markedly thickened in response to acetone injury, as observed especially in panel D. (F) Quantitative analysis of viable cell counts. Paraffin sections were stained with hematoxylin and eosin, microscopic images photographed, and the number of viable cells (see Materials and Methods for criteria) was reported per epidermal BM length (one length = 400 μm). Bars represent mean ± SD from 30 fields, pooled from three different experiments on REK lift cultures. Asterisks, difference with respect to control, significant by Student’s t-test, P<0.05 (**) and P<0.025 (*). (G) Quantitative analysis of stratum corneum thickness. Hematoxylin and eosin-stained sections were photographed, the thickness of the stratum corneum (in arbitrary pixel units) was evaluated via image processing, and expressed per BM length (one length = 400 μm). Bars represent mean ± SD of 18 fields, pooled from three different experiments. Asterisk, difference with respect to control is significant by Student’s t-test, P<0.025 (*).
Acetone treatment increases cellular proliferation only at intermediate levels of barrier injury
Given the apparent overall thickening of the acetone treated lift cultures, we asked whether increased cellular proliferation versus decreased cellular loss (via retention of cornified keratinocytes) might be responsible for the observed epidermal thickening. To evaluate the effect of acetone on cell division, we stained 5-day lift tissue with the proliferation marker, Ki67. A significant increase in the number of proliferating cells was observed after two acetone exposures, as quantified by counts of Ki67-positive cells (Fig. 4F) which was significant at P < 0.01 by Student’s t-test. Another interesting finding was an increase in Ki67 stained cells in the suprabasal layers of these cultures (Fig. 4B) as opposed to the untreated samples.
Figure 4. Enhanced cellular proliferation, as revealed by increased Ki67 and BrdU stains in REK organotypic cultures following treatment with acetone.

Acetone-treated samples were sectioned and stained with Ki67 stain (A–C) and BrdU (D–E): (performed as described in Materials and Methods). Representative Images from the center of each culture are shown. (A), No acetone treatment. Scale bar, 50 μm (B), REK cultures that received two-acetone treatments, or (C), three acetone treatments. (D), REK cultures given three-acetone treatments and stained with BrdU. (E), High power view (magnified) to illustrate BrdU-stained cell clusters as described in Results. Dotted lines, dermal-epidermal junction. Crosses, stratum corneum, Scale bar, 25 μm. (F), Analysis of cells stained with Ki67 following treatment with acetone. Ki67 antibody-stained paraffin sections were digitally photographed, positive cell counts using the image processing technique described in Materials and Methods, and counts expressed per epidermal BM length (one length = 400 μm). Each bar is the mean ± SD of 8 images pooled from three different experiments. Asterisks, an increase in proliferation in the two-acetone treated samples is significant at P < 0.01 (**) by Student’s t test. (G), Analysis of cells stained with BrdU following treatment with acetone. Following 2 h of BrdU uptake, cultures were paraffin-fixed, stained, and images captured as described in Materials and Methods. Data are expressed as BrdU-positive cells per epidermal BM length (one length = 500 μm). Bars represent the mean ± SD of ten images pooled from three different experiments. Asterisk, an increase in proliferation in the two-acetone treated samples is significant at P < 0.025 (*) by Student’s t test.
Ki67 is a marker that is present in cells during essentially all phases (G1-, S-, M- and G2) of the cell cycle [22]. For a more stringent study to detect newly proliferating cells, we decided to perform BrdU labeling, with BrdU added 2 hrs prior to the harvest of the REK lift cultures. In two-acetone samples, we observed a significant increase in the number of proliferating cells (Fig. 4G). This data corresponded well with the proliferation seen with Ki67 staining. In three-exposure samples, however, the result was different than at two exposures (and confirmed the Ki67 data). Namely, despite tissue thickening and a measurable increase in total cell numbers, the relative number of BrdU stained cells was decreased in the three-acetone specimens (Fig. 4G).
Another striking finding was the presence of a few isolated areas wherein cells were clustered together, forming a pocket or bud. As shown in Fig. 4D and 4E, these areas were seen very distinctly with BrdU uptake studies and corresponded well with similar areas in the Ki67-labelling studies (Fig. 4C). In both the Ki67 and BrdU specimens, proliferating pockets of cells were seen only in three-acetone exposed samples, as opposed to two-acetone samples or controls.
Acetone treatment leads to increases in early (K10) and late (Filaggrin) markers of epidermal differentiation
Markers of terminal differentiation were significantly increased in a murine model of acetone induced epidermal hyperplasia [7]. To examine these markers in our organotypic system, REK lift cultures were immunostained with the early differentiation marker keratin 10 (Fig. 5A–C) and with the late differentiation marker filaggrin (Fig. 5D–F). In the untreated samples, K10 was seen in the suprabasal and granular layers (Fig. 5A) whereas filaggrin staining was weak and confined to the granular layer (Fig. 5D). This overall expression pattern agrees with the one observed in mouse skin in vivo [7, 23]. After two acetone exposures, minor increases were noted, but after three-acetone exposures the expression levels of K10 (Fig. 5C) and filaggrin (Fig. 5F) were significantly increased. These changes were confirmed biochemically by western blot experiments (Fig. 6), that showed a 1.7-fold increase in K10 (Fig. 6B) and an 11-fold increase in filaggrin (Fig. 6C).
Figure 5. Expression of epidermal differentiation markers is significantly increased in REK lift cultures treated with acetone.
Representative sections immunostained for K10 (A–C), Filaggrin (D–F), or visualized by phase contrast (D′–F′). Panels show REK cultures given (A), no acetone treatment. (B), two-acetone treatments, or (C), three-acetone treatments. Filaggrin stained samples (second row) are paired with corresponding phase images (third row). Dashed lines, dermal-epidermal junction. Dotted lines, top of stratum corneum. Scale bar, 50 μm
Figure 6. Increases in the differentiation markers K10 and filaggrin are confirmed by western blots in acetone-treated REK lift cultures.

Western analysis performed on untreated and acetone-treated samples as described in Materials and Methods. (A), Coomassie stain for the control (None), two (2x), and three (3x) acetone treated REK cultures. (B), Expression of K10, an early marker of differentiation, (C), Filaggrin, a late marker of differentiation, expressed in untreated and acetone treated REK cultures. MW, molecular weight of protein standards in kilodaltons. Numbers beneath protein bands, relative induction (-fold) over untreated controls, determined by densitometry. Each experiment was repeated twice with similar results.
Acetone treatment increases transglutaminase enzyme activity and stratum corneum cross-linking
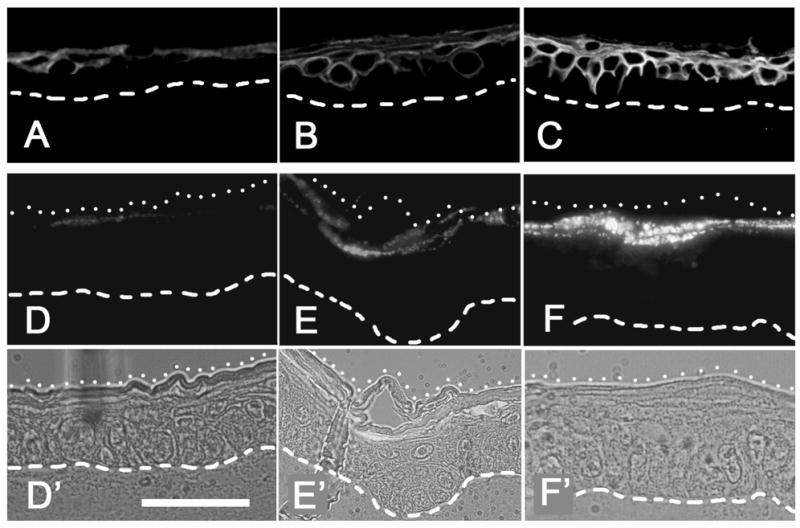
To determine whether acetone treatment influences transglutaminase (TGase) enzymatic activity, we supplemented the culture medium with Cadaverine fluorescein (CadavF) which serves as a TGase substrate [24]. In our system, we have shown that incorporation and cross-linking of CadavF into the tissue is highly specific because an equimolar amount of fluorescein alone, added 4h prior to harvest of the lift tissue, gives a negative signal [24]. For the current experiment, control and acetone-treated samples were evaluated for CadavF incorporation. As shown in Fig. 7A, CadavF incorporation in untreated controls was limited to an area corresponding to the granular/cornified layers of the epidermis, the region where greatest TGase activity is expected. In the control tissue, CadavF incorporation sometimes appeared discontinuous (Fig. 7A). In contrast, CadavF incorporation was dramatically increased after two and three-acetone exposures and showed many areas of oversaturated signal intensity (Fig. 7B and C). The most notable effect was a continuous uptake/incorporation of CadavF along the entire length of the stratum corneum, as opposed to the discontinuous pattern in controls.
Figure 7. Acetone-treated REK cultures show heightened transglutaminase activity.

Representative immunostained sections for fluorescein-cadaverine, a substrate of transglutaminase that becomes incorporated into the stratum corneum. (A), Control. (B), two-acetone, and (C) three-acetone treated REK cultures. Lift cultures treated with fluorescein alone were negative for incorporation (data not shown). Dashed lines, dermal-epidermal junction. The experiment was performed twice with similar results.
DISCUSSION
In this paper we have shown that it is possible to induce a hyperplastic epidermal response in an organotypic culture system in response to barrier injury. Our data suggests that acanthosis (thickening) is an inherent property of the epidermal compartment, and that repeated barrier injury is required to develop hyperplasia of the epidermis. Perhaps most surprisingly, we find that high levels of barrier injury, instead of promoting a more proliferative phenotype, appears to advance the keratinocyte differentiation program as evidenced by an increase in transglutaminase-mediated cross-linking and formation of a thickened stratum corneum. Our data demonstrate a continuum of response. Thus, after moderate injury (two acetone exposures), the tissue prepares for increased proliferation and activates pathways to replace the dead or injured cells. This includes an observed increase in Ki67 and BrdU labeling (heightened mitotic activity) in the basal and suprabasal layers of the skin equivalents. In response to higher levels of injury (three acetone exposures), we observe a relative suppression of this proliferative phenotype as the tissue seems to move towards differentiation.
Others have presented evidence to support the notion that cells (in this case, keratinocytes) must undergo cell-cycle withdrawal and growth-arrest, before differentiation can proceed and the expression of differentiation-related genes can occur [25, 26]. After low levels of injury (up to two acetone exposures), no appreciable change in the expression of common differentiation markers like K10 and filaggrin was noted in our system at a time when proliferation was maximal in the model epidermis. However, at three exposures, when proliferation was inhibited, we saw an induction of K10 and filaggrin protein expression in the cultures (as measured by immunohistochemistry and western blots). Transglutaminase activity may be a more sensitive indicator of early changes leading to growth-arrest and differentiation. In control cultures, CadavF uptake was discontinuous and discernible only at low levels, whereas after only two acetone treatments, CadavF incorporation was maximally observed along the full length of the acetone-treated tissue. Overall, the changes in proliferation and differentiation observed in the REK system seem to relate very well to physiological changes that are expected in the intact epidermis.
Certain features of our organotypic culture model are unique, and deserve further discussion. The model is based upon an immortalized line of keratinocytes (REK) that have proven themselves highly capable of reproducing many normal physiological responses of epidermis [15–18]. A vital feature of the model is the presence of a well-developed basement membrane provided by first culturing a renal cell line (MDCK) on the collagen gel in order to lay down an authentic, native basement membrane (BM) prior to replacing the MDCK cells with REKs. This provides the following advantages: (i) a proper substrate for attachment of keratinocytes; (ii) the development of true hemidesmosomes, proven by electron microscopy [16]; (iii) prevention of leakage of macromolecules such as hyaluronan from the epidermis [17]; (iv) a signaling environment for proper progression of the keratinocyte differentiation program, resulting in a functional stratum corneum [17, 18]. The presence of the BM is almost certainly needed for the fine-tuning of keratinocyte responses to injury via integrin signaling, release of stored growth factors, or both. Koria et al. [27] used a human keratinocyte organotypic model to study acetone-mediated barrier disruption and subsequent gene expression (see below). In their system, a commercial tissue-engineered product (‘Epiderm’, from MatTek, Inc.), the basement membrane is not likely to be fully competent because human keratinocytes grown in serum-free media without fibroblasts cannot produce all necessary components of the BM [28]. In contrast, the REK system offers some distinct advantages and provides confidence that the observed response to superficial injury closely mimics events that occur in the intact epidermis in vivo.
Koria et al. [27] have reported changes in gene expression after acute barrier disruption in a tissue-engineered human skin equivalent ‘Epiderm’, following a single 10-minute exposure to acetone. Using cDNA microarrays, they reported a biphasic epidermal response to barrier injury that featured an up-regulation of a number of genes involved in signal transduction and inflammation early on, followed by genes related to growth and lipid synthesis at a later time. In their experiments, the emphasis was on the development of global gene expression profiles that could be used as molecular ‘signatures’ in engineered tissues, to develop criteria for assessing suitability of tissues for transplantation. Thus, their emphasis was on mRNA levels. Our work, in contrast, explores the changes in morphology (measured by histology, immunochemistry and Western analysis) that occur as a result of acetone injury in REK cultures, focusing upon protein expression which is the final endpoint of gene expression. Besides the previously-mentioned difference in the BM in our study as compared with Koria et al. [27], another difference was the conditions used to induce barrier injury. Initially we tried a single 10-min exposure to acetone, but this caused massive cell death in the REK system (data not shown). In fact, 30 seconds was the longest contact time that did not cause unacceptable toxicity in the REKs (Fig. 2). The different sensitivities of rat and human epidermal equivalents may relate to the thinner stratum corneum in the rodent system as compared to its human counterpart. In an effort to find an injury protocol that produces hyperplasia, yet is relatively nontoxic in the REK system, we attempted to imitate barrier disruption protocols that typically work in vivo, i.e., twice-daily application of acetone on the skin of mice [7] or humans [29] for several days in a row. Although we found that three intermittent 30 sec applications were the maximum that REK lift cultures could tolerate over a ~24 h time period, significant hyperplasia was nevertheless observed (Fig. 2). Further refinement of the model, by reducing the acetone contact time and extending the cumulative experiment over several days, may produce hyperplastic changes greater than those reported here.
Another interesting finding in our study was the presence of ‘cell clusters’ that stain positive for BrdU in the basal layer of our REK cultures after three-exposures to acetone. We believe that these small groups of cells may represent transit-amplifying proliferative clones that are adding to the overall thickness of these cultures in the absence of increased overall cellular proliferation. This might help to explain the increase in total thickness of the epidermal equivalents at a time when the rest of the tissue is seen to exhibit pronounced differentiation. There is also a possibility that these cells start rapidly proliferating only in the presence of a sub-maximal injury, which we see with three-acetone exposures but not at lower doses. If these turn out to be transient amplifying cells or stem cells that are positive for p63 [30], exciting possibilities for using the REK/acetone system for improving clinical application of epithelial cultures for cell therapy, and for studying epithelial tumorigenesis, could emerge.
Perhaps the most notable conclusion that we discern from our study is that the epidermis, by itself, is capable of mounting an appropriate response to barrier injury. The REK 3-D system contains no cellular dermal component, blood vessels, nor nerve endings. Hence, any changes in the proliferation and differentiation program observed after acetone injury in our cultures occurs in the absence of any paracrine or endocrine input. Autocrine influences from the epidermal cells themselves, of course, are likely to play a role in these proliferative and differentiation responses. Understanding the latter response is of particular interest, since terminal differentiation of keratinocytes to build the stratum corneum represents the main contributor to barrier formation in the skin. In summary, our model is an elegantly simple system to observe epidermal changes following barrier disruption in a clearly-defined environment in which dermal influences need not be considered. The REK system provides a useful, physiologically-relevant in vitro model of barrier injury for researchers interested in understanding the responses of keratinocytes to acute or chronic forms of epidermal injury.
Acknowledgments
This work was supported by NIH/NIAMS grant 1 R01 AR049249.
Abbreviations used
- BM
basement membrane
- REK
rat epidermal keratinocyte
- K10
keratin 10
- TGase
transglutaminase
- CadavF
fluorescein-cadaverine
Footnotes
Publisher's Disclaimer: This is a PDF file of an unedited manuscript that has been accepted for publication. As a service to our customers we are providing this early version of the manuscript. The manuscript will undergo copyediting, typesetting, and review of the resulting proof before it is published in its final citable form. Please note that during the production process errors may be discovered which could affect the content, and all legal disclaimers that apply to the journal pertain.
References
- 1.Lampe MA, Williams ML, Elias PM. Human epidermal lipids: characterization and modulations during differentiation. J Lipid Res. 1983;24:131–140. [PubMed] [Google Scholar]
- 2.Elias PM, Wood LC, Feingold KR. Epidermal pathogenesis of inflammatory dermatoses. Am J Contact Dermat. 1999;10:119–126. [PubMed] [Google Scholar]
- 3.Proksch E, Holleran WM, Menon GK, Elias PM, Feingold KR. Barrier function regulates epidermal lipid and DNA synthesis. Br J Dermatol. 1993;128:473–482. doi: 10.1111/j.1365-2133.1993.tb00222.x. [DOI] [PubMed] [Google Scholar]
- 4.Denda M, Tsuchiya T, Elias PM, Feingold KR. Stress alters cutaneous permeability barrier homeostasis. Am J Physiol Regul Integr Comp Physiol. 2000;278:R367–372. doi: 10.1152/ajpregu.2000.278.2.R367. [DOI] [PubMed] [Google Scholar]
- 5.Elias PM, Feingold KR. Does the tail wag the dog? Role of the barrier in the pathogenesis of inflammatory dermatoses and therapeutic implications. Arch Dermatol. 2001;137:1079–1081. [PubMed] [Google Scholar]
- 6.Menon GK, Elias PM. Ultrastructural localization of calcium in psoriatic and normal human epidermis. Arch Dermatol. 1991;127:57–63. [PubMed] [Google Scholar]
- 7.Maytin EV, Chung HH, Seetharaman VM. Hyaluronan participates in the epidermal response to disruption of the permeability barrier in vivo. Am J Pathol. 2004;165:1331–1341. doi: 10.1016/S0002-9440(10)63391-3. [DOI] [PMC free article] [PubMed] [Google Scholar]
- 8.Trent JF, Kirsner RS. Tissue engineered skin: Apligraf, a bi-layered living skin equivalent. Int J Clin Pract. 1998;52:408–413. [PubMed] [Google Scholar]
- 9.Monteiro-Riviere NA, Inman AO, Snider TH, Blank JA, Hobson DW. Comparison of an in vitro skin model to normal human skin for dermatological research. Microsc Res Tech. 1997;37:172–179. doi: 10.1002/(SICI)1097-0029(19970501)37:3<172::AID-JEMT2>3.0.CO;2-Q. [DOI] [PubMed] [Google Scholar]
- 10.Boelsma E, Gibbs S, Faller C, Ponec M. Characterization and comparison of reconstructed skin models: morphological and immunohistochemical evaluation. Acta Derm Venereol. 2000;80:82–88. [PubMed] [Google Scholar]
- 11.Erdag G, Morgan JR. Allogeneic versus xenogeneic immune reaction to bioengineered skin grafts. Cell Transplant. 2004;13:701–712. doi: 10.3727/000000004783983594. [DOI] [PubMed] [Google Scholar]
- 12.Andreadis ST, Hamoen KE, Yarmush ML, Morgan JR. Keratinocyte growth factor induces hyperproliferation and delays differentiation in a skin equivalent model system. FASEB J. 2001;15:898–906. doi: 10.1096/fj.00-0324com. [DOI] [PubMed] [Google Scholar]
- 13.Carroll JM, Moles JP. A three-dimensional skin culture model for mouse keratinocytes: application to transgenic mouse keratinocytes. Exp Dermatol. 2000;9:20–24. doi: 10.1034/j.1600-0625.2000.009001020.x. [DOI] [PubMed] [Google Scholar]
- 14.Hildebrand HC, Hakkinen L, Wiebe CB, Larjava HS. Characterization of organotypic keratinocyte cultures on de-epithelialized bovine tongue mucosa. Histol Histopathol. 2002;17:151–163. doi: 10.14670/HH-17.151. [DOI] [PubMed] [Google Scholar]
- 15.MacCallum DK, Lillie JH. Evidence for autoregulation of cell division and cell transit in keratinocytes grown on collagen at an air-liquid interface. Skin Pharmacol. 1990;3:86–96. doi: 10.1159/000210855. [DOI] [PubMed] [Google Scholar]
- 16.Tammi RH, Tammi MI, Hascall VC, Hogg M, Pasonen S, MacCallum DK. A preformed basal lamina alters the metabolism and distribution of hyaluronan in epidermal keratinocyte “organotypic” cultures grown on collagen matrices. Histochem Cell Biol. 2000;113:265–277. doi: 10.1007/s004180000128. [DOI] [PubMed] [Google Scholar]
- 17.Passi A, Sadeghi P, Kawamura H, Anand S, Sato N, White LE, Hascall VC, Maytin EV. Hyaluronan suppresses epidermal differentiation in organotypic cultures of rat keratinocytes. Exp Cell Res. 2004;296:123–134. doi: 10.1016/j.yexcr.2004.01.031. [DOI] [PubMed] [Google Scholar]
- 18.Pasonen-Seppanen S, Suhonen TM, Kirjavainen M, Miettinen M, Urtti A, Tammi M, Tammi R. Formation of permeability barrier in epidermal organotypic culture for studies on drug transport. J Invest Dermatol. 2001;117:1322–1324. doi: 10.1046/j.0022-202x.2001.01529.x. [DOI] [PubMed] [Google Scholar]
- 19.Man MQ, Feingold KR, Elias PM. Exogenous lipids influence permeability barrier recovery in acetone-treated murine skin. Arch Dermatol. 1993;129:728–738. [PubMed] [Google Scholar]
- 20.Denda M, Wood LC, Emami S, Calhoun C, Brown BE, Elias PM, Feingold KR. The epidermal hyperplasia associated with repeated barrier disruption by acetone treatment or tape stripping cannot be attributed to increased water loss. Arch Dermatol Res. 1996;288:230–238. doi: 10.1007/BF02530090. [DOI] [PubMed] [Google Scholar]
- 21.Sinha AK, Anand S, Ortel BJ, Chang Y, Mai Z, Hasan T, Maytin EV. Methotrexate used in combination with aminolaevulinic acid for photodynamic killing of prostate cancer cells. Br J Cancer. 2006;95:485–495. doi: 10.1038/sj.bjc.6603273. [DOI] [PMC free article] [PubMed] [Google Scholar]
- 22.Borue X, Lee S, Grove J, Herzog EL, Harris R, Diflo T, Glusac E, Hyman K, Theise ND, Krause DS. Bone marrow-derived cells contribute to epithelial engraftment during wound healing. Am J Pathol. 2004;165:1767–1772. doi: 10.1016/S0002-9440(10)63431-1. [DOI] [PMC free article] [PubMed] [Google Scholar]
- 23.Maytin EV, Lin JC, Krishnamurthy R, Batchvarova N, Ron D, Mitchell PJ, Habener JF. Keratin 10 gene expression during differentiation of mouse epidermis requires transcription factors C/EBP and AP-2. Dev Biol. 1999;216:164–181. doi: 10.1006/dbio.1999.9460. [DOI] [PubMed] [Google Scholar]
- 24.Mack JA, Li L, Sato N, Hascall VC, Maytin EV. Hoxb13 up-regulates transglutaminase activity and drives terminal differentiation in an epidermal organotypic model. J Biol Chem. 2005;280:29904–29911. doi: 10.1074/jbc.M505262200. [DOI] [PubMed] [Google Scholar]
- 25.Saunders NA, Jetten AM. Control of growth regulatory and differentiation-specific genes in human epidermal keratinocytes by interferon gamma. Antagonism by retinoic acid and transforming growth factor beta 1. J Biol Chem. 1994;269:2016–2022. [PubMed] [Google Scholar]
- 26.Poumay Y, Pittelkow MR. Cell density and culture factors regulate keratinocyte commitment to differentiation and expression of suprabasal K1/K10 keratins. J Invest Dermatol. 1995;104:271–276. doi: 10.1111/1523-1747.ep12612810. [DOI] [PubMed] [Google Scholar]
- 27.Koria P, Brazeau D, Kirkwood K, Hayden P, Klausner M, Andreadis ST. Gene expression profile of tissue engineered skin subjected to acute barrier disruption. J Invest Dermatol. 2003;121:368–382. doi: 10.1046/j.1523-1747.2003.12364.x. [DOI] [PubMed] [Google Scholar]
- 28.Woodley DT, Krueger GG, Jorgensen CM, Fairley JA, Atha T, Huang Y, Chan L, Keene DR, Chen M. Normal and gene-corrected dystrophic epidermolysis bullosa fibroblasts alone can produce type VII collagen at the basement membrane zone. J Invest Dermatol. 2003;121:1021–1028. doi: 10.1046/j.1523-1747.2003.12571.x. [DOI] [PubMed] [Google Scholar]
- 29.Elias PM. Stratum corneum defensive functions: an integrated view. J Invest Dermatol. 2005;125:183–200. doi: 10.1111/j.0022-202X.2005.23668.x. [DOI] [PubMed] [Google Scholar]
- 30.Pellegrini G, Dellambra E, Golisano O, Martinelli E, Fantozzi I, Bondanza S, Ponzin D, McKeon F, De Luca M. p63 identifies keratinocyte stem cells. Proc Natl Acad Sci U S A. 2001;98:3156–3161. doi: 10.1073/pnas.061032098. [DOI] [PMC free article] [PubMed] [Google Scholar]