Abstract
Statement of problem
Limited studies have indicated that an alternative small color difference formula would be more appropriate for use in dentistry.
Purpose
The purposes of this study were to determine which color difference formula provides a superior degree of fit for judgments of perceptibility and acceptability and to determine if different groups of evaluators have different levels of perceptibility and acceptability for each color difference formula.
Material and methods
Each observer from 4 groups (4 dentists, 4 dental assistants, 4 technicians, and 4 patients) made independent observations of perceptibility and acceptability judgments on pairs of opaque porcelain (Vita Omega 900) disks (14 mm in diameter by 3 mm thick). Color differences of the pairs were calculated using ΔE*ab, ΔECMC(l:c), and ΔE2000 color difference formulas, and the observer judgments were regressed to each color difference independently for perceptibility and acceptability. The area under the receiver operator curves was calculated and ranked, and the optimal factor for the CMC (Colour Measurement Committee, Society of Dyers and Colourists, Great Britain) color difference formula was chosen. A repeated measures maximum likelihood ANOVA (α=.05) was applied to determine statistical significance of fit among the observer groups, and the various color difference formuls for both perceptibility and acceptability. Tukey-Kramer Adjustment (α=.05) was used as a post hoc test.
Results
A difference in the degree of fit of the judgments of color differences was found for the 3 formulas(P=.001) and the 2 judgment types (P<.001) studied, with no significant interaction (P=.979). The Tukey-Kramer test identified a lower degree of fit for the ΔE*ab formula compared to ΔECMC(2:3) and ΔE2000 formulas. No significant difference was found in the mean judgment levels among the observer groups (P=.474) studied, nor within any interaction (P>.404).
Conclusions
ΔE2000 and ΔECMC(2:3) color difference formulas provide a better fit to the calculated color differences, therefore providing better indicators of human perceptibility and acceptability of color differences between tooth colors.
Clinical Implications.
The ΔE2000 and ΔECMC(2:3) color difference formulas should be considered for use in clinical instrumental color analysis, rather than the traditional ΔE*ab formula.
The importance of dental appearance has been documented,1,2 with esthetic dentistry offering a positive effect on a patient’s self-esteem.3 A clinically successful color match is an important aspect for an esthetic dental restoration. Unfortunately, the study of color and the development of dental esthetic materials have not transferred to clinically relevant situations.4,5 This is evident from recent clinical studies evaluating porcelain crowns in the area of color match. The traditional metal-ceramic crowns were mismatched (clinically acceptable or unacceptable) in color to the adjacent teeth over 60% of the time,6,7 while the newer, esthetic, all-ceramic crowns were mismatched nearly 45% of the time.8,9
Instrumental color analysis offers an advantage over visual shade matching as it is objective, quantifiable, and rapidly obtained. The current paradigm shift in the matching and color replication processes in restorative dentistry consists of the use of instrumental color analysis to obtain quantitative values for the shade matching phase. These values could then be used to replicate the porcelain to be matched to the intended color of the adjacent teeth using proven theories.10,11 To be successful in furthering this proposed paradigm shift, the establishment of 4 fundamental principles is needed. These principles include the use of an optical arrangement for instrumental color analysis that is suitable for translucent materials, determining well-defined color difference parameters of perceptibility and acceptability for different observer groups, determining an appropriate color difference formula suitable for teeth, and, finally, the use of an appropriate color space (where teeth colors are commonly found) during research.
Clinically relevant color difference parameters are the magnitudes of color difference (ΔE) that, separately, are perceptible and acceptable by human observers. Perceptibility refers to detection of color difference between a tooth and an adjacent colored restoration, while acceptability refers to the color difference that would be acceptable for that restoration.12
Refining the color difference formula for use in dentistry is important to allow better correlation of perceptibility and acceptability to instrumental color difference values. Improved correlation will provide a more accurate clinical interpretation of the color differences that result in research targeted at improving the color replication process in dentistry.
The CIELAB based color difference (ΔE) formula (Equation 1), introduced in 1976 and recommended by the International Commission on Illumination, defined a color space (L*a*b*) in which L* represents lightness, and a* and b* are the chromaticity (C*ab) coordinates. As a* and b* values increase, the chroma of color increases. Hue, or the angle between a* and b* in the color space, is defined as H*ab.13 This formula has been used extensively and almost exclusively used internationally in the dental research community. ΔE for the CIELAB formula is defined by the following equation13:
| (Equation 1) |
where Δ represents the difference between the object being measured and its reference.
It is noted that the CIELAB is a transformation of the 2-degree color matching data.14 Teeth viewed at approximately 0.5 m or farther subtend a good deal less than a 2-degree visual angle, and it is reasonable to believe that the transformation relevant to tooth color match might not be a simple isotropic transformation of CIELAB. For this and other reasons, it may be necessary to use different weightings for ΔL*, ΔC*, and ΔH*. An ideal color difference formula will provide appropriate linear transformation so that equal distance in chromaticity will correspond to equal perceptible and acceptable color differences for dentition. This will provide accurate instrumental quantitative values of color.
Following this recommendation, the CMC formula (Equation 2) was developed by the Colour Measurement Committee (CMC), Society of Dyers and Colourists, Great Britain. The SL, SC, and SH components are special basic weighting factors. The values of “l” and “c” are additional weighting factors and are chosen to provide the appropriate weighting of differences in lightness and chroma. This formula is defined by the equation15:
| (Equation 2) |
Within the formula, the components of C*ab and ΔH*ab may also be defined as follows16:
| (Equation 3) |
| (Equation 4) |
In 2001, a new CIE 2000 color difference formula equation (Equation 5) was officially adopted as the new CIE color difference equation.17 This equation is based on CIELAB as well, and includes lightness, chroma, and hue weighting functions, as well as an interactive term between chroma and hue differences for improving the performance for blue colors and a scaling factor for CIELAB a* scale for improving the performance for gray colors. This new formula is:
| (Equation 5) |
The prime notation refers to the respective CIE color parameters in the CIE 2000 uniform color space. The RT, SL, SC, and SH terms are weighting factors for this formula. The 3 k terms are additional weighting factors that were each set to 1 in this study.
Reported perceptible ΔE*ab color differences in in vitro studies over a wide range of color space were approximated,18 and, when limited to dental porcelain colors, in the range of 1 to 2.19 For color matching industrial professionals, an acceptable ΔE*ab color difference was the perceptible color difference.18 Acceptable color differences for dental professionals range from a ΔE*ab of 2.620 or 3.321 for in vitro studies to 3.7 for an in vivo study.22 This in vivo study, however, used a small area colorimeter which has edge loss23 in the color measurement of human teeth. Edge loss is the phenomenon that occurs when light, illuminating a translucent material, would ordinarily be seen by the eye but is simply not measured by the sensor due to the configuration of the illuminant, sensor, and aperture. This occurs during conventional reflectance measurements of translucent materials when both the illumination and observation light paths travel through an aperture.
Acceptable color differences using ΔECMC(1:1) in an in vitro study were found to be different among observer groups with different levels of involvement in the clinical application of dental color matching: 2.7 for patients, 2.2 for dentists, and 1.8 for dental assistants.20 However, there are no studies identified that have evaluated the perceptibility or acceptability of dental colors using the most recently proposed CIE color difference formula, ΔE2000.
The specific aims of this study are to determine which color difference formula provides a superior degree of fit of judgments of perceptibility and acceptability by human observers to calculate small color differences, and to determine if groups with different levels of involvement in the clinical application of dental color matching have different perceptibility and acceptability levels for each color difference formula found to be superior.
MATERIAL AND METHODS
As an overview of this study, porcelain disks were fabricated to fit within a device that showed pairs of disks which ranged in color difference from nearly zero to approximately 4.5 CIELAB units, verified by a color measuring instrument. These pairs were shown in computer-generated, random order to observers representing 4 different levels of clinical involvement, each group consisting of men and women. Each observer independently made perceptibility and acceptability judgments for every pair repeatedly. Color differences were calculated for every pair using ΔE*ab, ΔECMC(3:2), ΔECMC(2:1), ΔECMC(1:2), ΔECMC(1:1), ΔECMC(2:2), ΔECMC(3:2), and ΔE2000 color difference formulas, and the observer judgments were regressed to each color difference independently for perceptibility and acceptability using logistic regression. The areas under the Receiver Operator Characteristic (ROC) curve24 were used to assess degree of fit. Perceptibility and acceptability levels were determined at 50% probability levels.
The intent was to have the base disk similar to the mean tooth color in a previous study (L* = 73.3, a* = 4.7, b* = 18.8).25 The strategy for color distribution of the disks was meant to vary from the base shade separately in the +L*, +a*, and +b* directions by 0.5, 1.0, 1.5, 3.0, and 4.5, resulting in 1 disk without any color difference and 15 other disks with varying color differences. The actual measurements for the 5 disks that varied in the +L* directions were 0.5, 1.1, 2.0, 3.3, and 4.8 CIELAB units. For the +a* direction, the disks actually varied by 0.1, 0.6, 1.3, 2.8, and 4.5 CIELAB units. The disks that varied in the +b* direction were 0.8, 1.3, 1.9, 3.4, and 5.1 CIELAB units. The total ΔE*ab color differences of 16 disks in the wheel from the base shade were 0.2, 0.5, 0.8, 0.8, 1.0, 1.1, 1.3, 1.4, 2.0, 2.0, 2.8, 3.4, 3.5, 4.5, 4.8, and 5.2 CIELAB units, which agreed well with the intended color differences, considering the variability associated with weighing the powders and firing the disks. All disk colors fell within the established color range of central and lateral incisor and canine teeth from a published study.25
All porcelain disks, 14 mm in diameter by 3 mm thick, were fabricated using mixtures of Vita Omega 900, Vitapan 3-D master opaque powders, and pink, white, and mauve color opaque powders (Vident Inc, Brea, Calif). The base shade porcelain and porcelains which varied by approximately +4.5 CIELAB units in each of the L*, a*, and b* directions from the base shade were made at the powder concentrations given in Table I. These 4 primary mixtures were then proportionately mixed together to obtain additional desired colors, shades between the original colors. Target color differences between the base porcelain and these additional disks were 0.5, 1.0, 1.5, and 3.0 CIELAB units in each of the positive L*, a*, and b* directions.
Table I.
Concentrations (weight %) of porcelain powder ingredients for base shade porcelain and shades which varied from base shade by approximately +4.5 CIELAB units in each of L*, a* and b* directions
| Porcelain Powder Ingredients | ||||||||||
|---|---|---|---|---|---|---|---|---|---|---|
| Shade | Pink | White | 3R1.5 | 3L2.5 | 3L1.5 | 5M1 | 1M2 | 3M3 | 3M1 | Mauve |
| Base | 0.0 | 0.0 | 45.7 | 0.0 | 0.0 | 0.0 | 27.6 | 0.0 | 20.8 | 5.9 |
| +4.5L* | 9.1 | 18.6 | 0.0 | 0.0 | 0.0 | 0.0 | 52.9 | 0.0 | 19.4 | 0.0 |
| +4.5a* | 44.6 | 0.0 | 23.4 | 0.0 | 18.9 | 0.0 | 0.0 | 13.1 | 0.0 | 0.0 |
| +4.5b* | 0.0 | 0.0 | 0.0 | 5.5 | 0.0 | 39.8 | 19.9 | 34.8 | 0.0 | 0.0 |
Two separate porcelain disks of the base shade and 1 disk of all other shades were formed using the opaque firing schedule recommended by the manufacturer, except that an increased predrying time (changed from 2 minutes to 10 minutes at 600°C) was implemented due to the bulk of material (Vita Vacuum 200; Vident Inc). The surface to be observed for each disk was polished using silica paper (Leco Corp, St. Joseph, Mich) sequentially up to 800-grit paper. Each disk was measured for color 4 times using a colorimeter (Chromameter CR-200b; Minolta, Ramsey, NJ) and averaged. The color of the base shade was L* = 74.5, a* = 2.7, and b* = 13.1, and the disk with negligible color difference made from the same mixture was L* = 74.5, a* = 2.6, and b* = 13.3. The color difference between these 2 disks was calculated to be ΔE*ab = 0.2.
Human subject approval was obtained by the Institutional Review Board of The Ohio State University to perform this study. Sixteen subjects were recruited, with 4 subjects in each of the following groups: dentists, dental assistants, technicians, and patients. The dentist group included dentists whose clinical practice is primarily restorative dentistry and who are therefore involved with dental colors and related color differences. The dental assistants group included assistants with limited clinical involvement pertaining to dental colors. The technician group included dental technicians involved in fixed prosthodontics who understand shade differences but generally have low involvement in its direct application clinically. The patient group included patients with limited knowledge of the materials used or the shade selection process but who may have become involved clinically with tooth color for their own or a dependent’s teeth. Female and male observers were equally represented in all observer groups except the technician group, where there were 3 men and 1 woman.
Observers in the dentist group were recruited from among full- and part-time faculty members and residents from The Ohio State University College of Dentistry, and from private practitioners in the region. Those in the dental assistant, technician, and patient groups were recruited from staff working in and outside the College of Dentistry. All subjects were financially remunerated for their participation. Gender balance was accomplished within each observer group to the extent possible.
The inclusion criteria for this study required that subjects be at least 18 years of age, willing to spend several hours taking the color blindness test (AO H-R-R Optical test), 26 the Porcelain Color Discrimination Test (PCDT), and willing to sign the informed consent. Subjects excluded from the study were those who were color vision deficient as determined by the color blindness test (AO H-R-R Optical Test), subjects with any psychiatric, cognitive, or social (for example, alcoholism or drug abuse) conditions that would interfere with giving consent and cooperation, and prisoners.
The AO H-R-R Pseudoisochromatic Plates26 is commonly used as a color blindness test. It was developed by the Inter-Society Color Council Subcommittee on Color Blindness Studies. The test can be used for 3 purposes: as a screening test, as a qualitative diagnostic test to classify type of color defect, and as a quantitative diagnostic test to indicate the degree of the color defect. The test is administered under balanced lighting and the subjects are asked to view a series of 6 screening plates of various colors with various symbols (O, X, and Δ). The clinical coordinator asks the subject 3 sets of questions: “How many colored symbols do you see here?” Then, “What are they?” And lastly, “Where are they?” The observer is considered to have normal color vision if correct responses are given for all 6 screening plates.
The PCDT used in this study is a modification of the Composite Resin Color Discrimination Test created and used in a preliminary study.20 The PCDT wheel held 16 porcelain disks for pairing and 1 additional practice disk to be used as subjects were introduced to the test. This wheel rotated to allow any 1 disk in the wheel to be immediately left of the standard base shade disk, which was placed to the right of the wheel and consistently formed half of a pair. As shown partially in Figure 1, A, a cover of neutral gray was cut out so as to allow only 1 disk on the wheel and the standard base shade disk of the PCDT to be viewed. A mask was also placed over the porcelain disks, cut to simulate the size and shape of natural teeth with simulated gingiva along the cervical portions of each tooth. A movable neutral gray shutter concealed the movement of the wheel as it rotated.
Figure 1.
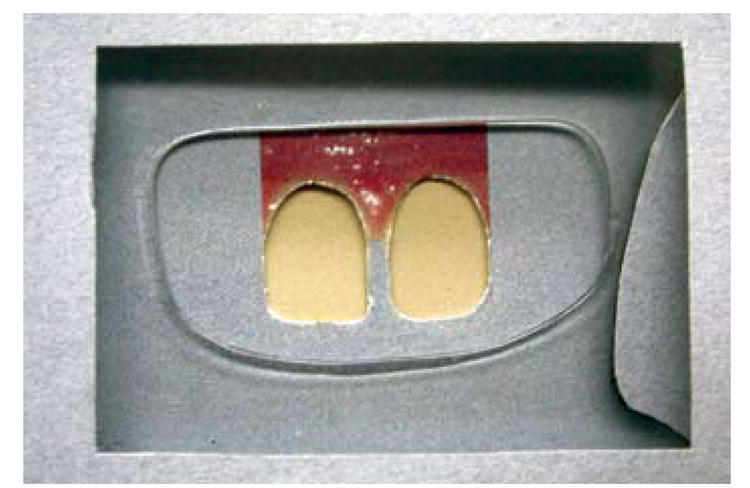
Porcelain color discrimination test wheel cover with edge of open shutter visible toward right. Pair shown has negligible color difference.
The PCDT (Fig. 2) was viewed within a color booth (Macbeth SpectraLight Booth; New Windsor, NY) with daylight (D65) illumination. The observer’s head was positioned by an optometrist’s frame just outside the light booth 0.5 m from the disk pair. Once positioned, the observer viewed the PCDT set at a 0-degree angle normal to the disk pair. The PCDT was positioned so that the pair was at a 45-degree angle to the daylight source in the color booth. The rotatable wheel was attached to a stepping motor (Slo-Syn Motor, Rockford, Ill) connected to its controller (VXM-1 Stepping Motor Controller; Velmex Inc, Bloomfield, NY). A controlled electric power supply moved the shutter, and a computer monitor and keyboard were accessible for an observer to read questions and indicate his or her judgments. For each pair to be assessed, the wheel was rotated with the shutter closed, maintaining a consistent time and nearly consistent sound of rotation, even when the next pair to be viewed was identical to the previous pair. The PCDT showed every pair to be evaluated 50 times, except the 1 pair with negligible color difference, which was shown 250 times. The 1000 pair showings were presented in random order separately for each judgment type. A compiled program (Microsoft BASIC Professional Development System Version 7.0; Microsoft Corp, Redmond, Wash) controlled the movement of the shutter, the random selection of the pair to be viewed, the rotation of the wheel, the display of the question requesting the judgment, the recording of all judgments, and the code for the observer.
Figure 2.
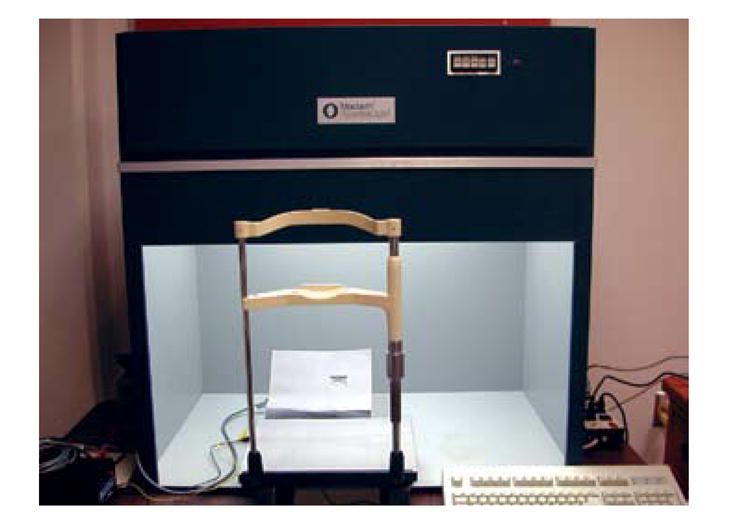
Porcelain color discrimination test apparatus, which includes optometrist’s frame/chin rest, porcelain color discrimination test wheel within Macbeth SpectraLight Booth, and computer keyboard used by subjects next to booth.
After an observer was positioned, a trial set consisting of a pair with negligible color difference and a pair with obvious color difference was presented to help familiarize the observer with the test protocol. The first question asked of an observer when viewing a pair and making perceptibility judgments was, “Do these 2 disks match in color?” The observer was prompted to “Tap M if they Match in color, or N if they do Not match in color.” When the question was answered, the PCDT shutter closed, the wheel rotated to the next random position, and the shutter opened to reveal the next disk pairing.
Following the completion of the perceptibility judgments, the observer was then asked, “Would you want a crown of the color on the left placed in your mouth next to a tooth of the color on the right?” The observer was then prompted to “Tap A for Accept if you want the crown of the color on the left, or R for Reject if you do not want the crown of the color on the left.” As before, following each answer, the PCDT shutter was closed, the wheel rotated to the next random position, and the shutter opened to reveal the next disk pairing, for a total of 1000 acceptability judgments.
For each question asked, the observer was also presented with the option of either tapping “T to take a break, or the minus sign - to change your previous answer.” When an observer desired to take a break, all completed answers were stored, and when the observations were resumed, only the pairings that remained were presented. Subjects were requested to take a 5-minute break every 30 minutes of evaluation to minimize fatigue and frustration.
Color differences according to the formulas being studied were calculated for the differences between each of the 16 disks and the base disk. For the ΔE2000 color difference formula, all djustment (k) values were set equal to 1. Calculations of color differences and statistical analyses of the data were performed using statistical software (SAS, Release 8.2; SAS Institute Inc, Cary, NC). The PCDT data were analyzed by applying logistic regression analysis for each observer, judgment type, and color difference formula studied. A total of 256 logistic regressions and areas under each ROC curve were generated.
The areas under the ROC curves were averaged over all subjects for each formula and judgment type studied. The ΔECMC(l:c) formula, which demonstrated simply the optimum fit of all ΔECMC(l:c) formulas studied, was selected for subsequent statistical analyses. Using the areas under the ROC curves for all observers for each judgment type and formula (ΔE*ab, ΔE2000, and ΔECMC (loptimum:coptimum), a repeated measures maximum likelihood analysis of variance (RM-ANOVA, α=.05) determined if there were significant differences among the judgment types and the formulas, and if there was an interaction. A Tukey-Kramer test (α=.05) was used to make pairwise comparisons of the average areas. Only the formula or formulas determined to be superior were then used in determining the level of perceptibility and acceptability for each observer.
The results of logistic regression were used to determine the 50% ΔE point of an observer’s judgments for each judgment type and ΔE formula. The 50% ΔE point was defined as the color difference at which an observer had a 50% probability of making either dichotomous judgment as determined from the logistic regression equation. The 50% ΔE point was the level of perceptibility and acceptability, respectively, for each of these judgment types. Separately, for each formula found to be superior, an RM-ANOVA determined any statistically significant differences of the averages of the 50% ΔE points among the observer groups, and the judgment types and within the interaction, with subsequent post-hoc testing using the Tukey-Kramer test (α=.05).
RESULTS
Examples of logistic regressions and ROC curves are presented based on the degree of fit in these regressions. Figure 3 shows the probability plotted according to the logistic regression with the observed frequencies of responses for a patient judging perceptibility as related to the ΔE*ab color difference formula, with the area under the ROC curve located at the lower 25 percentile. Figure 4 shows the corresponding ROC curve for these judgments. Figure 5 shows the probability plotted according to the logistic regression with the observed frequencies of responses for a dentist judging perceptibility as related to the ΔE2000 color difference formula, with the area under the ROC curve located at the upper 25 percentile. Figure 6 is the corresponding ROC curve.
Figure 3.
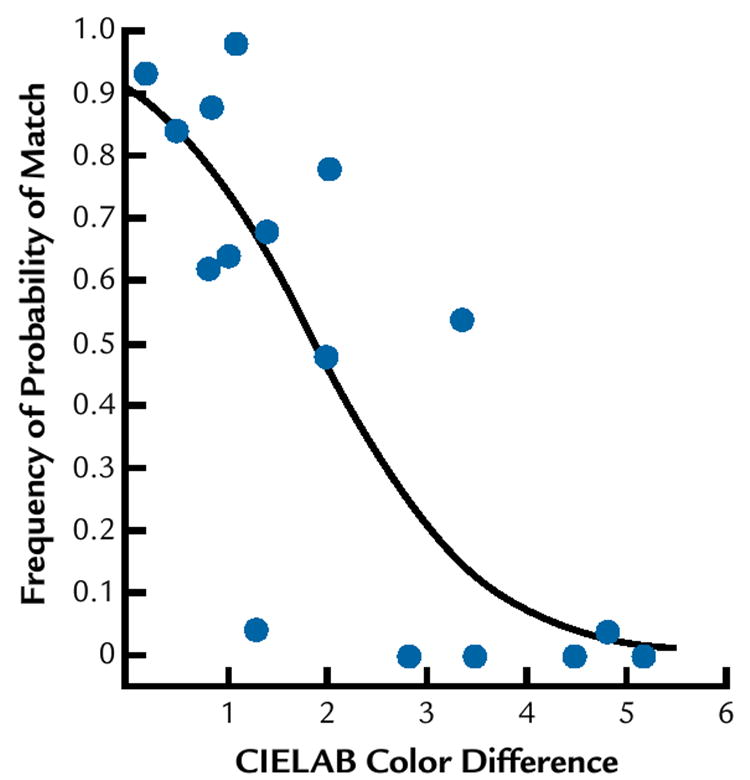
Observed frequencies (*) of match response to perceptibility judgments for patient, with associated logistic regression probability (curved line) as function of ΔE*ab color difference (CIELAB Color Difference).
Figure 4.
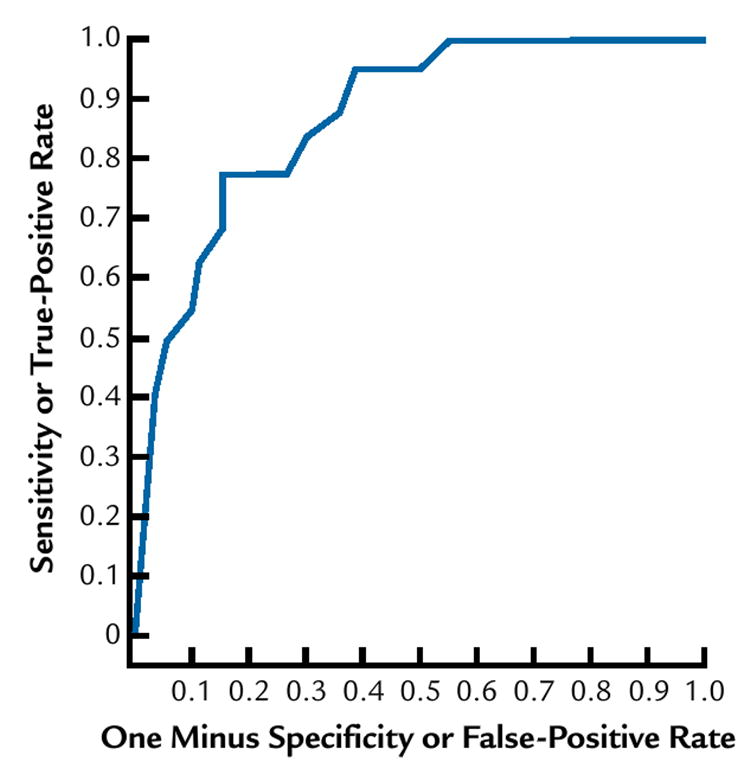
Receiver operating characteristic curve for patient (same as for Fig. 3) for ΔE*ab color differences studied.
Figure 5.
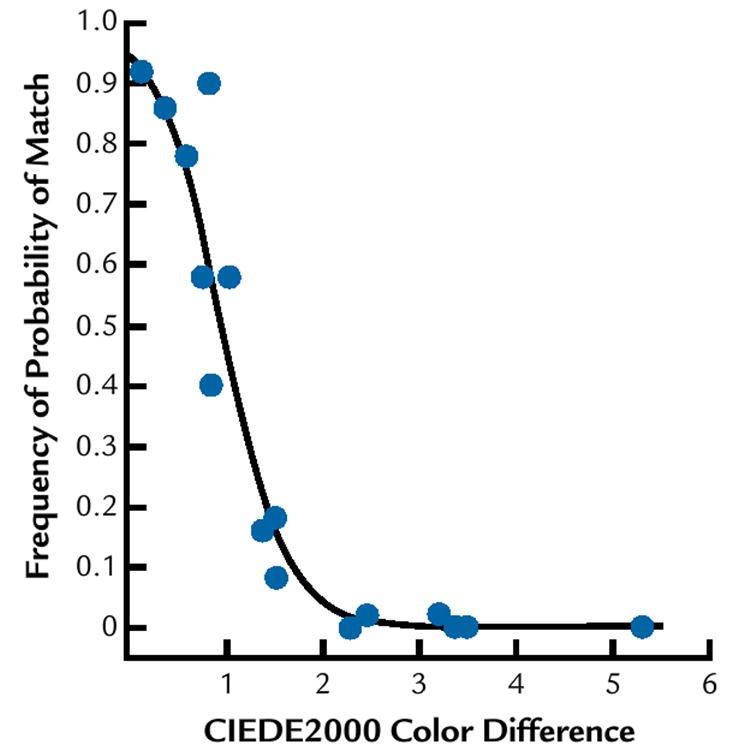
Observed frequencies (*) of perceptibility judgments for dentist, with associated logistic regression probability (curved line) as function of ΔE2000 color difference (CIELAB2000 Color Difference).
Figure 6.
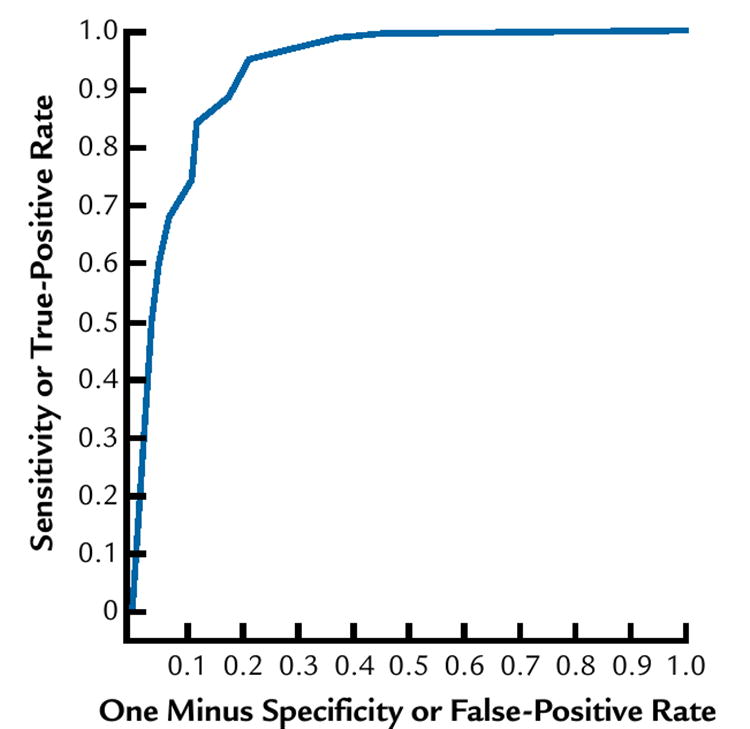
Receiver operating characteristic for dentist (same observer as for Fig. 5) using ΔE2000 color difference formula.
The results for the mean area under the ROC curve for each judgment type and ΔECMC(l:c) formula studied are provided in Table II. Since the optimum fit among the ΔECMC(l:c) formulas for each judgment type was the ΔECMC(2:3) formula, this formula was used as the best representation of the ΔECMC(l:c) color difference formula in subsequent analyses. A difference in the degree of fit of the judgments to color differences was found for the 3 formulas (P=.001) and the 2 judgment types (P<.001) studied, with no significant interaction (P=.979), as indicated in Table III. The mean area under the ROC curve is shown for the significant factors in Table IV. The Tukey-Kramer test identified a lower degree of fit for the ΔE*ab formula compared to each of the ΔECMC(2:3) and ΔE2000 formulas. Since the ΔE*ab formula demonstrated a lower degree of fit, neither perceptibility nor acceptability levels were determined for the ΔE*ab color difference.
Table II.
Means (n=16) of area under ROC curves for all subjects by judgment type and all ΔECMC(l:c) formulas studied
| Judgment Type | Formula | Mean Area Under ROC Curve |
|---|---|---|
| Perceptibility | ΔECMC(3:2) | 0.88 |
| Perceptibility | ΔECMC(2:1) | 0.88 |
| Perceptibility | ΔECMC(1:2) | 0.88 |
| Perceptibility | ΔECMC(1:1) | 0.89 |
| Perceptibility | ΔECMC(2:2) | 0.89 |
| Perceptibility | ΔECMC(2:3) | 0.89 |
| Acceptability | ΔECMC(3:2) | 0.90 |
| Acceptability | ΔECMC(2:1) | 0.91 |
| Acceptability | ΔECMC(1:2) | 0.91 |
| Acceptability | ΔECMC(1:1) | 0.91 |
| Acceptability | ΔECMC(2:2) | 0.91 |
| Acceptability | ΔECMC(2:3) | 0.92 |
Table III.
Test of fixed effects for areas under ROC curves
| Effect | Numerator DF | Denominator DF | F | P |
|---|---|---|---|---|
| Formula | 2 | 75 | 7.55 | .001 |
| Question | 1 | 75 | 27.08 | <.001 |
| Formula × question | 2 | 75 | 0.02 | .979 |
Table IV.
Means (n=16) of area under ROC curves for all subjects by judgment type and color difference formula statistically analyzed for significant differences
| Judgment Type | Formula | Average Area Under ROC Curve |
|---|---|---|
| Perceptibility | ΔE*ab | 0.868 |
| Perceptibility | ΔE2000 | 0.886 |
| Perceptibility | ΔECMC(2:3) | 0.889 |
| Acceptability | ΔE*ab | 0.893 |
| Acceptability | ΔE2000 | 0.913 |
| Acceptability | ΔECMC(2:3) | 0.915 |
Significant differences were found in the mean judgment levels within the main factors of judgment type (P<.001) and superior color difference formula (P<.001). No significant difference was found in the mean judgment levels among the observer groups (P=.474) studied, nor within any interaction (P ≥.404). The mean judgment levels for each judgment type and superior color difference formula are given in Figure 7.
Figure 7.

The average 50% ΔE (DeltaE) Points by Judgment Type and Color Difference Formula. The Judgment Type A is Acceptability and the Judgment Type P is Perceptibility. The Formula DE2000 is ΔE2000, whereas formula DEC-MC23 is ΔECMC(2:3).
DISCUSSION
The lower fit of the judgments to the ΔE*ab formula indicates the importance of the other 2 formulas studied, the ΔECMC(2:3) and ΔE2000 color differences. It was found that a ΔECMC(1:1) formula provided a higher degree of fit than the ΔE*ab formula for acceptability judgments of dental color difference. It seems appropriate to also continue the study of the latest color difference formula recommended by CIE, the ΔE2000 color difference. In implementing the ΔE2000 color difference formula, all adjustment (k) values were set at 1. In the future, adjusting these weighting factors may produce an even better fit with the judgments, and it is recommended that an efficient research design to determine the truly optimum adjustment factors for dental color be used. Using a valid and applicable formula will improve the modeling of these tooth colored esthetic materials and, ultimately, patient acceptability.
The parameters of dental color research determined to be clinically significant include the magnitude of perceptibility and acceptability by human observers. The magnitude of color differences which are unperceivable or unacceptable could then be used as color difference limits within modeling techniques. The establishment of color difference parameters that have visual and clinical significance is recommended.
For each of the color difference formulas found to be superior, different involvement groups could be expected to have similar perceptibility levels, but different levels of acceptability for small color differences in the tooth color space. This is due to the fact that dentists, dental assistants, technicians, and patients differ in educational knowledge regarding dental esthetics, color-matching experience, and the psychological importance placed on teeth. No significant difference was found in this study among the involvement groups, either overall or in interaction with judgment type. However, an increase in the sample size per involvement group may be needed to find the differences in acceptability found in previous research. It should also be noted that the method used in this previous research used only 1 judgment per pair per observer. The relatively good fit of the frequency of judgments to the logistic regression shown in Figure 5 for a person with high involvement in color science applied to clinical dentistry indicates that the method of repeated judgments to determine a frequency of judgment is applicable to research in dental colors. Further research is needed to determine the optimum number of judgments to be made for every pair observed.
The use of appropriate instrumental color analysis in dental research, product testing, and future clinical dental applications offer significant advantages over visual color determination, although care must be taken to avoid the inaccuracies described for translucent dental materials and teeth. The use of instrumental color measurement devices that quantify color and color differences requires not only the application of an appropriate color difference formula, but also the establishment of color difference parameters that have some visual clinical significance. A valid color difference formula, use of an appropriate instrumental color analysis, and well-defined color difference parameters of perceptibility and acceptability for different involvement groups, should be further addressed. Once these issues are resolved, an accurate instrument for color-matching procedures that would replace the more unreliable and inaccurate traditional visual methods may be properly developed. Machines for objective shade evaluation are currently commercially available.
CONCLUSIONS
Within the limitations of this study the following conclusions may be drawn:
ΔE2000 and ΔECMC(2:3) color difference formulas provide a better fit to the calculated color differences, therefore providing better indicators of human perceptibility and acceptability of color differences between tooth colors.
There was not a statistically significant difference in perceptibility and acceptability in each color difference formula between the groups.
Acknowledgments
The authors thank Mrs April Logue, former research assistant, for assistance with subject recruitment and Mr Carl Kipp, Restorative Research Laboratory Manager, for technical assistance.
This project was supported in part by Grant R15 EY013527 from the National Eye Institute of the National Institutes of Health and an American Academy of Fixed Prosthodontics 2003 Tylman Research Grant.
References
- 1.Watson JF, Crispin BJ. Margin placement of esthetic veneer crowns. Part III: Attitudes of patients and dentists. J Prosthet Dent. 1981;45:499–501. doi: 10.1016/0022-3913(81)90034-2. [DOI] [PubMed] [Google Scholar]
- 2.Carlsson GE, Wagner IV, Odman P, Ekstrand K, MacEntee M, Marinello C, et al. An international comparative multicenter study of assessment of dental appearance using computer-aided image manipulation. Int J Prosthodont. 1998;11:246–54. [PubMed] [Google Scholar]
- 3.Davis LG, Ashworth PD, Spriggs LS. Psychological effects of asethetic dental treatment. J Dent. 1998;26:547–54. doi: 10.1016/s0300-5712(97)00031-6. [DOI] [PubMed] [Google Scholar]
- 4.Clark EB. The color problem in dentistry. Dent Dig. 1931;37:499–509. [Google Scholar]
- 5.Preston JD. Current status of shade selection and color matching. Quintessence Int. 1985;16:47–58. [PubMed] [Google Scholar]
- 6.Milleding P, Haag P, Neroth B, Renz I. Two years of clinical experience with Procera titanium crowns. Int J Prosthodont. 1998;11:224–32. [PubMed] [Google Scholar]
- 7.Bergman B, Nilson H, Andersson M. A longitudinal clinical study of Procera ceramic-veneered titanium copings. Int J Prosthodont. 1999;12:135–9. [PubMed] [Google Scholar]
- 8.Sjogren G, Lantto R, Tillberg A. Clinical evaluation of all-ceramic crowns (Dicor) in general practice. J Prosthet Dent. 1999;81:277–84. doi: 10.1016/s0022-3913(99)70269-6. [DOI] [PubMed] [Google Scholar]
- 9.Haselton DR, Diaz-Arnold AM, Hillis SL. Clinical assessment of high-strength all-ceramic crowns. J Prosthet Dent. 2000;83:396–401. doi: 10.1016/s0022-3913(00)70033-3. [DOI] [PubMed] [Google Scholar]
- 10.Johnston WM, O’Brien WJ, Tien TY. The determination of optical absorption and scattering in translucent porcelain. Color Res Appl. 1986;11:125–30. [Google Scholar]
- 11.Wee AG, Chen WY, Johnston WM. Color formulation and reproduction of opaque dental ceramic. Dent Mater. 2005;21:665–70. doi: 10.1016/j.dental.2004.09.003. [DOI] [PubMed] [Google Scholar]
- 12.Judd DB, Wyszecki G. Color in business, science, and industry. 3. New York: John Wiley & Sons; 1975. pp. 27–40. [Google Scholar]
- 13.Paravina RD, Powers JM. Esthetic color training in dentistry. St. Louis: Elsevier Health Sciences; 2004. p. 25. [Google Scholar]
- 14.CIE. Colorimetry. 2. Vienna: Central Bureau of the CIE; 1986. p. 33. [Google Scholar]
- 15.Berger-Schunn A. Practical color measurement: a primer for the beginner, a reminder for the expert. New York: John Wiley & Sons; 1994. pp. 42–166. [Google Scholar]
- 16.CIE. Supplement No 2. CIE Publication No. 15 (E-13-1),1971 (TC-1. 3) Paris: Bureau Central de la CIE; 1978. Recommendations on uniform color spaces, color difference equations, psychometric color terms. [Google Scholar]
- 17.Luo MR, Cui G, Rigg B. The development of the CIE colour-difference formula: CIEDE2000. Color Res Appl. 2001;26:340–50. [Google Scholar]
- 18.Kuehni RG, Marcus RT. An experiment in visual scaling of small color differences. Color Res Appl. 1979;4:83–91. [Google Scholar]
- 19.Seghi RR, Hewlett ER, Kim J. Visual and instrument colorimetric assessments of small color differences on translucent dental porcelain. J Dent Res. 1989;68:1760–4. doi: 10.1177/00220345890680120801. [DOI] [PubMed] [Google Scholar]
- 20.Ragain JC, Johnston WM. Color acceptance of direct dental restorative materials by human observers. Color Res and Appl. 2000;25:278–85. [Google Scholar]
- 21.Ruyter IE, Nilner K, Moller B. Color stability of dental composite resin materials for crown and bridge veneers. Dent Mater. 1987;3:246–51. doi: 10.1016/S0109-5641(87)80081-7. [DOI] [PubMed] [Google Scholar]
- 22.Johnston WM, Kao EC. Assessment of appearance match by visual observation and clinical colorimetry. J Dent Res. 1989;68:819–22. doi: 10.1177/00220345890680051301. [DOI] [PubMed] [Google Scholar]
- 23.Bolt RA, Bosch JJ, Coops JC. Influence of Window Size in Small-Window Color Measurement, Particularly of Teeth. Phys Med Biol. 1994;39:1133–42. doi: 10.1088/0031-9155/39/7/006. [DOI] [PubMed] [Google Scholar]
- 24.Dawson-Saunders B, Trapp RG. Basic and clinical biostatistics. 4. New York, NY: McGraw-Hill; 2004. pp. 314–6. [Google Scholar]
- 25.Gozalo-Diaz DJ, Lindsey DT, Johnston WM, Wee AG. Measurement of color for craniofacial structures using a 45/0-degree optical configuration. J Prosthet Dent. 2007;97:45–53. doi: 10.1016/j.prosdent.2006.10.013. [DOI] [PMC free article] [PubMed] [Google Scholar]
- 26.Hardy LH, Rand G, Rittler MC. AO H-R-R Pseudoisochromatic Plates. 2. New York: American Optical Co; 1957. pp. 12–32. [Google Scholar]


