Abstract
We report on the use of a jet disrupter electrode in an electrodynamic ion funnel as an electronic valve to regulate the intensity of the ion beam transmitted through the interface of a mass spectrometer in order to perform automatic gain control (AGC). The ion flux is determined by either directly detecting the ion current on the conductance limiting orifice of the ion funnel or using a short mass spectrometry acquisition. Based upon the ion flux intensity, the voltage of the jet disrupter is adjusted to alter the transmission efficiency of the ion funnel to provide a desired ion population to the mass analyzer. Ion beam regulation by an ion funnel is shown to provide control to within a few percent of a targeted ion intensity or abundance. The utility of ion funnel AGC was evaluated using a protein tryptic digest analyzed with liquid chromatography Fourier transform ion cyclotron resonance (LC-FTICR) mass spectrometry. The ion population in the ICR cell was accurately controlled to selected levels, which improved data quality and provided better mass measurement accuracy.
Introduction
Mass spectrometry (MS) has become a vital tool in biological research. This information-rich detection method can produce sensitive, qualitative, and quantitative measurements, and provides the basis, for characterizing proteins, identifying novel biomarkers, and studying protein interactions within biological networks and pathways. Many challenges in protein analysis stem from sample complexity, e.g., a typical mammalian cell can have protein abundances ranging from less than a few hundred to tens of millions of copies [1]. A focus in MS research continues to be the development of techniques to better handle the broad range of relative abundances from a single sample. Developments have included chemical methods [2–4], coupling MS to separation techniques [5, 6], and improvements in instrumentation [7–9]. An example of the latter is automatic gain control (AGC) [8–11] first developed by the Finnigan Corporation (now Thermo Electron Corporation) [9]. AGC provides automated regulation to a dynamic ion flux transmitted from the source of the instrument (common in liquid chromatography (LC) coupled MS experiments), resulting in a more constant ion population in the mass analyzer. AGC accomplishes this regulation by monitoring the ion production from the ion source (typically with a pre-scan) and providing on-the-fly adjustments of the ion accumulation time of an ion trap.
The regulation or control of the ion population is important to the operation of most mass spectrometers, and particularly those based upon ion trapping where performance is degraded by excessive space charge. For example, a key source of mass error in Fourier transform ion cyclotron resonance (FTICR) MS comes from the effect of excessive space charge [12–14]. Linear and 3-D ion traps also experience detrimental effects from excessive space charge. These space charge effects lead to shifts in secular frequencies, changes in optimal excitation amplitude, and plasma effects, which can be addressed by controlling the number of ions injected into the ion trap [15–19]. The importance of mass accuracy is apparent in proteomics where, for example, the number of proteolytic fragments needed for a correct identification from a protein database is inversely related to the mass measurement accuracy (MMA) [20].
Our initial implementation of AGC for FTICR MS used a pre-scan where ions are accumulated for a short fixed time and then transferred to the ICR cell [8]. A short transient is recorded and a fast Fourier transform (FFT) is used to determine an integrated signal intensity (ISI) over a defined mass range that is ideally proportional to the size of the ion population. This is used to calculate an optimal accumulation time for the succeeding spectrum. Similarly, Thermo ion trap mass spectrometers use adjustments to the accumulation time based upon a prescan that then determines the accumulation time for AGC used in an ion trap [9] and more recently the hybrid linear ion trap-FTICR mass spectrometer [11].
Although AGC based upon accumulation time adjustments provides a level of ion population control, we have found that it has potential drawbacks from non-linearity in the ion population with accumulation time due to variable trapping efficiencies and m/z discrimination. There are several sources of possible discrimination. High m/z discrimination can result from the space charge repulsion and radial ion stratification from the m/z dependent balance of the effective potential force [21]. Low m/z discrimination can result from space charge induced instabilities [22]. High space charge can also cause ion fragmentation [23–25]. Additionally, we have observed the ion accumulation process may be non-linear with time (e.g. due to trapping efficiencies that vary with the extent of ion-ion interaction), as well as ion loss processes (e.g. due to proton transfer) that limit extended accumulation events.
To circumvent these problems, we have investigated an aspect of electrodynamic ion funnel operation to perform AGC without having to vary the accumulation time of an ion trap. We found that the jet disrupter electrode can be used as an electronic valve to regulate the transmission efficiency of the ion funnel to provide the regulation needed for an AGC experiment. Here, we report on the results from our investigation to determine the capability of the jet disrupter in an ion funnel to perform AGC, as well as on the subsequent implementation and testing of the technique with an FTICR mass spectrometer.
Experimental
Sample preparation
A standard solution was prepared, consisting of caffeine, MRFA peptide, and reserpine (Sigma-Aldrich, St. Louis, MO). A calibration solution was also used that contained 7 fluorinated compounds which produce singly charged species over a mass range of m/z 300–2200 purchased from Agilent Technologies (Product # G2421A, Palo Alto, CA). Two separate peptide mixtures were also used. Peptide mix 1 contained angiotensin, bradykinin, fibrinopeptide A, and substance P; peptide mix 2 included these peptides along with leucine enkephalin, hydra peptide fragment 7–11, and DSIP (all purchased from Sigma-Aldrich). Stock solutions were prepared by dissolving the compounds in water (Nanopure Infinity purification system, Barnstead, Dubuque, IA) and adding them together in an equal molar ratio in a 50:50 by volume mixture of methanol (Fisher Scientific, Pittsburgh, PA) and water with 1.0% acetic acid (Sigma-Aldrich). Dilutions were then obtained from these stock solutions. For AGC testing on an FTICR, a tryptic digest of bovine serum albumin (BSA; Sigma-Aldrich) was used. The protein was denatured in urea and thiourea, and reduced with dithiothreitol followed by a 10x dilution in 100 mM ammonium bicarbonate. Digestion was then performed with trypsin (Promega, Madison, WI) in a 1:50 ratio of enzyme to protein. The digest was cleaned using a C18 SPE column from Supelco (Bellefonte, PA) and then concentrated down to 0.1 mg/mL.
Electrospray ionization (ESI)
Ionization of the sample was performed using ESI emitters made by pulling sections of 100-μm-i.d./200-μm-o.d. fused silica capillary (Polymicro Technologies, Phoenix, AZ) either by hand with a butane torch or with a Model 2000 capillary puller (Sutter Instrument Company, Novato, CA). For infusion experiments, the ESI emitter was connected to a transfer capillary and a 25 μL syringe (Hamilton, Las Vegas, NV) by a stainless steel union, which also served as the connection point for the ESI voltage. For experiments performed on the single quadrupole instrument, all solutions were infused at a 0.3 μL/min flow rate from a Harvard Apparatus Model 22 syringe pump (Holliston, MA). Voltages from 1.4 to 1.5 kV were applied to the ESI emitter via a Burtan high voltage power supply (Model 205B-03R, Hicksville, NY). For the FTICR instrument, a LeCroy high voltage mainframe (Model 1454, Chestnut Ridge, NY) supplied voltages from 2.1 to 2.3 kV for ESI.
Initial AGC evaluation using a quadrupole MS
An Agilent MSD1100 single quadrupole mass spectrometer modified with an ion funnel interface was used to initially test and characterize the ion funnel for AGC, and is similar to that previously described [26]. However, the current interface uses a single ESI emitter and heated, 430 μm i.d. inlet capillary with a single channel ion funnel. An ion funnel is a special ion guide which has been shown to improve significantly the transmission efficiency of ions in the interface region (1–10 torr) between the ESI source and the mass spectrometer [27]. The ion funnel consists of ring electrodes with decreasing i.d. and a superimposed radio frequency (RF) voltage and DC gradient [28–30]. Recent improvements to the ion funnel include the addition of a jet disrupter electrode [26, 31]. A jet disrupter is a small metal disk located about one inch from the funnel inlet and is electrically isolated from the voltages of the ion funnel and controlled by an independent DC power supply. The jet disrupter disperses the gas jet exiting the heated capillary which reduces the gas load to the following stage and removes neutrals [31]. It has also been used as an ion gating mechanism [26].
The ion funnel was constructed with a jet disrupter located on the 20th plate from the top of the 100 funnel plate stack (providing at least 1.0 cm of distance from the position of the mach disk due to the supersonic gas expansion behind the exit of the heated capillary), Figure 1. The jet disrupter consisted of a 6.5 mm diameter metal disk that was centered in the 1 inch diameter hole of a standard funnel plate and soldered onto two thin metal wires forming a crosshair pattern electrically connecting it to the ion funnel plate. The jet disrupter plate was electrically isolated from the DC and RF voltages of the ion funnel by removing the metal contact tabs. A separate DC power supply was then used to independently control the voltage. In this configuration, the ion funnel plates immediately before and after the jet disrupter plate still maintain RF voltages 180 degrees out of phase. The ion funnel used a 500 kHz 100 Vp-p RF and a DC voltage gradient from 200 V to 27 V. The DC voltages on the neighboring ion funnel plates to the jet disrupter plate had 167 and 162 volts respectively. The bottom funnel plate (having the smallest hole diameter) was also electrically isolated and its voltage controlled by an independent DC voltage.
Figure 1.
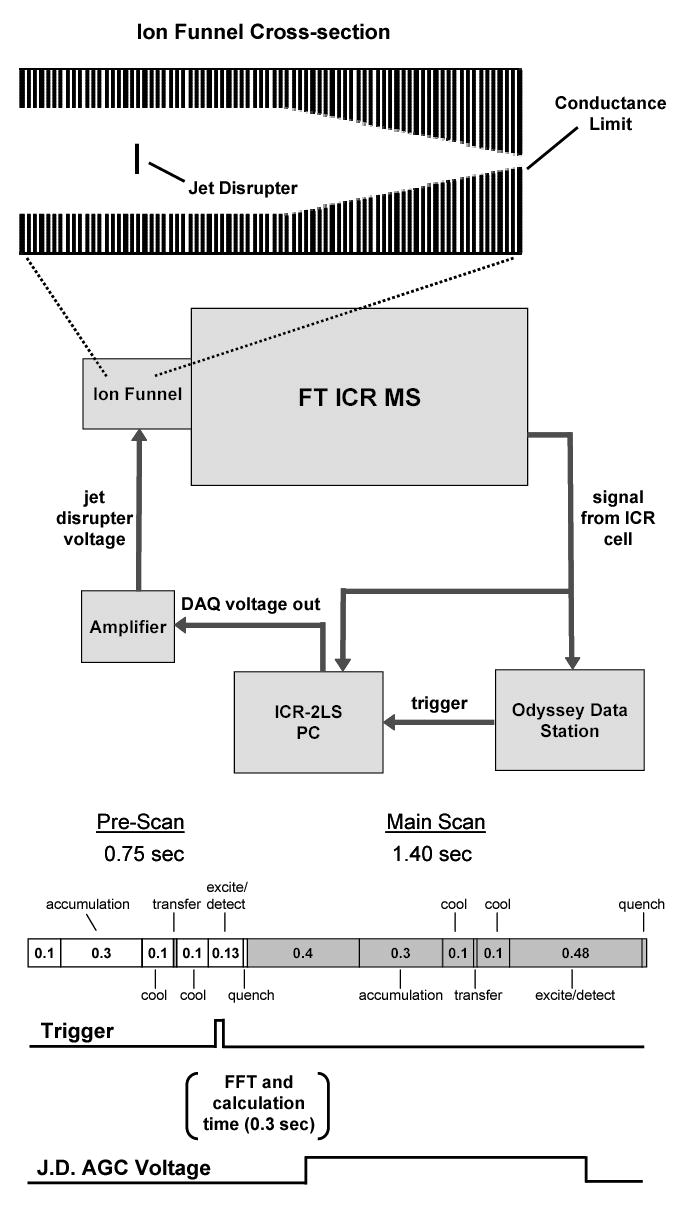
A diagram depicting implementation of ion funnel AGC on an FTICR. The upper portion of the figure illustrates the placement of the jet disrupter electrode in the ion funnel. The block diagram in the center shows the electrical connections needed to apply an AGC voltage to the jet disrupter. The lower portion of the figure details the sequence used on the FTICR data station and the timing of the trigger and jet disrupter voltages. The sequence is divided into a pre-scan (white blocks) and a main scan (gray blocks). The numbers in the blocks represent the time in seconds for the labeled action.
All ion current measurements were performed using the last funnel plate (conductance limit) as a charge collector. This was accomplished by floating a picoammeter (KeithLey, Model 6485, Cleveland, OH) with an independent DC voltage power supply, and the digital filter was utilized with a 20 data point moving average. During ion current readings, the potential on the conductance limit was lowered to −20 V, effectively diverting and impacting a large portion of the ions onto the plate and providing a maximum signal. A passive low-pass filter (3 dB attenuation at ~ 45 kHz) was installed in the circuit by adding a 240 kΩ resistor in the signal cable, creating a simple RC circuit. The filter eliminated an induced current from the ion funnel RF during ion current readings, and allowed simultaneous detection of ion current and acquisition of mass spectra.
Mass spectra were acquired in positive ESI mode with a step size of m/z 0.1, threshold set to 0, and a scan range of m/z 50–2500. For each displayed mass spectrum and reported ISI, a series of 5 spectra were recorded and then averaged in order to help reduce the effect of any instability of the ion flux from the electrospray process.
AGC implementation with a FTICR MS
Ion funnel AGC was implemented with a 7 Tesla FTICR instrument described in more detail elsewhere [32]. The mass spectrometer contained an ESI source with a heated (160 °C), 700 μm i.d. inlet capillary at 210 V followed by an ion funnel with a jet disrupter electrode. The voltages applied to the ion funnel were an RF of 70 Vp-p at 600 kHz and a DC gradient spanning 170 V to 20 V (the differences in the ion funnel voltages from the experiments performed with the single quad mass spectrometer are due to the instruments having different ESI source configurations). A collisional octopole immediately followed the ion funnel, which in turn was followed by a set of selection quadrupoles, external accumulation quadrupole, and an ion guiding quadrupole terminating at a cubic ICR cell maintained at ~10−9 Torr by a custom cryo-pumping assembly. Ion accumulation, excitation/detection, and data storage were performed by an Odyssey data station (Finnigan Corp., San Jose, CA).
The block diagram in Figure 1 illustrates the electrical connections used to implement ion funnel AGC with the FTICR MS. The cable, which delivers the signal from the ICR cell to the data station, was divided with a tee to connect it to a PC running our in-house developed ICR software, ICR-2LS. A spare trigger output from the data station was also connected to a National Instruments Data Acquisition Card (Model PCI-6111, Austin, TX) in the PC. A voltage output from the card was used to deliver the AGC voltage to the jet disrupter after it was amplified and added onto a constant voltage output from an amplifier set for optimal ion funnel transmission.
The sequence used for ion funnel AGC on the Odyssey data station is diagramed in the lower portion of Figure 1. The sequence is divided into two main parts: the pre-scan and the main scan. The pre-scan is used to determine the intensity of the ion flux from the ESI source. During the pre-scan, ions are accumulated in a quadrupole and then transferred to the ICR cell where a short 32 kB time-domain signal or transient is recorded and then transformed to a mass spectrum. The ISI is obtained by performing a FFT on the data and then integrating the intensities over a specified mass range and above a threshold noise level. Based upon the intensity of the resulting ISI, the software uses the AGC calibration equation to calculate an optimal jet disrupter voltage. The voltage is then applied to the jet disrupter electrode during the subsequent main scan where a high quality, 256 kB time transient at a 552 kHz sampling rate is recorded by the data station. This sequence is repeated throughout the course of the analysis. The ICR-2LS software was synchronized to the data station by using the output from a trigger during acquisition of the pre-scan sequence to initiate the chain of events to perform AGC, starting with the recording of the 32 kB transient by ICR-2LS.
The LC-FTICR MS experiments were performed using an Agilent 1100 series capillary LC system. Samples were analyzed by loading 800 ng of a BSA tryptic digest onto a 150 μm i.d. x 25 cm long reverse phase packed capillary column with 5-μm-diameter C18 separation medium (Jupiter, Phenomenex, Schlieren, Switzerland). The samples were separated at a constant flow rate of 2 μL/min, and a linear, 90 minute gradient was used to elute the peptides, using 0.2% acetic acid and 0.05% TFA in water (solvent A) and 90% acetonitrile with 0.1% TFA (solvent B).
Results and Discussion
To evaluate the performance of an ion funnel for AGC, we first characterized the ability of the jet disrupter electrode to regulate the ion beam. The jet disrupter was conceived as an element to disperse the gas jet exiting the heated capillary. During characterization of the jet disrupter, we discovered that there is an optimal DC voltage for maximum ion funnel transmission as well as threshold voltage settings both above and below the optimal voltage where ion transmission is fully blocked, making the jet disrupter an effective ion gating mechanism. Here, we explore the range of voltages between the optimal and blocking potentials of the jet disrupter to determine the possibility of using this transition area for precise control of the ion beam intensity.
The standard solution, peptide mix 1, and the calibration solution were infused separately, electrosprayed, and mass spectra acquired on a single quadrupole instrument as the voltage of the jet disruptor was increased incrementally from 130 V to 240 V. At each voltage step and before each mass spectrum acquisition, the ion current was also measured on the conductance limit electrode of the ion funnel. The results from these experiments are shown in Figure 2. Figure 2A plots both the ISI from the mass spectra and the ion current measured on the conductance limit electrode for the standard solution. The values have been normalized to percent ion funnel transmission, with the highest value set to 100% (maximum transmission). At lower voltages (145 V and lower), the ions are directed toward and impact on the jet disrupter effectively blocking them from exiting the ion funnel. As the voltage is increased, ion loss to the jet disrupter is reduced and signal intensity increases. This trend continues until an optimal voltage that provides the greatest peak intensity is reached. As the voltage continues to increase past the optimal, ions are directed further away from the jet disrupter and some are lost to the ion funnel electrodes, which results in decreased peak intensities. As the voltage is further increased, it eventually becomes large enough to lose most of the ions on the funnel surface (210 V and higher). This gradual transition between a blocked and transmitted ion beam stems from both spatial and kinetic energy distributions of the ions. For example, the first ions eliminated on the funnel surface are located on the outer edge of the beam and/or have a lower axial momentum. Another point illustrated by Figure 2A is that the intensity of the ion current detected on the conductance limit electrode of the ion funnel relates well to the number of ions in the mass analyzer. Therefore, detecting the ion current can replace the pre-scan as a method to determine the ion flux in an AGC experiment. By eliminating the pre-scan, the duty cycle of AGC experiments would be increased because of the time required to detect and analyze the prescan data.
Figure 2.
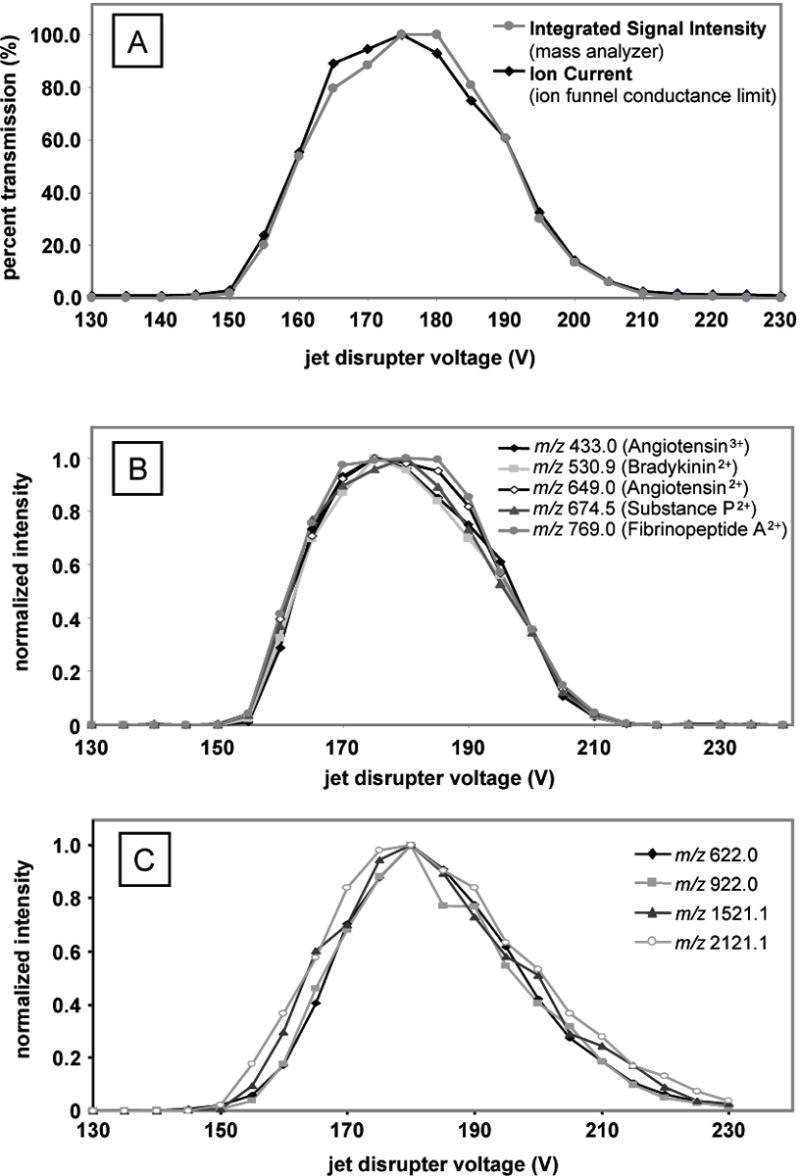
(A) The effect of the jet disrupter voltage on the integrated signal intensity and ion current from the infused standard solution. The ion current was detected in between the mass spectra acquisitions by measuring the intensity of ions hitting the conductance limiting orifice of the ion funnel. Voltages below 145 V and above 210 V block ions from transmitting through the ion funnel, while voltages around 175 V provide optimal transmission. (B) The normalized intensities from the peptide mix 1 solution illustrate the minimal mass bias with ion beam regulation by the jet disrupter electrode. (C) The normalized intensities from the calibration solution showing the effect of jet disrupter regulation over a larger mass range.
In order to observe the effect of ion funnel AGC on the individual compounds in a solution, the peak intensities were plotted against the jet disrupter voltage for the analysis of peptide mix 1 (Figure 2B) and the calibration solution (Figure 2C). The peak intensities have been normalized to better compare the effect from the jet disrupter voltage. In Figure 2B, all five peaks follow the same trend, and the normalized peak intensities are similar, indicating that there is minimal mass bias in the regulation. Furthermore, the constant percentage of ion intensity throughout the regulation implies that the jet disrupter voltage can equally regulate the ion population. In other words, if the ion beam intensity needed to be reduced by 50%, in order to maintain an optimal ion population in the mass analyzer, then applying ~200 V to the jet disrupter would lower the ion population for all peaks by about one-half. Figure 2C contains similar data to 2B and is included with this Figure to provide more details about mass biasing by using analytes spanning a larger m/z range. Even though some biasing is observed, it is minimal and mainly associated with the larger mass calibrant. We have found that the present jet disrupter and ion funnel configuration displays considerably less mass bias than the configuration previously shown25, and reducing the effective potential of the funnel to a point that does not compromise sensitivity can reduce the level of mass bias even further.
The ability of ion funnel AGC to provide a targeted ion population or ion beam intensity in the mass analyzer was initially evaluated using the single quadrupole instrument. To mimic fluctuations in analyte concentrations (typical in separations coupled to MS experiments), the standard solution was prepared at various concentrations and infused separately into the mass spectrometer. During the course of the experiment, ion current readings were acquired from a picoammeter, and the voltage adjusted manually, replacing the role of the electronics and software in normal AGC. The first step was to obtain a target ion current and ISI from a 10 pmol/μL sample. The resulting ion flux from this sample represented the optimal, or target, ion population for the experiment. Next, the more concentrated samples were infused, and the voltage of the jet disrupter was increased for each of the samples, while monitoring the ion current, until the target ion current was reached. This process effectively simulated a single step in an AGC experiment for each of the more concentrated samples. Mass spectra were then recorded before and after jet disrupter adjustments and compared along with the ISIs.
Table 1 shows the normal ion currents and ISIs from four different concentrations of sample (the jet disrupter is set to an optimal transmission voltage of 178 V). Not surprisingly, both ion current and ISI increase as sample concentrations are increased, which indicates a continual increase of the ion population in the mass analyzer. Table 2 shows the resulting jet disrupter voltages and ISIs after the ion flux was regulated by the jet disrupter to match the target, or “optimal”, ion flux represented by the 10 pmol/μL solution. For example, the analysis of the 10 pmol/μL sample produced a target ion current of 480 pA. The 15 pmol/μL sample was then analyzed, which gave an ion current of 560 pA. The voltage of the jet disrupter was then manually increased while monitoring the ion current until the 480 pA target was reached, and a mass spectrum was recorded. This adjustment provided an ion flux similar to the lesser concentrated sample as indicated by the ISI (only a 0.7% difference between the two concentrations after regulation). The last column in Table 2, where the regulated ISI is compared to the target ISI, indicates that performing an AGC experiment with a jet disrupter in this fashion can provide accurate regulation of the ion beam to within a few percent of a targeted ion population.
Table 1.
Ion current and integrated signal intensities from various sample concentrations at the optimal jet disrupter voltage.
| Sample Conc. (pmol/μL) | Jet disrupter Voltage (V) | Ion Current (pA) | Integrated Signal Intensity |
|---|---|---|---|
| 10 | 178 | 480 | 4.54E+07 |
| 15 | 178 | 560 | 5.47E+07 |
| 20 | 178 | 680 | 6.47E+07 |
| 25 | 178 | 770 | 7.36E+07 |
Table 2.
Resulting jet disrupter voltages and integrated signal intensities after jet disrupter regulation of the ion flux to match the ion current of the 10 pmol/μL sample.
| Sample Conc. (pmol/μL) | Jet disrupter Voltage (V) | Ion Current (pA) | Integrated Signal Intensity | ISI variation from 10 pmol/μL sample (%) |
|---|---|---|---|---|
| 10 | 178 | 480 | 4.54E+07 | -- |
| 15 | 185 | 480 | 4.57E+07 | 0.7 |
| 20 | 190 | 480 | 4.47E+07 | −1.5 |
| 25 | 193 | 480 | 4.60E+07 | 1.3 |
After confirming the jet disrupter’s ability to regulate the ion flux, ion funnel AGC was implemented on an LC-FTICR instrument with external ion accumulation. Central to this approach for AGC is the use of a calibration equation that relates the ion funnel transmission efficiency to the voltage added to the optimal voltage of the jet disrupter electrode. By using the data acquired on the single quadrupole instrument, an exponential equation was found that provided a good fit to the experimental data (Figure 3). The robustness of the equation was then tested by acquiring new data sets both on the single quadrupole and FTICR instruments and by fitting the raw data with the equation. In all instances, the equation was still able to follow the data trends by only making adjustments to the ‘C’ value in the equation. Noted that minimal to no adjustment of the value was needed when data sets from the same instrument were compared (indicating the stability of the ion funnel), and a larger adjustment to the value was only needed when data were compared between instruments simply due to the different voltages on the ion funnels and variations in the gas dynamics of the two different ESI sources.
Figure 3.
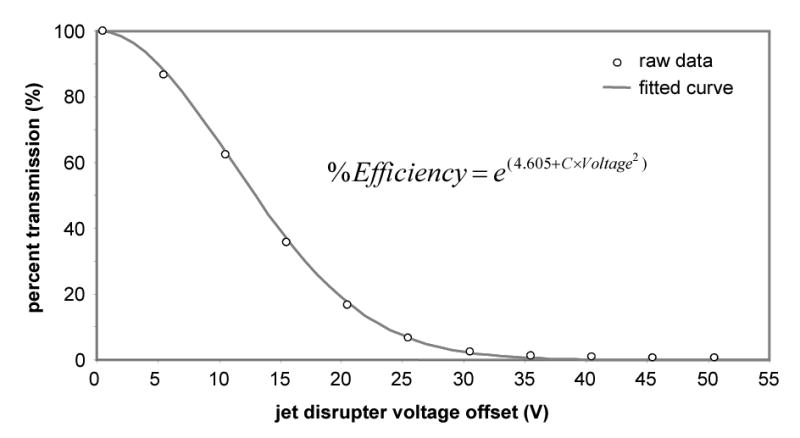
The curve-fit data of percent transmission of the ion funnel versus the offset voltage from the optimal voltage (maximum transmission) of the jet disrupter electrode.
The data processing was modified to incorporate the ion funnel AGC code and the calibration equation. Before using the calibration equation to solve for the AGC jet disrupter voltage, the program uses the following equation to determine the optimal ion funnel transmission efficiency based upon the pre-scan ISI and the users parameters inputted before the run
| (1) |
where ISItarget is the ion population the user wants to maintain in the mass analyzer, and ISIpre-scan is the current unadjusted ion population from the ESI source. A pre-scan was used to provide the ion beam intensity measurement, instead of using a direct ion current measurement, due to a large, fluctuating chemical background current from the solvent gradient in the LC separation that inhibited the software from obtaining an accurate intensity measurement. For equation 1, the calculated percent efficiency is also constrained to within user defined limits. The software then uses the following form of the calibration equation to determine how much voltage needs to be added to the jet disrupter electrode
| (2) |
where the value ‘C’ is determined from a jet disrupter calibration experiment (similar to Figure 3) and inputted prior to the run.
Ion funnel AGC with LC-FTICR instrumentation was first tested by infusing and electrospraying peptide mix 2. Figure 4 shows the pre-scan and main scan ICR transients and the mass spectra from the main scans for the peptide solution without and with ion funnel AGC. In the upper portion of the figure, where there is no AGC, a high ion population was present in the ICR cell as indicated by the large transient signal. The AGC software was then enabled, which automatically added the proper voltage to the jet disrupter electrode (based upon the prescan ISI), which in turn reduced the ion funnel transmission and provided a more appropriate ion population in the cell. A comparison of the main scan mass spectra shows that the peak intensities were lowered while maintaining an accurate peak profile.
Figure 4.
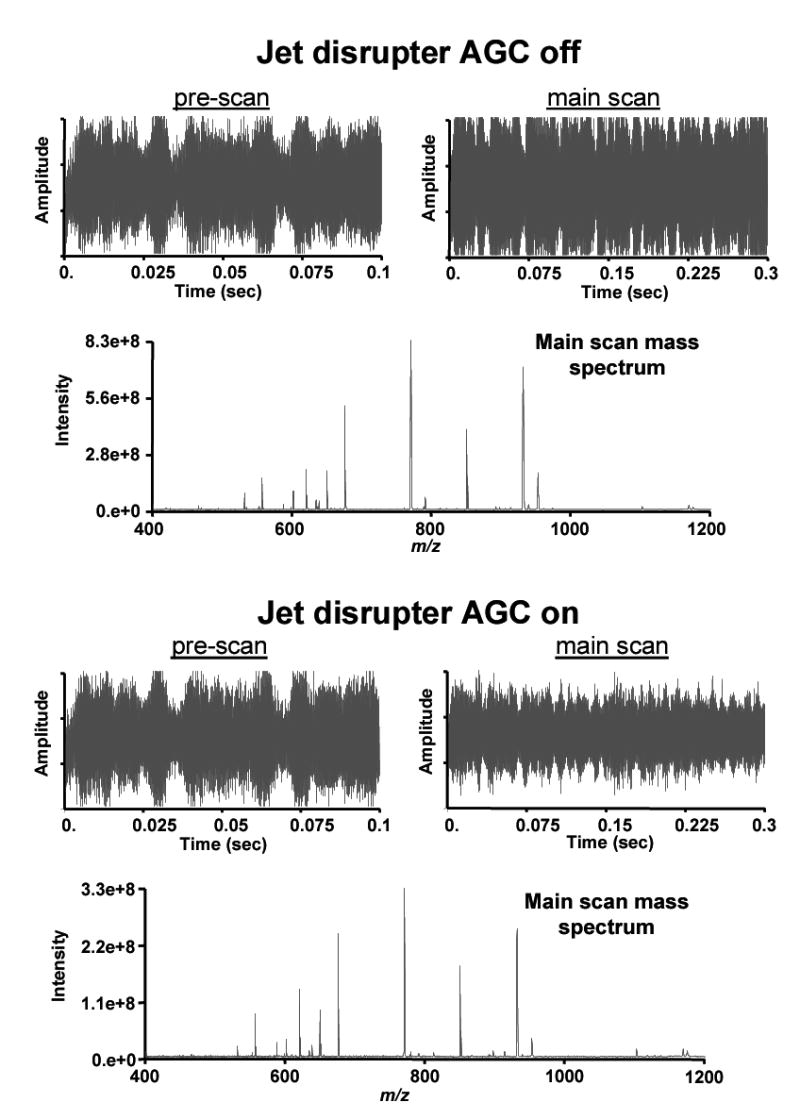
Comparisons of the transients and resulting mass spectra without and with ion funnel AGC on the infused peptide mix 2 solution. The upper portion of the figure shows the detected signal from both the pre-scan and the main scan with no AGC, and the lower portion is after ion funnel AGC was enabled.
A series of LC-MS runs were performed on a tryptic digest of BSA without and with ion funnel AGC. In the first experiment, performed without AGC (Figure 5), the displayed total ion chromatogram (TIC) shows several LC peaks at a variety of intensities and therefore at a variety of ion populations in the ICR cell. In the next three consecutive runs, ion funnel AGC was implemented at different levels of regulation. In other words, the user chooses TIC levels for which all LC peaks above a threshold would be adjusted by AGC. As observed in all three runs, peaks above the AGC level of regulation were adjusted and subsequently lowered, while peaks that fell below the AGC level were not affected. This regulation resulted in a reduced spread of LC peak intensities and, as a result, a reduced variation of ion population in the ICR cell. The main scan accumulation time for the runs with AGC was kept the same as the main scan accumulation time in the run without AGC in order to only investigate the effect of ion population regulation. However, it is an obvious progression that using AGC to prohibit excessive space charge will allow an increase in the fixed accumulation time to increase the peak intensities of lower abundance species.
Figure 5.
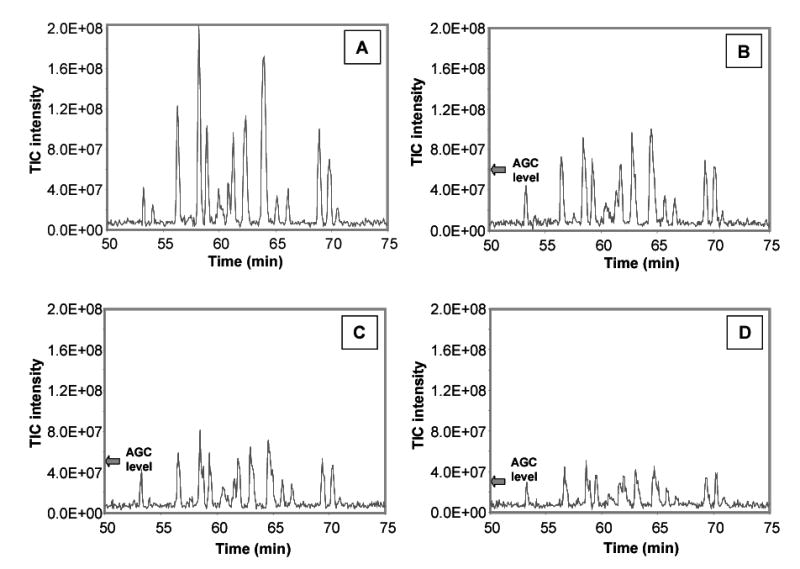
TICs from four consecutive LC-FTICR analyses of a BSA tryptic digest. The first analysis was performed without AGC (A), and the next three with ion funnel AGC at different levels of ion population regulation: 6.0e7 target TIC intensity (B), 4.5e7 target TIC intensity (C), and 3.0e7 target TIC intensity (D).
Space charge effects in the ICR cell, which are directly related to the degree of ion population, reduce the accuracy of the mass measurement. Therefore, by reducing the spread in ion population, the variation in mass error can be reduced. The effect of reducing the spread in ion population during an LC-FTICR analysis by ion funnel AGC is illustrated in Figure 6, which shows the errors in mass measurement (the difference, expressed in ppm, between the detected mass and the theoretical mass) of peptides attributed to the BSA tryptic digestion from Figure 5. The effect of space charge from the high concentration of the peptides on MMA is evident in the absence of AGC by a large spread in MMA with a large tailing to positive ppm. As expected, the more intense the peak in the mass spectrum, the greater the variation in measurements. In the next three consecutive LC-MS runs, where ion funnel AGC was implemented at different levels of regulation, the MMA spread decreases with respect to the LC peak intensity spread in the TICs. As the level of AGC decreased, the variation in the ion populations in the ICR cell also decreased, which reduced the MMA spread and improved data precision.
Figure 6.
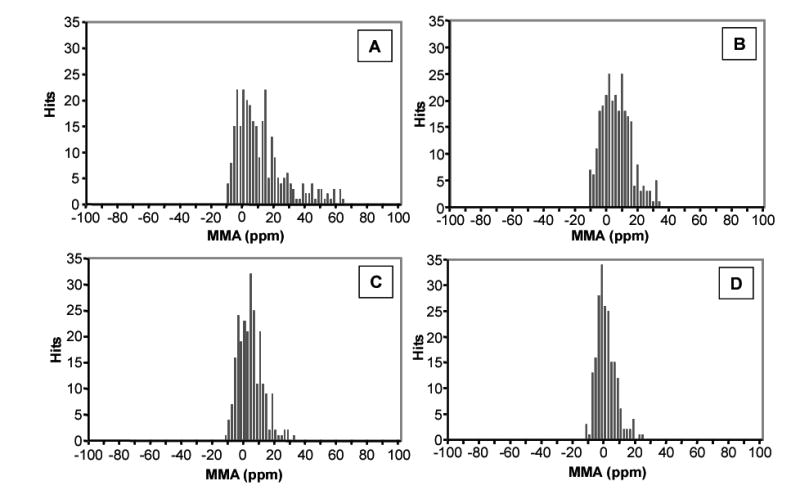
Histograms showing MMA for the four consecutive BSA digest analyses shown in Figure 5. The first analysis was performed without AGC (A), and the next three with ion funnel AGC at different levels of ion population regulation: 6.0e7 target TIC intensity (B), 4.5e7 target TIC intensity (C), and 3.0e7 target TIC intensity (D). MMA is reported for all identified peptide peaks from the BSA tryptic digest, and is the difference between the detected mass and the theoretical mass of the peptide reported in ppm.
Another advantage of controlling the ion population is the ability to eliminate other detrimental effects of large ion populations. For excessive ion populations, harmonics and sidebands in the FTICR mass spectrum can arise due to degradation of the signal resulting from interactions with the electric fields and limitations in the electronics of the ICR cell. In the analysis of the BSA digest, the use of ion funnel AGC improved the quality of the data by eliminating or reducing such detrimental effects. Figure 7 shows the signals and mass spectra from the pre-scan and main scan of one sequence where a BSA tryptic peptide was detected during LC-MS analysis. The effect of AGC can be evaluated by comparing the pre-scan (unadjusted ion population; AGC not used) with the main scan (regulated ion population; AGC used). Based on the intensity of the transients, the pre-scan exhibited a much larger ion population in the ICR cell during detection. A detailed view of one of the smaller peaks from the mass spectrum illustrates the effect of the large ion population. The presence of the side bands can lead to artifacts in spectrum assignments. With AGC, the ion population was controlled, and these detrimental effects were reduced or eliminated.
Figure 7.
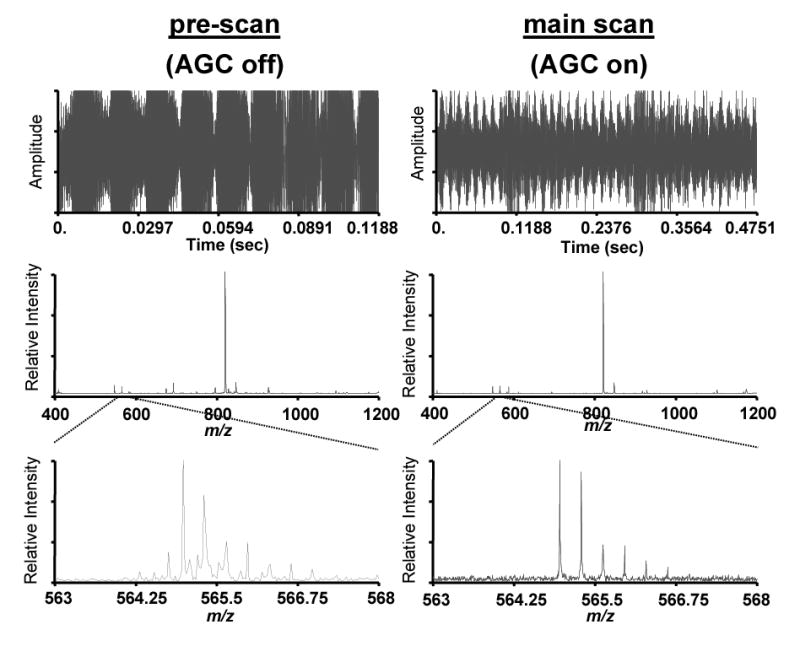
An example from a BSA digest run on an FTICR that shows how the use of ion funnel AGC eliminated unwanted sideband peaks by providing a more appropriate ion population in the ICR cell.
Although ion funnel AGC provided control of the ion population in the ICR cell and improved data quality, the true overall intensities of the regulated peaks were obviously lowered using AGC, and the raw data no longer reflects the actual variations in the ion production during the LC separation. This information can be reclaimed by retaining the value of AGC regulation for each scan in the LC-MS analysis and multiplying this value by the peak intensities in the mass spectrum. For example, we know from the characterization of the jet disrupter that by applying a calculated voltage that reduces the ion population by 50%, all the peaks in the resulting mass spectrum are reduced by about half. Therefore, if we then multiply the peaks intensities by 2, we should reclaim a good approximation of the original “unadjusted” intensities. This is illustrated for one of the BSA digest LC-FTICR analyses without and with AGC in Figure 8A and B. The LC peaks that resulted from higher concentrated peptides have been reduced in Figure 8B, providing a more uniform ion population, but with the loss of quantitative information. Figure 8C shows results from the same run, but with the intensities multiplied by the amount of AGC regulation on each individual scan. This approach is typically effective but some error can be introduced due to the time lag between the ion accumulations in the pre-scan and the main scan. A rapidly changing ion flux (which is common at the beginning of the elution of a concentrated species) can produce an error in the ion population value between the pre-scan and main scan that follows, in this work, 0.7 seconds later. The greater the changing ion flux, the larger the error.
Figure 8.
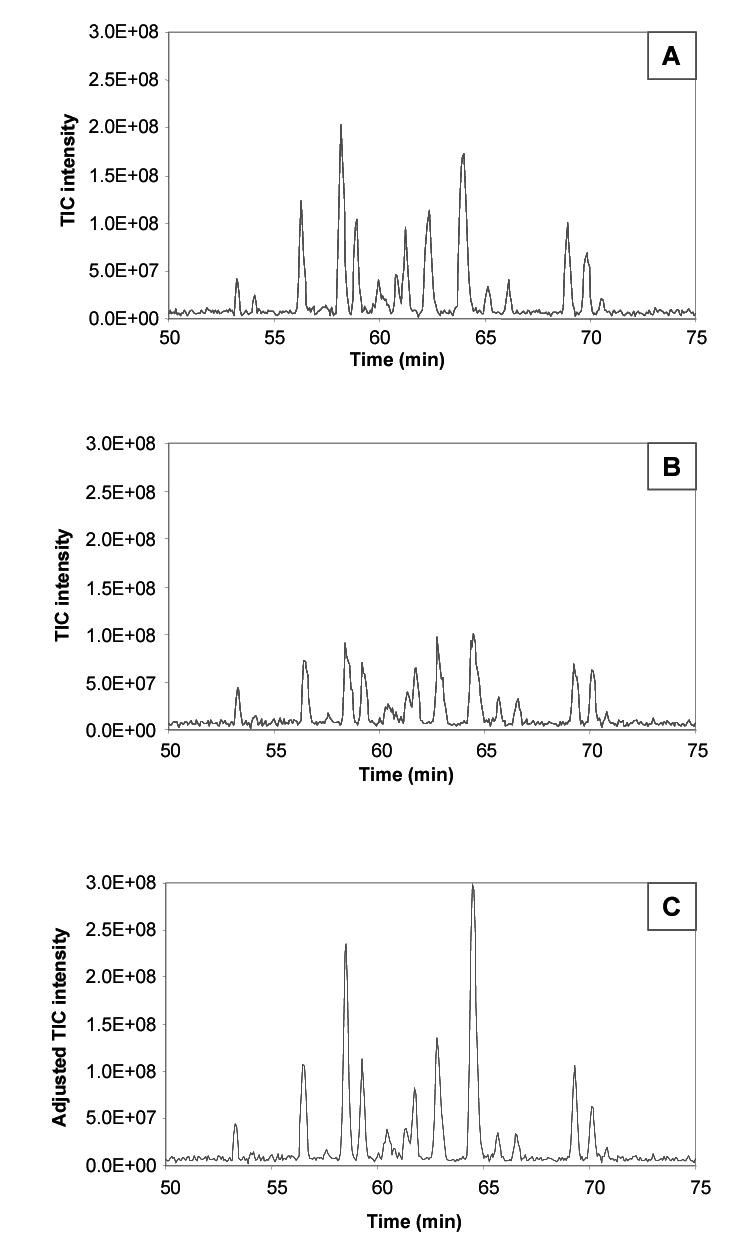
Reclaiming quantitative information after ion funnel AGC by multiplying the intensities from each scan by the factor of AGC regulation. (A) The TIC from a BSA digest without AGC. (B) The TIC from a subsequent run of the same sample from (A) with ion funnel AGC. (C) The reconstructed TIC from the run in (B) after multiplying individual intensities by the factor of AGC regulation to reclaim quantitative information.
Even though the 0.7 sec time lag resulted in only one considerable error for the several peptides that were regulated, it is an issue that can be further addressed. For example, the software can be changed to incorporate a slope analysis algorithm where the increased ion population for the main scan can be predicted based on the increase from the previous pre-scan. Alternatively and more attractively, the time tag can be shortened. We are working to eliminate the pre-scan altogether and replaced it with a fast direct current measurement immediately before the main scan ion accumulation; similar to the direct current measurements done with the single quadrupole instrument. These steps should dramatically reduce the time lag and improve the tracking of the ion flux during the main scan accumulation.
Conclusions
We have demonstrated the feasibility of using the jet disrupter electrode of an ion funnel to perform AGC. The ion funnel allows effective regulation of the ion population by adjusting the ion transmission efficiency rather than the accumulation time of an ion trap, and thus avoiding potentially large bias effects and unwanted fragmentation. Additionally, since the regulation occurs in the source, all down stream ion optics (multipoles and the mass analyzer) are presented with a more uniform ion current. The regulation was shown to be accurate with minimal bias toward m/z and implementation on an FTICR instrument provided a more optimal ion population in the ICR cell during protein digest analyses. The regulated ion population during the runs improved MMA and eliminated effects from excessive ion populations. Quantitative information was reclaimed by multiplying the intensities by the factor of AGC on the individual scans to produce TICs similar to those without AGC but with better data quality. Further improvements are being directed toward reducing the time lag between the ion flux measurement and the main scan ion accumulation. Overall, AGC performed by the jet disrupter electrode of an electrodynamic ion funnel provides a unique and alternative method for regulating the ion beam through the mass spectrometer to improve MMA and the data quality.
Acknowledgments
Portions of this research were supported by the U.S. Department of Energy’s (DOE) Office of Biological and Environmental Research and the NIH National Center for Research Resources through Grant RR 12365. Pacific Northwest National Laboratory is operated by Battelle for the DOE under Contract No. DE-AC06-76RLO 1830.
References
- 1.Patel PH, Suzuki M, Adman E, Shinkai A, Loeb LA. Prokaryotic DNA Polymerase I: Evolution, Structure, and “Base Flipping” Mechanism for Nucleotide Selection. J Mol Biol. 2001;308:823–837. doi: 10.1006/jmbi.2001.4619. [DOI] [PubMed] [Google Scholar]
- 2.Pieper R, Gatlin CL, Makusky AJ, Russo PS, Schatz CR, Miller SS, Su Q, McGrath AM, Estock MA, Parmar PP, Zhao M, Huang ST, Zhou J, Wang F, Esquer-Blasco R, Anderson NL, Taylor J, Steiner S. Identification and Quantification of N-linked Glycoproteins using Hydrazide Chemistry, Stable-Isotope Labeling and Mass Spectrometry. Proteomics. 2003;3:422–432. [Google Scholar]
- 3.Gygi SP, Rist B, Gerber SA, Turecek F, Gelb MH, Aebersold R. Quantitative Analysis of Complex Protein Mixture using Isotope-Coded Affinity Tags. Nat Biotechnol. 1999;1(7):994–999. doi: 10.1038/13690. [DOI] [PubMed] [Google Scholar]
- 4.Pieper R, Su Q, Gatlin CL, Huang ST, Anderson NL, Steiner S. Multi-Component Immunoaffinity Subtraction Chromatography: An Innovative Step Towards a Comprehensive Survey of the Human Plasma Proteome. Proteomics. 2003;3:422–432. doi: 10.1002/pmic.200390057. [DOI] [PubMed] [Google Scholar]
- 5.Link AJ. Multidimensional Peptide Separations in Proteomics. Trends Biotechnol. 2002;20:S8–S13. doi: 10.1016/s1471-1931(02)00202-1. [DOI] [PubMed] [Google Scholar]
- 6.Wu SL, Amato H, Biringer R, Choudhary G, Shieh P, Hancock WS. Targeted Proteomics of Low-Level Proteins in Human Plasma by LC/MSn: Using Human Growth Hormone as a Model System. J Proteome Res. 2002;1:459–465. doi: 10.1021/pr025537l. [DOI] [PubMed] [Google Scholar]
- 7.Harkewicz R, Belov ME, Anderson GA, Pasa-Tolic L, Masselon CD, Prior DC, Udseth HR, Smith RD. ESI-FTICR Mass Spectrometry Employing Data-Dependant External Ion Selection and Accumulation. J Am Soc Mass Spectrom. 2002;13:144–154. doi: 10.1016/S1044-0305(01)00343-9. [DOI] [PubMed] [Google Scholar]
- 8.Belov ME, Zhang R, Strittmatter EF, Prior DC, Tang K, Smith RD. Automated Gain Control and Internal Calibration with External Ion Accumulation Capillary Liquid Chromatography-Electrospray Ionization-Fourier Transform Ion Cyclotron Resonance. Anal Chem. 2003;75:4195–4205. doi: 10.1021/ac0206770. [DOI] [PubMed] [Google Scholar]
- 9.Schwartz JC, Zhou X-G, Bier ME. Method and apparatus of increasing dynamic range and sensitivity of a mass spectrometer. 5,572,022 US Patent. 1996
- 10.Belov ME, Rakov VS, Nikolaev EN, Goshe MB, Anderson GA, Smith RD. Initial Implementation of External Accumulation Liquid Chromatography/Electrospray Ionization Fourier Transform Ion Cyclotron Resonance with Automated Gain Control. Rapid Comm Mass Spectrom. 2003;17:627–636. doi: 10.1002/rcm.955. [DOI] [PubMed] [Google Scholar]
- 11.Senko M, Zabrouskov V, Lange O, Wieghaus A, Horning S. LC/MS with External Calibration Mass Accuracies Approaching 100 ppb. Proceedings of the 52nd ASMS Conference on Mass Spectrometry; Nashville, TN. May 23–27, 2004; A041304. [Google Scholar]
- 12.Taylor PK, Amster IJ. Space Charge Effects on Mass Accuracy for Multiply Charged Ions in ESI-FTICR. Int J Mass Spectrom. 2003;222:351–361. [Google Scholar]
- 13.Masselon C, Tolmachev AV, Anderson GA, Harkewicz R, Smith RD. Mass Measurement Errors Caused by ‘Local’ Frequency Perturbations in FTICR Mass Spectrometry. J Am Soc Mass Spectrom. 2002;13:99–106. doi: 10.1016/S1044-0305(01)00333-6. [DOI] [PubMed] [Google Scholar]
- 14.Easterling ML, Mize TH, Amster IJ. Routine Parts-per-Million Mass Accuracy for High-Mass Ions: Space-Charge Effects in MALDI FT-ICR. Anal Chem. 1999;71:624–632. doi: 10.1021/ac980690d. [DOI] [PubMed] [Google Scholar]
- 15.Vedel F, Andre J. Influence of Space Charge on the Computed Statistical Properties of Stored Ions Cooled by a Buffer Gas in a Quadrupole RF Trap. Phys Rev A. 1984;29:2098–2101. [Google Scholar]
- 16.Cox KA, Cleven CD, Cooks RG. Mass Shifts and Local Space Charge Effects Observed in the Quadrupole Ion Trap at Higher Resolution. Int J Mass Spectrom Ion Processes. 1995;144:47–65. [Google Scholar]
- 17.Mathurin JC, Gregoire S, Brunot A, Tabet JC, March RE, Catinella S, Traldi P. Investigation of Space Charge Interactions Which Arise During Simultaneous Confinement of Positive and Negative Ions in an Ion Trap Mass Spectrometer. J Mass Spectrom. 1997;32:829–837. [Google Scholar]
- 18.Alheit R, Kleineidam S, Vedel F, Vedel M, Werth G. Higher Order Non-Linear Resonances in a Paul Trap. Int J Mass Spectrom Ion Processes. 1996;154:155–169. [Google Scholar]
- 19.Cleven CD, Cox KA, Cooks RG, Bier ME. Mass Shifts Due to Ion-Ion Interactions in a Quadrupole Ion-Trap Mass-Spectrometer. Rapid Commun Mass Spectrom. 1994;8:451–454. [Google Scholar]
- 20.Takach EJ, Hines WM, Patterson DH, Juhasz P, Falick AM, Vestal ML, Martin SA. Accurate Mass Measurements using MALDI-TOF with Delayed Extraction. J Protein Chem. 1997;16:363–369. doi: 10.1023/a:1026376403468. [DOI] [PubMed] [Google Scholar]
- 21.Dehmelt HG. Radiofrequency Spectroscopy of Stored Ions I: Storage. Adv Atom Mol Phys. 1967;3:53–72. [Google Scholar]
- 22.Belov ME, Nikolaev EN, Harkewicz R, Masselon CD, Alving K, Smith RD. Ion Discrimination During Ion Accumulation in a Quadrupole Interface External to a Fourier Transform Ion Cyclotron Resonance Mass Spectrometer. Int J Mass Spectrom. 2001;208:205–225. [Google Scholar]
- 23.Sannes-Lowery K, Griffey RH, Kruppa GH, Speir JP, Hofstadler SA. Multipole Storage Assisted Dissociation, a Novel In-Source Dissociation Technique for Electrospray Ionization Generated Ions. Rapid Comm Mass Spectrom. 1998;12:1957–1961. doi: 10.1002/(SICI)1097-0231(19981215)12:23<1957::AID-RCM418>3.0.CO;2-M. [DOI] [PubMed] [Google Scholar]
- 24.Hakansson K, Axelsson J, Palmblad M, Hakansson P. Mechanistic Studies of Multipole Storage Assisted Dissociation. J Am Soc Mass Spectrom. 2000;11:210–215. doi: 10.1016/S1044-0305(99)00144-0. [DOI] [PubMed] [Google Scholar]
- 25.Sannes-Lowery KA, Hofstadler SA. Characterization of Multipole Storage Assisted Dissociation: Implications for Electrospray Ionization Mass Spectrometry Characterization of Biomolecules. J Am Soc Mass Spectrom. 2000;11:1–7. doi: 10.1016/S1044-0305(99)00110-5. [DOI] [PubMed] [Google Scholar]
- 26.Tang K, Tolmachev AV, Nikolaev E, Zhang R, Belov ME, Udseth HR, Smith RD. Independent Control of Ion Transmission in a Jet Disrupter Dual-Channel Ion Funnel Electrospray Ionization MS Interface. Anal Chem. 2002;74:5431–5437. doi: 10.1021/ac0202583. [DOI] [PubMed] [Google Scholar]
- 27.Taeman K, Tolmachev AV, Harkewicz R, Prior DC, Anderson G, Udseth HR, Smith RD, Bailey TH, Rakov S, Futrell JH. Design and Implementation of a New Electrodynamic Ion Funnel. Anal Chem. 2000;72:2247–2255. doi: 10.1021/ac991412x. [DOI] [PubMed] [Google Scholar]
- 28.Shaffer SA, Tang K, Anderson GA, Prior DC, Udseth HR, Smith RD. A Novel Ion Funnel for Focusing Ions at Elevated Pressure Using Electrospray Ionization Mass Spectrometry. Rapid Comm Mass Spectrom. 1997;11:1813–1817. [Google Scholar]
- 29.Shaffer SA, Prior DC, Anderson GA, Udseth HR, Smith RD. An Ion Funnel Interface for Improved Ion Focusing and Sensitivity Using Electrospray Ionization Mass Spectrometry. Anal Chem. 1998;70:4111–4119. doi: 10.1021/ac9802170. [DOI] [PubMed] [Google Scholar]
- 30.Shaffer SA, Tolmachev A, Prior DC, Anderson GA, Udseth HR, Smith RD. Characterization of an Improved Electrodynamic Ion Funnel Interface for Electrospray Ionization Mass Spectrometry. Anal Chem. 1999;71:2957–2964. doi: 10.1021/ac990346w. [DOI] [PubMed] [Google Scholar]
- 31.Kim T, Tang K, Udseth HR, Smith RD. A Multicapillary Inlet Jet Disruption Electrodynamic Ion Funnel Interface for Improved Sensitivity Using Atmospheric Pressure Ion Sources. Anal Chem. 2001;73:4162–4170. doi: 10.1021/ac010174e. [DOI] [PubMed] [Google Scholar]
- 32.Winger B, Light-Wahl K, Ogorzalek-Loo R, Udseth HR, Smith RD. Observation and Implications of High Mass-to-Charge Ratio Ions from Electrospray Ionization Mass Spectrometry. J Am Soc Mass Spectrom. 1993;4:536–545. doi: 10.1016/1044-0305(93)85015-P. [DOI] [PubMed] [Google Scholar]


