Abstract
Human motor imagery (MI) tasks evoke EEG signal changes. The features of these changes appear as subject-specific temporal traces of EEG rhythmic components at specific channels located over the scalp. Accurate classification of MI tasks based upon EEG may lead to a noninvasive brain-computer interface (BCI) to decode and convey intention of human subjects. We have previously proposed two novel methods on time-frequency feature extraction, expression and classification for high-density EEG recordings (Wang & He: J Neural Eng, 1: 1–7, 2004; Wang, Deng & He: Clin Neurophysiol, 115: 2744–2753, 2004). In the present study, we refined the above time-frequency- spatial approach and applied it to a one-dimensional “cursor control” BCI experiment with online feedback. Through offline analysis of the collected data, we evaluated the capability of the present refined method in comparison with the original time- frequency-spatial methods. The enhanced performance in terms of classification accuracy was found for the proposed approach, with a mean accuracy rate of 91.1% for two subjects studied.
Index Terms: Electroencephalography, Motor imagery, Brain-computer interface, Time-frequency analysis, Time-frequency-spatial analysis
I. Introduction
The ultimate goal of brain-computer interface (BCI) techniques is to provide those people with severe motor disabilities alternative means of communication and control [1–2]. Typically, an EEG-based BCI system extracts, from scalp-recorded EEG, features encoding human intention and conveys the resulting control signals to the external world [1–7]. One type of brain-computer interface is based upon detection and classification of the change of EEG rhythms during different motor imagery (MI) tasks, such as the imagination of left- and right-hand movements. The performance and reliability of such BCI applications rely heavily on the accuracy of classifying MI tasks, which in turn rests on extraction and representation of MI-related EEG features.
However, experimental investigations by means of different imaging modalities have revealed that MI may evoke neural activation extending multiple brain regions, including primary motor area, supplementary motor area, premotor area, and prefrontal area etc. From the scalp EEG signals, it has also been found that imagination of movement leads to short-lasting and circumscribed attenuation (or accentuation) in mu (8–12 Hz) and beta (13–28 Hz) rhythmic activities, known as event-related desynchronization (or synchronization) (ERD/ERS) [4]. The precise timing and frequency of ERD/ERS also vary among subjects. All the above findings suggest the complexity of MI feature, since it spans all the time, frequency and spatial domains. Simply expressing MI features in one (or two) domain(s) while disregarding the other(s) may result in lose of information that may contribute to more accurate MI classification.
Recently, our laboratory developed new approaches for motor imagery classification that utilized information from time-, frequency- and spatial-domains [11–12]. In brief, both these methods were based on narrow-band frequency decomposition, and classification on either temporal features weighted over frequencies and sensor locations [11] or spatial patterns synthesized over time and frequency [12]. In the previous work, we tested our proposed methods on a MI dataset collected under offline condition. In the present study, we refined our previously developed time-frequency-spatial methods for the purpose of performing online analysis, and tested our time-frequency-spatial approach by analyzing single-trial EEG data collected during online one-dimensional “cursor control” BCI experiments on two subjects. The classification accuracy of the modified method was assessed in comparison with our previously published time-frequency method.
II. Methods and Results
A. Data description
The human study was conducted according to a human protocol approved by the IRB of the University of Minnesota. Two healthy subjects (one male and one female, both 23 years old) participated in an online cursor control experiment utilizing BCI2000 – a general-purpose system for BCI research [7]. Specifically, a subject sat in front of a monitor and watched a cursor move continuously from left to right across the screen. A vertical target bar randomly appeared near either the upper-right corner or the lower-right corner. The subject attempted to deflect the cursor up or down to hit the bar by imagining left- or right-hand movement. The scalp EEG signals were recorded from 32 electrodes placed according to 10–20 system with the left ear reference and a sampling rate of 200Hz. The cursor movement was controlled in real-time by an online BCI process that responded to subject’s motor imagery conditions based on spectral power analysis of mu and beta rhythms [6–7].
Each subject completed a total of 480 trials. Each trial began with a 1 second period in which the target appeared on the screen without the cursor. During the subsequent 4 seconds, the cursor appeared and moved across the screen, with the subject performing the left- or right-hand motor imagery task.
In the present study, the first half of the trials were used as training data and the latter half of the trials were used as test data. Considering the effect of online feedback on human adaptation, the training dataset constituted less featured changes of mu and beta rhythms as the data was collected when the subjects were not very experienced with motor imagery tasks. The testing dataset should contain more obvious features.
B. Feature extraction
During the off-line analysis, the single-trial EEG signals were sequentially preprocessed by applying surface Laplacian filtering, frequency decomposition and feature extraction. The recorded scalp EEG represents the noisy spatial overlap of activities arising from diverse brain regions. Surface Laplacian filtering attempts to accentuate localized activity and reduce diffusion in multi-channel EEG [8–10]. Assuming that the distances from a given electrode to its directional neighboring electrodes are approximately equal, the surface Laplacian can be approximated by subtracting the average value of the neighboring channels from the channel of interest [8], as Eq.(1)
| (1) |
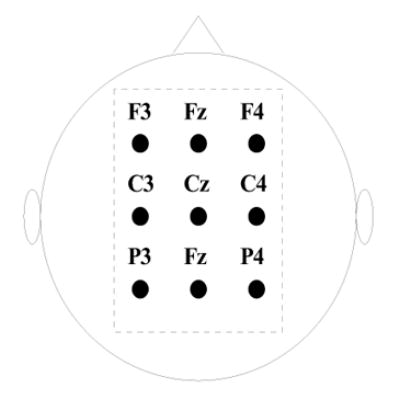
where Vj is the scalp potential at the jth channel, and Sj is an index set of its neighboring channels. After Laplacian filtering, 9 electrodes (Fig. 1) over the sensorimotor cortex were selected for feature extraction.
Fig. 1.

The montage of EEG electrodes used for feature extraction in the present study.
The EEG components from 6 to 30 Hz were further decomposed into multiple frequency bands using a constant-Q (also called proportional-bandwidth) scheme [11]. Specifically, we constructed a set of fourth order Butterworth band-pass filters, each of which span the indicated octaves with the ratio (Q) of the center frequency to the bandwidth being chosen to be a constant. The neighboring frequency bands had certain overlapping to allow a proper redundancy of signals. In the present study, we used 13 frequency bands with center frequencies at 6.0, 6.9, 7.8, 9.0, 10.2, 11.7, 13.4, 15.3, 17.5, 20.0, 22.8, 26.1, 29.8 Hz, respectively.
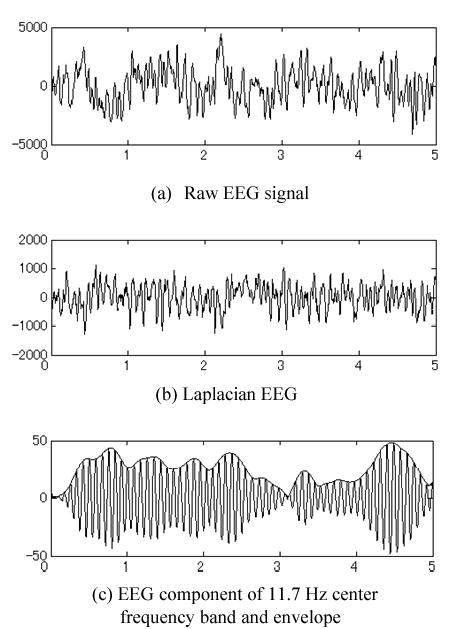
We delineated the ERD and ERS features [4–5] within each frequency band by extracting the envelope of instantaneous powers of decomposed signals using Hilbert transform [12]. Fig. 2 shows a typical example of recorded raw data and the intermediate preprocessing results. The ERD/ERS features were further simplified by down-sampling the envelope, since the high frequency (>5Hz) components can be ignored for most envelopes (See [12] for details).
Fig. 2.

a) Raw data of single-trial recording; b) after surface Laplacian filtering; c) frequency component over averaged training trials and its envelope features after Hilbert transformation. The signals were recorded from channel C3 of subject #1 for right-hand motor imagery.
C. Time-frequency-spatial pattern
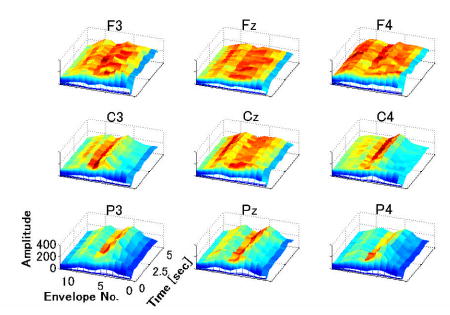
After the previously-described preprocessing, an envelop that appeared as a down-sampled trace in the time domain was extracted for each frequency band and each sensor location respectively. Fig. 3 illustrates an example of all the extracted envelops as specified to their associated frequency bands and sensor labels. At each of the nine selected channels, the signal was decomposed into 13 frequency bands yielding 13 envelopes. Thus a single-trial EEG data had a total of 117 envelopes. Instead of classifying each envelope feature individually and subsequently synthesizing the classification results to generate a single classified condition, we composed all envelopes into a single feature vector p, namely time-frequency-spatial pattern (TFSP).
Fig. 3.

The characteristic TFSP for right-hand motor imagery in one subject. “Envelope No.” are from 1 to 13, corresponding to the center frequencies 6.0, 6.9, 7.8, 9.0, 10.2, 11.7, 13.4, 15.3, 17.5, 20.0, 22.8, 26.1, 29.8 Hz respectively.
From training dataset, two characteristic TFSPs, PL and PR, were obtained by averaging TFSPs corresponding to left- or right-hand motor imagery. However, the envelopes at different sensor locations and different frequency bands may not equally contribute to accurate classification, or some envelopes may cause wrong classification, due to the complicated nature of ERD/ERS phenomena. Therefore, the characteristic TFSPs need to be optimized, which is described in details in Section II.D.
Given known characteristic TFSPs, a testing trial can be classified to belong to either left-hand or right-hand motor imagination. This was accomplished by calculating the correlation coefficients (CC) between the TFSP of the given trial (denoted as p) and the respective characteristic TFSP P (P=PL or PR). The CC between p and P is written as Eq. (2).
| (2) |
where and denote the mean values of p and P respectively. And the classification result was obtained by evaluating Eq.(3),
| (3) |
If f(p)>0, the subject is classified as performing left-handed MI, otherwise, the subject is classified as performing right-handed MI.
D. Optimization of characteristic TFSPs
In the above procedures, no selection of sensors or frequency bands was involved. However, the inclusion of non-informative or misleading envelope features may affect the classification accuracy. Instead of completely discarding specific sensor locations or frequency components from feature extraction, we optimized the characteristic TFSPs by processing each space-frequency-specific envelope separately.
The characteristic TFSPs were optimized by screening through every trial in training dataset. First, we obtained two 117-dimensional vectors for left-hand and right-hand motor imaginations from the grand average of the respective trials in training dataset. Assuming all of the envelope signals equally contributed to the construction of these initial characteristic TFSPs, we assigned the same weight to all of the envelope signals. Next, we screened the entire training dataset from the first trial to the last, and updated the weight for each envelope during each screening step by means of an envelope-deleting test. If using the initial characteristic TFSPs gave correct classification of the currently screened trial, we deleted one envelope that corresponded to a certain sensor location and a certain frequency band from both the characteristic TFSPs and the trial TFSP. If classification on the “shortened” feature was wrong, it meant that the deleted envelope was “incorrectly deleted” as it contributed to the correct classification of the given trial. This envelope was then rewarded by increasing its weight by a fixed value. Otherwise, its weight remained unchanged. The same procedure was repeated until we have tested deleting every envelope signal. If the initial characteristic TFSPs gave rise to a wrong classification of the currently screened trial, the same envelope deleting procedure was applied. If deletion of one envelope reversed the classification result, meaning that the deleted trial accounted for the original wrong classification, we punished this envelope by decreasing its weight by a fixed value. Otherwise, its weight remained unchanged. Similarly, the same procedure was repeated for every envelope signal. Thirdly, after screening all the training trials, we evaluated the weight of each envelope. For the envelope signal whose updated weight was smaller than a preset threshold, we completely removed it from the feature vector. Finally, we refined the characteristic TFSPs by multiplying the amplitudes of envelopes with their respective weights. As a consequence, the vectors of characteristic TFSP were reshaped in a way to enhance the overall classification accuracy of training dataset.
For classifying any testing trial, the envelope signals in its feature vector were multiplied by their associated weights, and the correlation coefficient was then calculated between the resulting feature vector and the optimized characteristic features.
E. Classification accuracy
Table I shows the classification accuracy rates of two subjects. The accuracy rates using the two methods were compared. As assessed by the results at the end of the interval, the averaged classification accuracy of the present method was 91.1% in two human subjects, while the previous method achieved 85.3% in these same two human subjects. All classification rates discussed here were calculated for the entire 5 seconds data, as the target timeline when the subjects were to make the correct control of the cursor.
Table I.
Accuracy Rates [%] Of 2 Human Subjects
| Previous method [12] | Present method | |
|---|---|---|
| Subject #1 | 85.0 | 91.3 |
| Subject #2 | 85.4 | 90.8 |
| Mean | 85.3 | 91.1 |
F. Offline “cursor control” by using the TFSPs
We investigated the possibility of the cursor control using the present method. In this case, the cursor was “moved” by 13 steps during the entire 5-sec interval. Since the calculation time of a trial was about 0.3 seconds using the present algorithm (implemented in Matlab), the cursor movement was performed every 0.3 seconds. The vertical deflection at the jth step can be calculated from Eq. (4), assuming positive to move upward and negative to move downward,
| (4) |
where K is a positive constant. It was set such that the maximal |dj| was less than half of the screen height. In our “offline” setting, a cursor would appear and move from the middle of the left side on the screen in the same manner as BCI2000. The cursor would move upward or downward by left- or right-hand motor imagery, respectively.
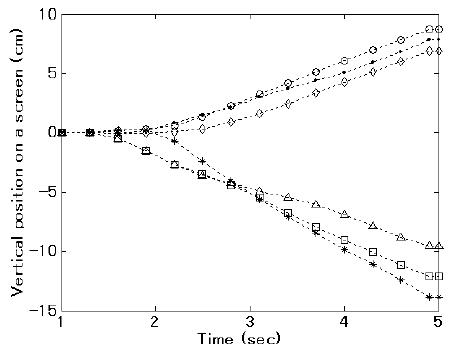
Fig. 4 shows a typical example of cursor orbits controlled by subject #1 using the present method when the classification was correct in the test dataset. The upper three orbits refer to left-hand motor imagery, and the lower three orbits refer to right-hand motor imagery.
Fig. 4.

An example of cursor orbit by using the present method for subject #1. Horizontal axis is time during a trial. The vertical axis corresponds to a width of a screen. These 6 orbits of a cursor were results of correct case in the test data. The upper three orbits refer to left-hand motor imagery. The lower three orbits refer to right-hand motor imagery. Subject #2 had a similar cursor control trajectory.
III. Discussion
The present study suggests the applicability of the time-frequency-spatial pattern (TFSP) approach to classification of motor imagery EEG recorded in an online BCI experimental setting. Although the data analysis and parameter refinement were performed off-line, all of the analysis scenarios are analogous to an online setting and can be implemented in a BCI system to control cursor movement in real-time.
The time-frequency-spatial approach which we explored previously [12] was only tested in a MI dataset obtained without online control or feedback. While good performance was obtained of the previous time-frequency-spatial method in a group of 8 human subjects, it is important to test its performance and applicability in an online BCI experiment where human adaptation is incorporated. The present study thus provides such a preliminary evaluation of our time-frequency-spatial approach in classifying motor imagery tasks during online BCI experiments.
Due to the nature of online data, we have improved our time-frequency-spatial method as described in the Methods Section, in order to achieve a virtual “online” ability. The present TFSP method is relatively fast and can be implemented in a 3.2 GHz PC for about 0.3 sec/trial using Matlab (about 10 sec/trial for the previous method).
Note that the present improved version of TFSP method not only provides faster implementation of the previous TFSP method, but also further refines the previously reported TFSP algorithm [11-12]. In our previously developed algorithm, features for classification were not explicitly expressed as an integrated time-frequency-spatial pattern, but instead either the spatial patterns (or temporal patterns) were extracted for each time-frequency pair (or frequency-space pair), and were first classified separately and then weighted synthesized to generate a single final classification result. With our current algorithm, all the information that spans the time, frequency and spatial domains were incorporated into a single feature vector in a high-dimensional feature space. Any time-frequency-spatial specific combination (e.g. at 1-sec and 9-Hz over C4 electrode) corresponded to an axis in the feature space. Classification based on such an integrated feature vector can take into account implicitly coupled information from different sensor locations and frequency bands, which may play a contributive role in a successful classification. Encouragingly in the present study, an improvement of about 6% for the mean accuracy rate was achieved in the two subjects studied.
In addition to intrinsic human adaptation due to online feedback, our optimization procedures on characteristic TFSPs (described in Section II.D) also provides a mechanism for adaptation of algorithm itself. Note that in our present study, the characteristic features were extracted and optimized from the first half of the entire 480 trials, which contained less contributive information. However, in real BCI application, it is possible to periodically “calibrate” the BCI system itself, by screening the latest training data to update the characteristic features in a way described in Section II.D. The BCI system with both online feedback and machine adaptation is expected to have better (than what we reported) and gradually improving performance.
The time-frequency based approach has been explored [11–14] for feature extraction and shown to provide an effective way to improve classification accuracy. This suggests that the electrophysiological process associated with motor imagery is a spatio-temporal process and encoded in the frequency domain. Our work on deconvolving the volume conduction effect to enhance the performance of EEG-based BCI suggested the feasibility of enhancing EEG-based BCI by solving the EEG inverse problem [15–16]. These results using equivalent dipole models and cortical current density models [15–16] suggested another means of improving the performance of EEG-based BCI. However, solving the EEG inverse problems is normally time intensive and it is still a challenge to develop computationally efficient algorithms to realize online BCI based on the inverse solution of EEG. The time-frequency-spatial approach which we are exploring in the present study, represents an important alternative to extract effective information from the multi-channel EEG for classifying motor imagery in order to develop a efficient EEG-based BCI system.
Acknowledgments
The BCI2000 software is made available by the Wadsworth Center. The authors are grateful for the help of Dr. G. Schalk, to Linda Hue and Lei Qin for technical assistance in setting it up.
Footnotes
This work was supported in part by NSF BES-0411898, NIH R01 EB00178, and a grant from the Dean of Graduate School of the University of Minnesota.
References
- 1.Wolpaw JR, Birbaumer N, McFarland DJ, Pfurtscheller G, Vaughan TM. Brain computer interfaces for communication and control. Clin Neurophysiol. 2002;113:767–791. doi: 10.1016/s1388-2457(02)00057-3. [DOI] [PubMed] [Google Scholar]
- 2.Vallabhaneni A, Wang T, He B. In: Brain Computer Interface. He B, editor. Vol. 85. Neural Engineering, Kluwer Academic/Plenum Publishers; 2005. p. 122. [Google Scholar]
- 3.Wolpaw JR, McFarland DJ, Neat GW, Forneris CA. An EEG-based brain computer interface for cursor control. Electroencephalogr Clin Neurophysiol. 1991;78:252–259. doi: 10.1016/0013-4694(91)90040-b. [DOI] [PubMed] [Google Scholar]
- 4.Pfurtscheller G, Neuper C, Flotzinger D, Pregenzer M. EEG-based discrimination between imagination of right and left hand movement. Electroencephalogr Clin Neurophysiol. 1997;103:642–651. doi: 10.1016/s0013-4694(97)00080-1. [DOI] [PubMed] [Google Scholar]
- 5.Pfurtscheller G. Event-related desynchronization. Elsevier York: Publisher; 303. pp. 325–1999. [Google Scholar]
- 6.Sheikh H, McFarland DJ, Sarnacki WA, Wolpaw JR. Electroencephalographic (EEG)-based communication: EEG control versus system performance in humans. Neuroscience Letters. 2003;345:89–92. doi: 10.1016/s0304-3940(03)00470-1. [DOI] [PubMed] [Google Scholar]
- 7.Schalk G, McFarland DJ, Hinterberger T, Birbaumer N, Wolpaw JR. BCI2000: a general-purpose brain-computer interface (BCI) system. IEEE Trans Biomed Eng. Jun 2004;51(6):1034–4. doi: 10.1109/TBME.2004.827072. [DOI] [PubMed] [Google Scholar]
- 8.Hjorth B. An on-line transformation of EEG scalp potentials into orthogonal source derivations. Electroencephalogr Clin Neurophysiol. 1975;39:526–530. doi: 10.1016/0013-4694(75)90056-5. [DOI] [PubMed] [Google Scholar]
- 9.He B. Brain Electric Source Imaging: Scalp Laplacian Mapping and Cortical Imaging. Critical Reviews in Biomedical Engineering. 1999;27:149–188. [PubMed] [Google Scholar]
- 10.He B, Lian J, Li G. High-Resolution EEG: A New Realistic Geometry Spline Laplacian Estimation Technique. J Clin Neurophysiol. 2001;112:845–852. doi: 10.1016/s1388-2457(00)00546-0. [DOI] [PubMed] [Google Scholar]
- 11.Wang T, He B. An efficient rhythmic component expression and weighting synthesis strategy for classifying motor imagery EEG in a brain-computer interface. J Neural Eng. Jan 2004;1:1–7. doi: 10.1088/1741-2560/1/1/001. [DOI] [PubMed] [Google Scholar]
- 12.Wang T, Deng J, He B. Classifying EEG-based motor imagery tasks by means of time – frequency synthesized spatial patterns. Clin Neurophysiol. 2004;115:2744–2753. doi: 10.1016/j.clinph.2004.06.022. [DOI] [PubMed] [Google Scholar]
- 13.Scherer R, Müller GR, Neuper C, Graimann B, Pfurtscheller G. An asynchronously controlled EEG-based virtual keyboard: improvement of the spelling rate. IEEE Trans Biomed Eng. June 2004;51:979 – 984. doi: 10.1109/TBME.2004.827062. [DOI] [PubMed] [Google Scholar]
- 14.Qin L, He B. A Wavelet-based Time-Frequency Analysis Approach for Classification of Motor Imagery for Brain-Computer Interface Applications. Journal of Neural Engineering. 2005;2:65–72. doi: 10.1088/1741-2560/2/4/001. [DOI] [PubMed] [Google Scholar]
- 15.Qin L, Ding L, He B. Motor Imagery Classification by Means of Source Analysis for Brain Computer Interface Applications. J of Neural Engineering. 2004;1:135–141. doi: 10.1088/1741-2560/1/3/002. [DOI] [PMC free article] [PubMed] [Google Scholar]
- 16.Kamousi B, Liu Z, He B. Classification of Motor Imagery Tasks for Brain-Computer Interface Applications by means of Two Equivalent Dipoles Analysis. IEEE Transactions on Neural Systems and Rehabilitation Engineering. June 2005;13:166–171. doi: 10.1109/TNSRE.2005.847386. [DOI] [PubMed] [Google Scholar]


