

Abstract
Objective
To assess the extent to which weight status in childhood or adolescence predicts becoming overweight or hypertensive by young adulthood.
Research Methods and Procedures
We conducted a prospective study of 314 children, who were 8 to 15 years old at baseline, and were followed up 8 to 12 years later. Weight, height, and blood pressure were measured by trained research staff. Incident overweight was defined as BMI ≥ 25 kg/m2 among participants who had not been overweight as children.
Results
More male subjects (48.3%) than female subjects (23.5%) became overweight or obese between their first childhood visit and the young adult follow-up (p < 0.001). Being in the upper one half of the normal weight range (i.e., BMI between the 50th and 84th percentiles for age and gender in childhood) was a good predictor of becoming overweight as a young adult. Compared with children with a BMI <50th percentile, girls and boys between the 50th and 74th percentiles of BMI were ~5 times more likely [boys, odds ratio (OR) = 5.3, p = 0.002; girls, OR = 4.8, p = 0.07] and those with a BMI between the 75th and 84th percentiles were up to 20 times more likely (boys, OR = 4.3, p = 0.02; girls, OR = 20.2, p = 0.001) to become overweight. The incidence of high blood pressure was greater among the male subjects (12.3% vs. 1.9%). Compared with boys who had childhood BMI below the 75th percentile, boys between the 75th and 85th percentiles of BMI as children were four times more likely (OR = 3.6) and those at above the 85th percentile were five times more likely (OR = 5.1) to become hypertensive.
Discussion
High normal weight status in childhood predicted becoming overweight or obese as an adult. Also, among the boys, elevated BMI in childhood predicted risk of hypertension in young adulthood.
Keywords: BMI, children, overweight, incidence, hypertension
Introduction
Obesity is a serious public health problem. During the past 2 decades, the prevalence of overweight has more than doubled among children and adolescents in the United States. According to the 1999 to 2000 National Health and Nutrition Examination Survey, ~30% of adolescents are overweight or at risk for overweight (i.e., BMI ≥ national 85th percentile for age and sex) (1). The period of late adolescence and early adulthood may be particularly important in the maintenance of healthy weight. In the Coronary Artery Risk Development in Young Adults (CARDIA) study (2), over a 7-year period in early adulthood, the prevalence of overweight (defined using the previous cutoff point of BMI > 27.3 kg/m2) increased from 32% to 50% among African-American women and from 13% to 24% among white women.
Weight status tracks with age, and the risk of an overweight child becoming an obese adult rises with age (3,4). In one study among preschool children, an obese child was about twice as likely as a non-obese child to become an obese adult (5). Adolescents who were overweight, however, were almost 18 times more likely than their leaner peers to be obese in early adulthood (6). In addition, overweight adolescents in the Bogalusa Heart Study were 8.5 times more likely than their leaner peers to have hypertension as young adults (7). Less is known about the relationship between childhood and adolescent weights in the normal weight range (i.e., children not classified as underweight, at risk for overweight, or overweight) and subsequent changes in weight and blood pressure. To investigate these issues, we analyzed data from a prospective cohort study based in an urban population in the Northeast.
Research Methods and Procedures
Sample
The cohort comprised 339 children, mostly white, in East Boston, MA, who were followed annually between 1978 and 1981 (childhood) and then followed up again from 1989 to 1990 (young adult visit). The study population and methods have been described previously (8,9). At entry into the cohort, the children were 8 to 15 years of age and attended a single school. Annual measures (1978 to 1981) of demographic factors and medical history were obtained, and both systolic and Korotkoff fifth sound diastolic blood pressure readings (three each visit) were taken by a standard procedure using a random-zero sphygmomanometer at four visits spaced 1 week apart. The children assessed per year varied slightly; 284 children in year 1, 282 children in year 2, 270 children in year 3, and 267 children in year 4. Participants were not followed from 1981 to 1989. During that interval two participants died, thus leaving 337 members of the cohort. In 1989 and 1990, using clinic records and motor vehicle information, information from family members, town and telephone directories, and other contact persons, we located 334 (99%) of the surviving members of the original cohort, then 18 to 26 years old. Of these, 319 agreed to participate in follow-up; however, two participants could be followed only by telephone, leaving 317 (94%) with follow-up blood pressure data. There were three visits spaced 1 week apart at the adult follow-up. Three blood pressure readings were taken at each of the adult visits. Participants were excluded from the analysis if there was missing information on weight and height in childhood (n = 1) or adulthood (n = 4) or missing information on blood pressure (n = 3). Those reporting use of medication that raises blood pressure (n = 28) were excluded from the blood pressure analyses. At baseline, 45 children had a BMI of at least 25 kg/m2, the adult cut-off for overweight. In the analysis predicting the development of overweight, these 45 children were excluded from the analysis. Thus, the final sample comprised 269 young adults in the analyses predicting weight status and 286 people in the analyses predicting young adult blood pressure.
Exposures
BMI (kilograms per meter squared) was calculated from the measured weight and height information at the first childhood visit. BMI values were used to compute gender-and age-specific z scores and percentiles of childhood BMI, based on the national reference data from the Centers for Disease Control and Prevention (10). The percentiles were considered as continuous variables and made into a series of indicator variables (<10th, 10th to 25th, 25th to 50th, 50th to 75th, 75th to 85th, and ≥85th percentiles for age and gender). Children with a BMI between the national 85th and 95th percentiles for age and gender were classified as at risk for overweight, and those with a BMI > 95th percentile were classified as overweight. High normal weight was defined as having a BMI between the 50th and 84th percentiles. In the analyses, the high normal group was separated into two groups, 50th to 74th and 75th to 84th percentiles, and analyzed separately. The mean of three measures of blood pressure readings collected on each of four occasions 1 week apart was used to estimate mean systolic and mean diastolic blood pressures in each of the first 4 years of the study. The BMI and average blood pressures from the participants’ 1st year in the study were used as the primary predictors of adult outcomes. In secondary analyses, annual changes in BMI and blood pressure were considered as additional predictors of the outcomes.
Outcomes
The U.S. Department of Agriculture and World Health Organization weight classification was used to categorized adult BMI into underweight (BMI <18.5), healthy weight (18.5 ≤ BMI ≤ 24.9), overweight (25 ≤ BMI ≤ 29.9), or obese (BMI ≥ 30) (11). Because very few people were underweight at the adult visit, underweight and healthy weight were combined into a not overweight category in analyses modeling the development of overweight or obesity.
Adult blood pressure was both considered as a continuous outcome (i.e., mean systolic blood pressure and mean diastolic blood pressure) and collapsed into a dichotomous hypertension variable: high systolic (≥140 mm Hg) or high diastolic (≥90 mm Hg) blood pressure or subject report of taking medication to control blood pressure.
Statistical Analyses
All analyses were conducted with SAS software (SAS version 8.2; SAS Institute Inc., Cary, NC). Linear and logistic regression models adjusted for age at baseline and length of follow-up (i.e., from the subject’s 1st year in the study until the time of the young adult visit). Information from the first childhood visit was used as the primary predictor of young adult outcomes. However, mean annual changes in BMI or z scores of BMI were included in secondary analyses predicting the development of obesity. There were too few incident cases of hypertension to include the change variables in those analyses. Attempts to fit slopes to describe the changes in BMI during childhood and/or adolescence were not successful due to a lack of linear change patterns. A cruder estimate of annual changes in BMI was derived by subtracting the first BMI measure from the last childhood measure and dividing by the number of years in between the measurements. Due to the lack of a linear association between BMI and time, caution should be used when interpreting those results. Analyses were stratified by gender. To account for the non-linear relationship between age and the outcomes, age was modeled as age and age2. The analysis of the development of overweight or obesity was limited to the 149 female subjects and 120 male subjects who had a BMI < 25 kg/m2 (i.e., did not meet the adult criteria for overweight) at their first childhood visit. The analysis of adult blood pressure was limited to the 156 female subjects and 130 male subjects who were not on any medication that would raise their blood pressure and had weight, height, and blood pressure measurements taken at the adult visit. All p values are two-sided with an α level = 0.05.
Results
At the first childhood visit, the mean age of the sample was 11.6 years for the girls and 11.8 years for the boys. Boys and girls were similar in terms of their systolic and diastolic blood pressures at their first childhood visit (Table 1). The mean childhood BMI in both genders was ~20 kg/m2, and the prevalence of at risk for overweight or overweight at the first childhood visit was 34% for girls and 32% for boys. In addition, the distribution of weight status was similar in boys and girls at the first childhood visit (Figure 1). At the adult follow-up, however, there were large gender differences. Among the participants who had BMI < 25 at their first childhood visit, ~48.3% of the boys became overweight or obese by young adulthood, compared with 23.5% of the girls (p < 0.001) (Table 1). In addition, the incidence of high blood pressure at the young adult visit was greater among the male subjects (12.3%) than the female subjects (1.9%) (p < 0.001).
Table 1.
Mean age, BMI, and blood pressure and the prevalence and incidence of overweight and high blood pressure in childhood and early adulthood among 314 participants in the East Boston Blood Pressure Study
| Female subjects (n = 175) | Male subjects (n = 139) | |
|---|---|---|
| First childhood visit | ||
| Age (years) | 11.6 (1.8) | 11.8 (1.7) |
| BMI (kg/m2) | 20.3 (4.2) | 20.1 (4.2) |
| Age- and gender-specific z score of BMI | 0.5 (1.0) | 0.5 (1.1) |
| Diastolic blood pressure (mm Hg) | 57.4 (9.7) | 58.1 (9.7) |
| Systolic blood pressure (mm Hg) | 100.3 (9.1) | 101.5 (9.3) |
| Overweight or at risk for overweight [n (%)] | ||
| At risk for overweight | 32 (18.3) | 22 (15.8)* |
| Overweight | 27 (15.4) | 22 (15.8) |
| BMI ≥ 25 [n (%)] | 26 (14.9) | 19 (3.7) |
| High blood pressure [n (%)]† | 0 | 0 |
| Adult visit | ||
| Age (years) | 22.0 (1.9) | 22.2 (1.8) |
| BMI (kg/m2) | 23.8 (4.7) | 25.9 (3.9)* |
| Diastolic blood pressure (mm Hg)† | 67.0 (7.3) | 72.4 (10.7)* |
| Systolic blood pressure (mm Hg)† | 107.7 (8.9) | 120.0 (9.4)* |
| Became overweight or obese (n, %)‡ | 35 (23.5%) | 58 (48.3%)* |
| Developed high blood pressure (n, %)† | 3 (1.9%) | 16 (12.3%)* |
p < 0.001 for difference between males and females
One hundred fifty-six female subjects and 130 male subjects had blood pressures taken at the adult visit and were not on medications that would raise their blood pressure. High blood pressure was defined as systolic blood pressure ≥ 140 mm Hg, diastolic blood pressure ≥ 90 mm Hg, or use of medication to lower blood pressure.
One hundred forty-nine female subjects and 120 male subjects who had a BMI < 25 at their first childhood visit were included in the analysis.
Figure 1.
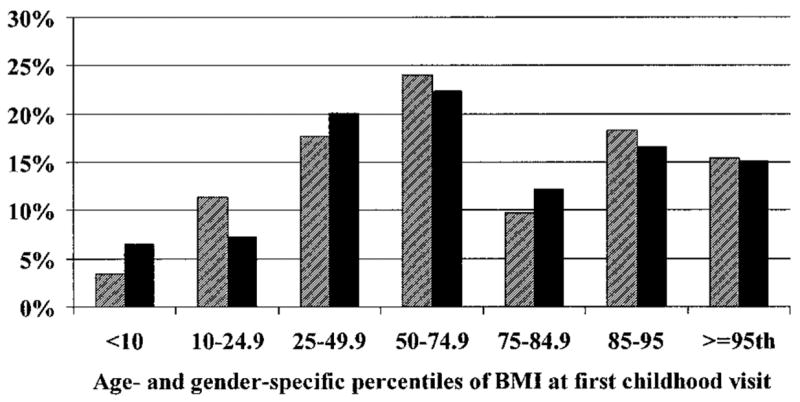
Distribution of childhood weight status among 314 girls and boys in the East Boston Blood Pressure study. Girls are represented by the striped bars, and boys are represented by the solid bars.
Children who had been at risk for overweight or overweight (i.e., BMI ≥ 85th percentile for age and gender) at the first childhood visit were very likely to be overweight as young adults. Only 26 of the 103 children who were at risk for or overweight at their first childhood visit were in the healthy weight range (i.e., 18.5 ≤ BMI < 25) as young adults. In addition, children who were between the 50th and 84th percentiles of BMI for age and gender, the high end of the normal weight status group, in childhood were also at elevated risk of becoming overweight or obese. Approximately 13% of the children who had BMI less than the 50th percentile for their age and gender at their first childhood visit became overweight or obese by the time of the adult visit, in contrast with 33% percent of children with BMI between the 50th and 74th percentiles. The contrast was relatively stronger among the female subjects (4% of those <50th percentile vs. 14% of those between the 50th and 74th percentiles) than the male subjects (26% of those <50th percentile vs. 58% of those between the 50th and 74th percentiles). The relationship remained strong after adjustment for age and length of follow-up and exclusion of participants who had a BMI ≥ 25 kg/m2 at their first childhood visit. For example, for girls whose BMI was between the 50th and 74th percentiles in childhood, the odds were approximately five times greater [odds ratio (OR)1 = 4.8, 95% confidence interval (CI) 0.9 to 26.6], and for girls between the 75th and 84th percentiles for BMI their odds were >20 times greater (OR = 20.2, 95% CI 3.4 to 121.6) than their leaner peers of becoming overweight or obese as young adults (Table 2). Independently of their baseline BMI or BMI percentile, gains in BMI or BMI percentile during the childhood period of the study were predictive of becoming overweight or obese. In models assessing the impact of gain in BMI, both baseline BMI and change in BMI during childhood were independently associated with the risk of becoming overweight or obese (data not shown).
Table 2.
Childhood BMI metrics as predictors (odds ratios and 95% confidence intervals* for a one-unit or one-category increase in the BMI metric) from a logistic regression analysis of becoming overweight in early adulthood among 269 young people in the East Boston Blood Pressure Study
| Cases | Male subjects (n = 120) | Female subjects (n = 149) | |
|---|---|---|---|
| BMI (kg/m2) | 93 of 269 | 1.5 (1.3 to 1.8) | 1.7 (1.4 to 2.1) |
| Age and gender-specific z score of BMI† | 93 of 269 | 3.5 (2.0 to 6.1) | 6.8 (3.1 to 15.0) |
| Age and gender-specific percentile of BMI | |||
| <50th percentile | 14 of 104 | 1.0 (referent) | 1.0 (referent) |
| 50th to 74th percentile | 24 of 73 | 5.3 (1.9 to 14.9) | 4.8 (0.9 to 26.6) |
| 75th to 84th percentile | 15 of 34 | 4.3 (1.2 to 15.1) | 20.2 (3.4 to 121.6) |
| ≥85th percentile | 40 of 58 | 13.2 (3.9 to 45.0) | 48.2 (9.4 to 247.7) |
Controlling for age, age2, and length of follow-up.
Per 1 z score increase
There was a strong positive association between childhood and adult BMI. For example, whereas girls whose BMI was between the 50th and 74th percentiles in childhood had a BMI in young adulthood that was ~2 kg/m2 greater than the children whose BMI had been less than or equal to the 50th percentile in childhood, girls between the 75th and 84th had a 3 kg/m2 increment, and those at or above the 85th percentile had a 6 kg/m2 increment (Table 3). A similar relationship was seen among the boys (Table 3). The relationship between BMI in childhood and adult BMI was similar for children 12 to 15 years old at baseline and those who were 8 to 11 years old (Table 3).
Table 3.
Childhood BMI metrics as predictors (β* and SE) of BMI at the young adulthood visit from linear regression analysis among 314 young people in the East Boston Blood Pressure Study
| Gender† |
Age at baseline‡ |
|||
|---|---|---|---|---|
| Male subjects (n = 139) | Female subjects (n = 175) | 8 to 11 years (n = 161) | 12 to 15 years (n = 153) | |
| BMI (kg/m5) | 0.7 (0.1) | 0.7 (0.1) | 0.7 (0.1) | 0.7 (0.1) |
| Age and gender-specific z score of BMI | 2.2 (0.2) | 2.5 (0.3) | 2.2 (0.3) | 2.6 (0.3) |
| Age and gender-specific percentile of BMI | ||||
| <50th percentile | 0.0 (referent) | 0.0 (referent) | 0.0 (referent) | 0.0 (referent) |
| 50th to 74th percentile | 2.2 (0.7) | 2.0 (0.8) | 2.4 (0.8) | 1.9 (0.7) |
| 75th to 84th percentile | 2.6 (0.9) | 3.3 (1.1) | 2.7 (1.1) | 3.3 (0.9) |
| ≥85th percentile | 5.6 (0.7) | 6.2 (0.7) | 5.7 (0.7) | 6.4 (0.7) |
Estimates are increments of young adult BMI for a one-unit or one-category increase in the predictor.
Analyses controlled for age, age2, and length of follow-up (i.e., time between first childhood visit and young adult visit).
Analyses controlled for age, gender, and length of follow-up (i.e., time between first childhood visit and young adult visit).
Accompanying their lower prevalence and incidence of overweight and obesity at the young adult visit, female subjects also had lower mean systolic (by 12.3 mm Hg) and diastolic (by 5.4 mm Hg) blood pressures than the male subjects. Childhood BMI was predictive of blood pressure in young adulthood among the male subjects, but the relationship was stronger for systolic than diastolic blood pressure. In linear regression models adjusted for age at the first childhood visit and length of follow-up, among the male but not the female subjects, childhood BMI and age- and gender-specific percentiles and z scores of childhood BMI were directly associated with adult systolic blood pressure (0.5 mm Hg per BMI unit and 1.7 mm Hg per age-specific z score). The inclusion of baseline height in the model reduced the effect of relative weight, so that it was no longer a significant predictor of systolic blood pressure among the male or female subjects. In models assessing the impact of change in BMI, neither baseline BMI nor change in BMI during childhood was independently associated with systolic pressure at the young adult visit (data not shown).
Due to the paucity of cases of hypertension among the female subjects, analyses assessing predictors of becoming hypertensive were restricted to the male subjects. Age-specific z score of childhood BMI (OR = 2.2, 95% CI 1.2 to 3.9) or BMI itself (OR = 1.1, 95% CI 1.0 to 1.3) predicted development of hypertension in young adulthood. Adjustment for height and baseline systolic and/or diastolic blood pressure did not materially affect the results (data not shown). None of the male subjects below the 50th percentile for BMI developed hypertension; thus, the referent group was male subjects with a BMI less than 75th percentile for BMI at their first childhood visit. Those who were between the 75th and 84th percentiles of BMI in childhood were approximately three times more likely (OR = 3.6, 95% CI 0.7 to 18.2) and those who were at or above the 85th percentile were five times more likely (OR = 5.1, 95% CI 1.4 to 18.1) than male subjects below the 75th percentile to become hypertensive by the young adulthood visit. When the model was further adjusted for whether the participant was overweight at the young adult visit, the point estimates were identical, but the CIs became slightly wider (data not shown).
Discussion
Among an urban sample of young people, weight status at the first childhood visit was strongly predictive of becoming overweight or obese. Not only were children already in the categories of overweight or at risk for overweight (≥85th percentile of BMI) at increased risk, but also children in the upper part of the normal or healthy weight range (i.e., children between the 50th and 84th percentiles of BMI for age and gender) were at increased risk for becoming overweight or obese adults. This finding highlights the need for interventions aimed at a broader audience than children who are already overweight.
Although other researchers have found that being overweight in childhood or adolescence is a strong predictor of being overweight in adulthood, few studies have looked at the risk of becoming overweight or hypertensive by strata of childhood weights that are grouped more finely than overweight vs. not overweight (12,13). However, among 2617 participants in the Bogalusa Heart Study, Freedman et al. (13) observed that children in the 50th to 74th percentile were more likely than those with a BMI below the 50th percentile in childhood to become overweight or obese adults and that the percentage of children who were overweight or obese in adulthood increased with increasing BMI percentile in childhood. Thus, our results are consistent with their findings. Because they did not provide information on the relationship between childhood BMI and the development of hypertension, we cannot compare blood pressure findings. Lauer et al. (14) observed that among 2445 young people, the correlations between childhood and young adulthood BMI ranged from 0.45 to 0.74. Unfortunately, unlike Freedman et al. (13), no information was presented on tracking within categories of baseline BMI (e.g., underweight, normal weight, and overweight); therefore, we are unable to compare our results more fully. Magarey et al. (15) assessed the tracking of overweight or obesity during childhood and adolescence. They observed that children who were overweight at age 11 or 15 were approximately four times more likely than their leaner peers to be overweight or obese at age 20. No information was presented on the gradient of risk within the acceptable (i.e., not overweight or obese) group, thus precluding comparisons with our results. Our estimates of the risk of an overweight youth being overweight as a young adult are stronger than those observed by Whitaker et al. (6). The discrepancy is probably a reflection of our restricting the comparison group to children with an age- and gender-specific percentile of BMI less than the 50th percentile instead of less than the 85th percentile. The inclusion of children between the 50th and 84th percentiles in the referent would dilute the magnitude of the effect due to mixing of their increased risk with the much lower risk among leaner participants. Although Kvaaik et al. (12) assessed the prospective association of four categories of BMI (quintiles) with weight status at 33 years old among a sample of 485 Norwegians, it is difficult to compare the two studies because the Norwegian sample was very lean, and the top quintile, which contained individuals from approximately the 60th or 65th percentile for age according to the U.S. guidelines, was used as the reference group. Nevertheless, both our study and Kvaaik’s have observed that adolescent weight status was a strong predictor of weight status in young adulthood.
In the Muscatine study, Lauer and Clarke (14) observed that both BMI in childhood and change in BMI were correlated with blood pressure and BMI in adulthood. Similarly, Srinivasan et al. (7) observed that in a biracial sample of 783 people, initially 13 to 17 years old and then followed up when they were 27 to 31 years old, those who had been overweight as adolescents were significantly more likely to report hypertension and high cholesterol as young adults. Similar to our findings, Srinivasan et al. (7) found that male subjects were more likely than female subjects to develop elevated systolic blood pressure and that overweight youth were approximately four times more likely than children with a BMI between the 25th and 50th percentiles to develop elevated systolic blood pressure. In addition, they observed a significant, but weaker, association between overweight and elevated diastolic blood pressure. Our findings extend those of Srinivasan et al. (7) by showing that boys in the upper end of the normal weight range have increased risk of developing hypertension as young adults. We did not observe an association with diastolic blood pressure, but our sample size was smaller. Moreover, diastolic blood pressure in children is subject to more within-person variability than is systolic blood pressure (16).
Because of our relatively small sample size, we could not conduct analyses stratified simultaneously by multiple factors, such as age, gender, and baseline weight status. Although female subjects with a BMI between the 75th and 84th percentiles and female subjects at or above the 85th percentile of BMI appeared to be a higher risk than male subjects in the same BMI category of becoming overweight by young adulthood, it is possible that the higher point estimates are a function of the paucity of cases among the female subjects. In addition, we lacked measurements during the intervening years between early adolescence and young adulthood. Although BMI and age- and gender-specific percentile of BMI are widely used as proxy measures of weight status and body fatness, it is important to remember that highly active people who have substantial muscle mass may weigh slightly more than the standard for their height despite low body fat. Thus, people may be overweight but not overfat, although the correlation among BMI, BMI percentiles, and body fat is very high (17–19). BMI is not a direct measure of body fatness; therefore, there will be some misclassification when weight status is based on BMI alone because it does not take into account lean body mass. Despite these limitations, there are many strengths to the current study, including very well-characterized height, weight, and blood pressure measurements on each individual. Our observation that excessive weight in boys predicted elevated blood pressure in early adulthood is consistent with the findings of Must et al. (20) that male, but not female, subjects who had been overweight as adolescents were two times more likely than leaner male subjects to die of coronary heart disease and 13 times more likely to die of atherosclerotic cerebrovascular disease.
The findings of our study underscore the potential seriousness of the increasing prevalence of pediatric obesity in the United States. Although very lean children are unlikely to become overweight adults, we observed that children in the upper end of the healthy weight range (e.g., 50th to 84th percentiles) are at an elevated risk of becoming overweight or obese. Furthermore, boys in the upper end of the healthy weight range are at an increased risk of becoming hypertensive. These findings suggest that future interventions to prevent adult obesity and its complications should include not only overweight children but also children and adolescents as low as the 50th percentile of BMI for age and gender.
Acknowledgments
We thank the men and women who participated in the East Boston Blood Pressure Study, and Denis A. Evans, James O. Taylor, Bernard Rosner, and Charles H. Hennekens for their invaluable input on designing and conducting the East Boston Blood Pressure Study. In addition, the technical and programming assistance of Martin Vandenburgh was invaluable. A.E.F. was partially supported by Boston Obesity Nutrition Research Center Grant DK 46200, and this research was also supported by NIH Grant HL 68041.
Footnotes
Nonstandard abbreviations: OR, odds ratio; CI, confidence interval.
References
- 1.Ogden CL, Flegal KM, Carroll MD, Johnson CL. Prevalence and trends in overweight among US children and adolescents, 1999–2000. JAMA. 2002;288:1728–32. doi: 10.1001/jama.288.14.1728. [DOI] [PubMed] [Google Scholar]
- 2.Lewis CE, Smith DE, Wallace DD, Williams OD, Bild DE, Jacobs DR., Jr Seven-year trends in body weight and associations with lifestyle and behavioral characteristics in black and white young adults: the CARDIA study. Am J Public Health. 1997;87:635–42. doi: 10.2105/ajph.87.4.635. [DOI] [PMC free article] [PubMed] [Google Scholar]
- 3.Guo SS, Roche AF, Chumlea WC, Gardner JD, Siervogel RM. The predictive value of childhood body mass index values for overweight at age 35 y. Am J Clin Nutr. 1994;59:810–9. doi: 10.1093/ajcn/59.4.810. [DOI] [PubMed] [Google Scholar]
- 4.Williams S. Overweight at age 21: the association with body mass index in childhood and adolescence and parents’ body mass index: a cohort study of New Zealanders born in 1972–1973. Int J Obes Relat Metab Disord. 2001;25:158–63. doi: 10.1038/sj.ijo.0801512. [DOI] [PubMed] [Google Scholar]
- 5.Serdula MK, Ivery D, Coates RJ, Freedman DS, Williamson DF, Byers T. Do obese children become obese adults? A review of the literature. Prev Med. 1993;22:167–77. doi: 10.1006/pmed.1993.1014. [DOI] [PubMed] [Google Scholar]
- 6.Whitaker RC, Wright JA, Pepe MS, Seidel KD, Dietz WH. Predicting obesity in young adulthood from childhood and parental obesity. N Engl J Med. 1997;337:869–73. doi: 10.1056/NEJM199709253371301. [DOI] [PubMed] [Google Scholar]
- 7.Srinivasan SR, Bao W, Wattigney WA, Berenson GS. Adolescent overweight is associated with adult overweight and related multiple cardiovascular risk factors: the Bogalusa Heart Study. Metabolism. 1996;45:235–40. doi: 10.1016/s0026-0495(96)90060-8. [DOI] [PubMed] [Google Scholar]
- 8.Gillman MW, Cook NR, Rosner B, et al. Identifying children at high risk for the development of essential hypertension. J Pediatr. 1993;122:837–46. doi: 10.1016/s0022-3476(09)90005-1. [DOI] [PubMed] [Google Scholar]
- 9.Rosner B, Cook NR, Evans DA, et al. Reproducibility and predictive values of routine blood pressure measurements in children: comparison with adult values and implications for screening children for elevated blood pressure. Am J Epidemiol. 1987;126:1115–25. doi: 10.1093/oxfordjournals.aje.a114750. [DOI] [PubMed] [Google Scholar]
- 10. [accessed July 30, 2001];2000 CDC Growth Charts: United States. http://www.cdc.gov/growthcharts/
- 11.Dietary, Guideline, Advisory, Committee. Report of the Dietary Advisory Committee on the Dietary Guidelines for Americans. Washington, DC: Secretary of Health and Human Services and the Secretary of Agriculture; 1995. [Google Scholar]
- 12.Kvaavik E, Tell GS, Klepp KI. Predictors and tracking of body mass index from adolescence into adulthood: follow-up of 18 to 20 years in the Oslo Youth Study. Arch Pediatr Adolesc Med. 2003;157:1212–8. doi: 10.1001/archpedi.157.12.1212. [DOI] [PubMed] [Google Scholar]
- 13.Freedman DS, Khan LK, Dietz WH, Srinivasan SR, Berenson GS. Relationship of childhood obesity to coronary heart disease risk factors in adulthood: the Bogalusa Heart Study. Pediatrics. 2001;108:712–8. doi: 10.1542/peds.108.3.712. [DOI] [PubMed] [Google Scholar]
- 14.Lauer RM, Clarke WR. Childhood risk factors for high adult blood pressure: the Muscatine Study. Pediatrics. 1989;84:633–41. [PubMed] [Google Scholar]
- 15.Magarey AM, Daniels LA, Boulton TJ, Cockington RA. Predicting obesity in early adulthood from childhood and parental obesity. Int J Obes Relat Metab Disord. 2003;27:505–13. doi: 10.1038/sj.ijo.0802251. [DOI] [PubMed] [Google Scholar]
- 16.Gillman MW, Cook NR. Blood pressure measurement in childhood epidemiological studies. Circulation. 1995;92:1049–57. doi: 10.1161/01.cir.92.4.1049. [DOI] [PubMed] [Google Scholar]
- 17.Field AE, Laird N, Steinberg E, Fallon E, Semega-Janneh M, Yanovski JA. Which metric of relative weight best captures body fatness in children? Obes Res. 2003;11:1345–52. doi: 10.1038/oby.2003.182. [DOI] [PubMed] [Google Scholar]
- 18.Daniels SR, Khoury PR, Morrison JA. The utility of body mass index as a measure of body fatness in children and adolescents: differences by race and gender. Pediatrics. 1997;99:804–7. doi: 10.1542/peds.99.6.804. [DOI] [PubMed] [Google Scholar]
- 19.Goulding A, Gold E, Cannan R, Taylor RW, Williams S, Lewis-Barned NJ. DEXA supports the use of BMI as a measure of fatness in young girls. Int J Obes Relat Metab Disord. 1996;20:1014–21. [PubMed] [Google Scholar]
- 20.Must A, Jacques PF, Dallal GE, Bajema CJ, Dietz WH. Long-term morbidity and mortality of overweight adolescents: a follow-up of the Harvard Growth Study of 1922 to 1935. N Engl J Med. 1992;327:1350–5. doi: 10.1056/NEJM199211053271904. [DOI] [PubMed] [Google Scholar]