

Abstract
We have used multifrequency electron paramagnetic resonance to define the multistate structural dynamics of an integral membrane protein, phospholamban (PLB), in a lipid bilayer. PLB is a key regulator of cardiac calcium transport, and its function requires transitions between distinct states of intramolecular dynamics. Monomeric PLB was synthesized with the TOAC spin label at positions 11 (in the cytoplasmic domain) and 46 (in the transmembrane domain) and reconstituted into lipid bilayers. Unlike other protein spin labels, TOAC reports directly the motion of the peptide backbone, so quantitative analysis of its dynamics is worthwhile. Electron paramagnetic resonance spectra at 9.4 GHz (X-band) and 94 GHz (W-band) were analyzed in terms of anisotropic rotational diffusion of the two domains. Motion of the transmembrane domain is highly restricted, while the cytoplasmic domain exhibits two distinct conformations, a major one with moderately restricted nanosecond dynamics (T) and another with nearly unrestricted subnanosecond motion (R). The global analysis of spectra at two frequencies yielded values for the rotational correlation times and order parameters that were much more precisely determined than at either frequency alone. Multifrequency EPR is a powerful approach for analysis of complex rotational dynamics of proteins.
INTRODUCTION
There is a developing consensus that protein internal dynamics is crucial to biological function, especially in regulatory processes in membranes, and that further exploration of this field requires improved experimental and computational tools (1,2). A well-documented example of functional dynamics is provided by phospholamban (PLB), a 52-amino-acid amphipathic integral membrane protein that regulates the active transport of calcium in the heart. In the cardiac sarcoplasmic reticulum membrane, PLB is in a dynamic equilibrium between monomeric and pentameric forms (3), but it is probably the monomeric form that interacts with and regulates the cardiac sarcoplasmic reticulum Ca-ATPase (SERCA) (4,5). Therefore, most recent structural and functional studies of PLB have focused on a fully functional monomeric mutant of PLB, AFA-PLB. The NMR structure of monomeric PLB in detergent micelles (PDB 1N7L) (6) reveals a predominant L-shaped conformation (Fig. 1, left) with two approximately perpendicular helices, cytoplasmic (residues 1–16) and transmembrane (residues 21–52), connected by a flexible hinge. The cytoplasmic domain of PLB is much more dynamic than the transmembrane domain, as shown by NMR in micelles (6,7) and electron paramagnetic resonance (EPR) in membranes (8,9).
FIGURE 1.

Two-state model for PLB structural dynamics in a membrane (9), showing the locations of the spin-labeled TOAC amino acid used in this study (11 and 46). Dashed lines indicate the membrane surface. PLB domains: cytoplasmic (Ia), transmembrane (II), and the hinge (Ib) between them. T is the predominant and well-ordered L-shaped structure in which the cytoplasmic domain is in contact with the membrane surface. R is a less-populated state in which the transmembrane domain remains ordered (indicated by blue) but the cytoplasmic domain is dynamically disordered (indicated by green and yellow and partial unfolding) and extends above the bilayer, poised to interact with the SERCA cytoplasmic domain.
PLB's tertiary structure and dynamics in the membrane are important for the functional interaction of PLB with SERCA. According to solid-state NMR (10,11) and EPR (8,12), PLB's predominant conformation in the membrane has the transmembrane domain approximately perpendicular to the membrane and the cytoplasmic domain lying along the membrane surface and interacting with lipid headgroups (Fig. 1, left). However, cross-linking (13) and functional mutagenesis (14) data suggest that the cytoplasmic domain of PLB extends well above the membrane surface when it interacts with SERCA, as shown directly by EPR of spin-labeled PLB (12), so most models of the PLB-SERCA complex show PLB straightened almost linearly on the surface of SERCA, with the entire molecule, including the cytoplasmic domain, nearly perpendicular to the membrane surface (8,9,15–17). How does PLB undergo this dramatic structural transformation when it interacts with SERCA?
An important clue comes from EPR spectra of membrane-bound monomeric PLB, spin-labeled with 2,2,6,6-tetramethyl-piperidine-n-oxyl-4-amino-4-carboxylic acid (TOAC), a paramagnetic amino acid that reports directly the dynamics of the peptide backbone (8). When TOAC is inserted into the transmembrane domain of PLB, the spin label is strongly immobilized, consistent with a well-ordered α-helix. In contrast, in the cytoplasmic domain, three different TOAC-labeled sites in the cytoplasmic domain show clear evidence for two resolved conformations, one a well-ordered helix (the T conformation, Fig. 1, left), and the other dynamically disordered on the nanosecond timescale (the R conformation, Fig. 1, right). It is this disordered R conformation that binds preferentially to SERCA (9,17) and is enhanced by phosphorylation of PLB (9), resulting in SERCA activation, so it is crucial to characterize the dynamics of these two conformations in detail. That is the goal of this article.
EPR is sensitive to rotational motion with correlation times from picoseconds to milliseconds and can resolve multiple conformations, which makes this method ideal for the detection of internal motions of protein domains (2,18), especially when employing the TOAC spin label (8). Recent computational advances make it possible to determine both the rotational correlation time and order parameter of a spin label's rotational dynamics (19). In this study, we determine both of these parameters for both domains of PLB in both of the two distinct conformational states. We show below that multifrequency EPR at X- and W-bands provides the extra dimension of sensitivity and resolution to determine unambiguously the internal dynamics of PLB's domains in its native membrane environment.
METHODS
PLB synthesis, characterization, and membrane reconstitution
Monomeric AFA-PLB was synthesized as described previously (8,20) with the TOAC spin label attached either at position 46 in the transmembrane domain (46-TOAC-AFA-PLB) or at position 11 in the cytoplasmic domain (11-TOAC-AFA-PLB) (Fig. 1). This spin-labeled PLB was found to be fully functional in its inhibitory effects on SERCA (8). Spectra in this article were obtained from PLB reconstituted into lipid vesicles containing DOPC/DOPE (Avanti Polar Lipids, Alabaster, AL; 4:1, 200 lipids per PLB) in 25 mM imidazole at pH 7.0 (8,12).
Electron paramagnetic resonance
EPR spectra were acquired with model No. E500 (Bruker AXS, Madison, WI; X-band, 9.4 GHz) and E680 (W-band, 94 GHz) EleXsys spectrometers. At X-band, a SHQ cavity with a variable temperature accessory was used; the 30 μL sample was contained in a glass capillary (Wiretrol 25, Drummond Scientific, Broomall, PA; ID = 0.86 mm) sealed with Critoseal, Oxford Labware, St. Louis, MO. The scan width was 120 G, the peak-to-peak modulation amplitude was 1 G, and the modulation frequency was 100 kHz. Spectra were recorded below saturation, at H1 = 0.05 G, at 4°C or 200°K. At W-band, the standard TE011-mode cylindrical cavity resonator was used with a variable temperature TeraFlex probehead (Bruker); the 0.2 μL sample was contained in a quartz capillary with OD/ID = 0.25/0.15 mm (VitroCom, Mountain Lakes, NJ), flame-sealed and sedimented by low-speed centrifugation. The scan width was 300 G, the peak-to-peak modulation amplitude was 1 G, and the modulation frequency was 100 kHz. Spectra were recorded below saturation, at H1 = 0.045 G, at 4°C or 150°K.
Determination of magnetic tensor values
Values for g and T tensor components were determined by analyzing X- and W-band EPR spectra, acquired at low temperature, of 11-TOAC-AFA-PLB and 46-TOAC-AFA-PLB, reconstituted into membranes. Before lineshape analysis, the phase of the W-band spectrum was adjusted to correct for a slight admixture of dispersion (21). The quadrature spectrum was calculated from a Hilbert transformation of the experimental spectrum (22), and the weighted quadrature spectrum was subtracted from the experimental spectrum until the integrated spectrum displayed a flat baseline. X- and W-band EPR spectra were simulated assuming a random orientational distribution of spin labels (powder spectrum, based on Eq. 3) and fit simultaneously to the experimental spectra by varying all six g and T tensor values and linewidths and performing least-squares minimization, essentially as described previously (23).
Spin-label dynamics determined by EPR simulation and fitting
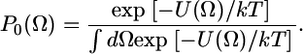
For each resolved spectral component (protein conformation), a rotational correlation time τc and order parameter S was determined from the fitting of simulated and experimental spectra. X- and W-band EPR spectra were simulated using the MOMD (macroscopic order, microscopic disorder) model within the program NLSL (19,24). The restriction of rotational motion is defined in the model by expansion coefficients cLK of spherical harmonics 
 |
(1) |
where U(Ω) is the restoring potential and Ω is a set of angles needed to describe the spin-label orientation relative to the membrane (19). The equilibrium distribution of orientation probability was defined from the restoring potential as (19)
 |
(2) |
In this work, we used only the first term of the series ( ), which is justified as follows: we make the standard assumption that the restoring potential should be symmetric with respect to the membrane normal (local director); this eliminates nonaxial terms such as c22, c42, and c44. The inclusion of higher-order terms with axial symmetry (e.g., c40) (25) did not improve the fit. Under these conditions, P0(Ω) is completely defined by the order parameter S (24,26), so we report S values in this article. In the simulation, rates of rotational motion within P0(Ω) are defined by rotational diffusion coefficients DR; in this study we report these through the rotational correlation times, which we define as τc = 1/(6DR). Thus, rotational dynamics results are reported in this article as S and τc. In the case of anisotropic motion, we define correlation times for unrestricted axial rotation as τc ‖ = 1/(6DR‖), and restricted wobbling rotations as τc ⊥ = 1/(6DR⊥) with a corresponding order parameter S.
To simulate randomly oriented membrane vesicles, spectra were simulated over a uniform grid of orientations of the membrane normal with respect to the magnetic field, then summed to simulate a random orientational distribution in the laboratory frame, with 40 orientations found to be sufficient for convergence. The tilt angle between the diffusion (α-helix) axis and the z axis of the spin label at both sites was set at βd = 21° (27).
The basis set was truncated to improve efficiency, but the truncation parameters were varied to ensure convergence. For 46-TOAC, the maximum quantum numbers for total angular momentum were Lemax = 16, Lomax = 15; the maximum quantum numbers for the z component of angular momentum in the lab and molecular frames, respectively, were Kmax = 10 and Mmax = 10; and the nuclear spin transition index was pl = 2. For R and T components of 11-TOAC, these parameters were {4, 3, 2, 2, 2} and {12, 11, 8, 8, 2}, respectively. The same truncation parameters were used to simulate spectra at X- and W-band.
RESULTS
EPR spectra of frozen samples: magnetic tensor values
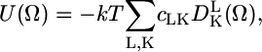
The orientation dependence (anisotropy) of the nitroxide EPR spectrum, in the absence of rotational motion, is defined by
 |
(3) |
where Hres is the magnetic field at resonance, ν is the applied frequency, β is the Bohr magneton, and θ and φ define the orientations of the nitroxide relative to the applied magnetic field (23,28).
The ν-dependent term in Eq. 3 makes the spectrum at W-band much more sensitive to anisotropy than at X-band. To analyze EPR spectra quantitatively in terms of spin label orientation and anisotropic rotational motion, it is necessary to determine accurately the values of (gx, gy, gz) and (Tx, Ty, Tz). These were determined by fitting the spectra of spin-labeled PLB in frozen membrane samples. Fig. 2 shows the fit for the 46-TOAC sample. Components of g and T tensors of 11-TOAC-AFA-PLB and 46-TOAC-AFA-PLB (Table 1) are similar to those previously reported for TOAC (27). The values for the two spin label positions were only slightly different; the smaller value of Tz at position 46 is expected on the basis of its less polar environment.
FIGURE 2.

EPR spectra of 46-TOAC-AFA-PLB in lipid bilayers, at X-band (200°K) and W-band (150°K). (Black) Experiment. (Red) Fit.
TABLE 1.
Magnetic tensors determined from spectra of frozen samples (Fig. 2)
| Label position | gx | gy | gz | Tx (G) | Ty (G) | Tz (G) |
|---|---|---|---|---|---|---|
| 11 | 2.0095 ± 0.0001 | 2.0067 ± 0.0001 | 2.0027 ± 0.00005 | 6.5 ± 0.5 | 6.5 ± 0.5 | 34.7 ± 0.2 |
| 46 | 2.0097 ± 0.0001 | 2.0068 ± 0.0001 | 2.0027 ± 0.00005 | 6.0 ± 0.5 | 6.0 ± 0.5 | 33.4 ± 0.2 |
EPR spectra at 4°C: dynamics parameters constrained by analysis of spectral features at two frequencies
Fig. 3 shows EPR spectra of membrane-reconstituted monomeric PLB labeled with TOAC at positions 11 (top) and 46 (bottom), recorded at X-band (left) and W-band (right). At position 46 in the transmembrane domain, the spectra indicate clearly a single mode of strongly restricted rotational motion. At position 11 in the cytoplasmic domain, there are two distinct components, T (broad spectrum indicating moderate rotational restriction) and R (narrow three-line spectrum indicating fast, nearly unrestricted rotation). Each of these motional components was interpreted initially in terms of a rotational correlation time τc and an order parameter S, as described in Methods. Only motion of PLB with respect to the membrane was analyzed, since the lipid vesicles were large enough that their correlation times are in the μs-ms timescale (29), which is undetectable by conventional EPR at both X-band and W-band.
FIGURE 3.

EPR spectra of TOAC-AFA-PLB, showing features (splittings) used to determine initial values {τc, S} of the T component, for subsequent spectral fitting. X-band, 11: A, 60.2 ± 1.0 G; B, 14.5 ± 1.0 G. W-band, 11: A, 130.2 ± 2.0 G; B, 32.0 ± 2.0 G. X-band, 46: A, 64.1 ± 1.0 G; B, 9.0 ± 1.0 G. W-band, 46: A, 143.1 ± 2.0 G; B, 32.0 ± 2.0 G.
For the spectra of 46-TOAC and for the T component of 11-TOAC, initial values of τc and S were determined by comparing measured features of experimental spectra (Fig. 3) with those obtained from the library of simulated spectra. Features were chosen to maximize sensitivity to the rotational motion of individual components, while minimizing sensitivity to linewidths, which are sensitive to factors other than dynamics.
To obtain initial estimates for the dynamics parameters, libraries of EPR spectra at X-band and W-band were simulated with the program NLSL (19). Separate libraries were simulated for 11-TOAC and 46-TOAC, based on the tensor values of Table 1. For this initial analysis, each spectral component (one for the 46-TOAC label, two for 11-TOAC) was assigned a single correlation time τc and order parameter S, and spectra in the library were simulated for correlation times varying from 0.2 to 400 ns and order parameters varying from 0 to 1. The features defined in Fig. 3 were measured for both simulated and experimental spectra, to determine the range of dynamics parameters (τc and S) that are consistent with the data, assuming tolerances of ±1.0 G for the features at X-band and ±2.0 G for W-band (determined from experiment). Fig. 4 illustrates the results for the T component of the 11-TOAC spectrum and for the single spectral component of 46-TOAC. It is clear that the range of dynamics parameters is much more constrained by combining the analysis at both frequencies, compared with that at either frequency alone, especially for 11-TOAC (Fig. 4, bottom).
FIGURE 4.

Selection of initial parameters {τc, S} for the T component. A library of simulated spectra was analyzed in terms of features determined from experimental spectra (Fig. 3). Each symbol indicates a pair of parameters {τc, S} for which the features of the simulated spectrum were within tolerances ±1.0 G for X-band (solid squares) and ±2.0 G for W-band (open diamonds). The region of overlap defines the range of parameters used in subsequent spectral fits (Fig. 5). (Top) 11-TOAC-AFA-PLB, showing results for the less mobile T conformation. (Bottom) 46-TOAC-AFA-PLB. The set of initial parameters is larger.
The initial values of τc and S for component R of 11-TOAC-AFA-PLB were estimated by a simpler procedure that also relied on spectral simulations at both frequencies. Component R exhibits a narrow three-line EPR spectrum at X-band. Simulations show that this requires that S < 0.2 and τc < 0.8 ns. In contrast, at W-band, component R is not completely averaged to a three-line spectrum. Simulations show that this implies τc > 0.08 ns. Thus for component R, the parameters were restricted to 0.08 ns < τc < 0.8 ns and S < 0.2.
EPR spectra at 4°C: global multifrequency fit
Experimental spectra at X-band and W-band were fitted simultaneously (globally) with the program NLSL (19), with initial values for rotational correlation times and order parameters restricted to the ranges determined in the previous section (Fig. 4). For 46-TOAC, fits were significantly improved (χ2 decreased) by the addition of a second correlation time, corresponding to uniaxial rotational diffusion (about the membrane normal). The justification of this additional component (i.e., its improvement of χ2) was only clear upon global analysis of spectra at both frequencies. For both R and T components of 11-TOAC, a single correlation time and order parameter was sufficient. The results for these fits are given in Table 2. In the case of 46-TOAC, there is slow uniaxial rotation (τc‖ = 105 ns) about the helix axis, which is nearly parallel to the membrane normal (11), and fast restricted wobbling of this axis (τc⊥ = 2.0 ns, S = 0.93) (Table 2). In the case of 11-TOAC, the correlation time of the T component (also corresponding to wobble of the helix axis) was τc⊥ = 3.5 ns, similar to that of 46-TOAC (2.0 ns), but the order parameter for this wobbling motion was significantly less (S = 0.78) (Table 2). The R component was fit quite well by a single fast (τc⊥ = 0.68 ns) and nearly isotropic (S = 0.11) wobbling motion. The mole fraction of the R component was 0.16 ± 0.01. The precision of this determination was significantly enhanced by the global analysis at two frequencies.
TABLE 2.
Dynamics parameters of TOAC-labeled PLB in lipid bilayers
| Uniaxial diffusion
|
Wobble
|
||||
|---|---|---|---|---|---|
| Label position, component | τc‖ (ns) | τc⊥ (ns) | Order parameter, S | Cone angle θc (°) | |
| 46 | 105 ± 7 | 2.0 ± 0.1 | 0.93 ± 0.01 | 18 ± 3 | |
| 11 | T | 3.5 ± 0.3 | 0.78 ± 0.01 | 37 ± 3 | |
| R | 0.68 ± 0.02 | 0.11 ± 0.01 | 79 ± 6 | ||
Parameters were determined from global fits of spectra at X- and W-band. The model for 11-TOAC included two components, T and R. The mole fraction of component R was xR = 0.16 ± 0.01.
DISCUSSION
Multifrequency approach
The use of two microwave frequencies, differing by an order of magnitude, made it possible to determine unambiguously the order parameters and correlation times for each spin-labeled site in each conformational state of PLB, and to determine the mole fractions of the R and T components. However, this was not accomplished in a single step. Initially, we tried simultaneous global simulation and least-squares analysis of the spectra at two frequencies and were not able to arrive at satisfactory and unambiguous fits that were independent of initial parameters. We found that the initial analysis of spectral features at both frequencies, using a simulated spectral library, was crucial in narrowing the range of dynamics parameters for subsequent least-squares fitting analysis. Fig. 4 illustrates that this feature analysis at a single frequency is quite ambiguous, giving a wide range of values {τc, S} that are formally consistent with the observed spectral features. However, simultaneous analysis of the data at two frequencies resulted in substantial narrowing of the range of possible dynamics parameters (Fig. 4). Once the range of these initial parameters was reduced in this manner, subsequent least-squares minimization produced reliable and unambiguous results. In the global two-frequency fit, the correlation coefficients between τc and S were 0.54 and 0.56 for R and T components, respectively, of 11-TOAC-AFA-PLB, and 0.52 for 46-TOAC-AFA-PLB. This coefficient was usually higher in a single-frequency fit (0.63, 0.74, and 0.61, respectively), indicating more ambiguity in the determination of τc and S. Although other fitting methods could be employed (e.g., (30)), this approach is the most direct one that could be easily extended to more sophisticated dynamics models involving more fitting parameters.
The multifrequency approach provided a greater advantage for the cytoplasmic domain probe at position 11 (Fig. 4, top) than for the transmembrane domain probe at position 46 (Fig. 4, bottom). Inspection of the spectral library reveals the basis of this finding: the differential sensitivity to dynamics at the two frequencies is greater when the order parameter S is lower and the spectral lineshape depends more on the rotational correlation time τc. Similarly, EPR at 9 GHz and 250 GHz has been used to distinguish between local and global dynamics within a spin-labeled protein (31).
Influence of errors in g and T tensor values on the results
The precision of g and T tensor values affects the fit of experimental spectra, and thus the precision of determining dynamics parameters. The increased resolution at W-band was essential in determining tensor values precisely. Tensor components were determined from the simultaneous (global) fit of X-band and W-band spectra obtained at low temperature. We found that this simultaneous fit reduces the error of Tz determination, compared with the fit of the W-band spectrum alone, but other g and T tensor values were not affected by including the X-band analysis. The influence of the error of g and T tensor values (Table 1) on the rotational correlation time and the order parameter are reflected as tolerances in Table 2.
Dynamics of PLB domains
Because the TOAC spin label is rigidly attached to the peptide backbone (27,32,33), it is justified to undertake a detailed analysis of its rotational dynamics, since this should reflect directly the dynamics of the domains of PLB. After initial parameters were constrained by the two-frequency analysis of spectral features (Fig. 4), the detailed least-squares analysis, conducted simultaneously (globally) at X- and W-band, gave unambiguous fits to the spectra at both frequencies (Fig. 5, Table 2). For 11-TOAC-AFA-PLB, we found that the two-frequency spectral fit gave consistent results only if the initial parameters {τc, S} were taken from the selected area of Fig. 4 (top). When initial parameters were chosen outside the selected area, results were more variable and often gave larger χ2 values. For 46-TOAC-AFA-PLB a larger range of {τc, S} values was obtained from Fig. 4, but this was adequate, since the same final result was obtained as long as the initial τc was > 1.4 ns.
FIGURE 5.

Spectral fits to determine parameters of PLB rotational dynamics. (Black) Experimental EPR spectra. (Red) Best fits. (Left) X-band. (Right) W-band. (Top) 11-TOAC. (Bottom) 46-TOAC. Magnetic tensor parameters were input from Table 1. The dynamics parameters resulting from the fits are given in Table 2. Lorentzian linewidths resulting from the fits: 11-TOAC R component, 1.4 G; 11-TOAC T component, 2.6 G; 46-TOAC, 4.7 G.
The results are consistent with the previously proposed structural model of PLB, consisting of two helical domains connected by a flexible loop (6,7) with the cytoplasmic domain exhibiting more dynamics and two distinct conformational states (8,17). Our results (Table 2) add considerable detail to this model: the transmembrane domain rotates slowly (τcII = 105 ns) around the helix axis and performs a rapid (τc⊥ = 2 ns) but restricted (S = 0.93, corresponding to an angular amplitude of ∼18°) wobbling motion perpendicular to this axis in the membrane. The axial correlation time of 105 ns is slightly greater than the 88 ns value predicted for a transmembrane α-helical protein (r = 0.5 nm) in a DOPC membrane (thickness 3.4 nm (34) and viscosity 1.87 P (35)) at 4°C (36). Data for gramicidin A in a DMPC membrane at 2°C show a similar result, τc = 83 ns (25). The longer observed correlation time in PLB is probably due to the friction caused by the previously demonstrated interaction of the cytoplasmic domain with the membrane surface (8,17). The restricted wobbling motion of the PLB transmembrane helix is remarkably rapid. The correlation time (τc⊥ = 2 ns) is two orders-of-magnitude smaller than predicted theoretically for the isotropic tumbling of a helix in such a viscous lipid environment (36), which suggests that the effective microviscosity for small-amplitude wobble of a transmembrane helix is much less than the bulk viscosity of the hydrocarbon phase.
EPR spectra of the cytoplasmic domain of PLB report two distinct PLB conformations. According to our model, one conformation (T) interacts with the surface of the membrane, slowing its motion and stabilizing its helical conformation; and in another conformation (R), it moves rapidly (τc⊥ = 0.68 ns) and virtually without restriction (S = 0.11, corresponding to an apparent half-cone angle of 79°) (Fig. 6). The 0.68-ns correlation time is in excellent agreement with experimental (32) and theoretical (36) values for a small helical peptide freely rotating in solution. However, it is likely that the attachment of the cytoplasmic helix to the transmembrane helix would slow the motion substantially, relative to that of a freely tumbling peptide. Thus, it is likely that the large rate and amplitude of this rotational motion is due, at least in part, to the partial unfolding of this helix—as suggested previously by both NMR (7) and EPR (8) data and depicted in Fig. 6. Obviously, EPR analysis of additional sites on PLB with TOAC will lead to a more detailed description of PLB dynamics.
FIGURE 6.

Two-state model for PLB structural dynamics in a membrane (9), refined by the results of this study. Dashed lines indicate the membrane surface. The transmembrane domain performs slow uniaxial rotation about the membrane normal and rapid restricted wobbling motion in both PLB conformations. The cytoplasmic domain wobbles rapidly and almost unrestrictedly in the R conformation, probably with partial unfolding of the helix near the spin label at position 11, but its motion is slower and much more restricted in the predominant T conformation.
CONCLUSIONS
This work demonstrates the power of multifrequency EPR, in combination with the TOAC spin label, for defining the rotational dynamics of protein domains. From the analysis of multifrequency (X-band and W-band) EPR spectra of monomeric PLB, labeled in its two domains with TOAC, we have defined the backbone dynamics of PLB in lipid bilayers. We resolve two populations of PLB with different dynamics of the cytoplasmic domain: fast (τc⊥ = 0.68 ns) and nearly unrestricted (S = 0.11, corresponding to a cone angle of 79°), motion in a minor conformation (R state, mole fraction 0.16), and slower and more restricted dynamics, probably due to interaction with the membrane surface, in the major conformation (T state, mole fraction 0.84). The transmembrane domain performs slow axial rotation (τc‖ = 105 ns) and highly restricted wobbling motion (τc⊥ = 2 ns, S = 0.93, corresponding to a cone angle of 18°), the same in both R and T conformations. This two-frequency analysis offered insights that were not obtained at either frequency alone: 1), the presence of both slow uniaxial diffusion and fast wobble of the transmembrane domain; and 2), a much more precise analysis of the T-to-R (order-to-disorder) conformational equilibrium. In particular, the two-frequency analysis permitted a precise determination of the dynamic properties and the mole fraction of the R conformational state of PLB, despite its minor population. Although this dynamically disordered component makes up only approximately one-sixth of the PLB population, it has been shown to be the conformation of PLB that interacts preferentially with the cytoplasmic domain of its regulatory target, the SERCA calcium pump (9,17), and it is this conformation that is enhanced by phosphorylation of PLB at S16, activating the pump (9). This interaction has profound implications for cardiac function, pathology, and therapy (5,37,38).
Acknowledgments
TOAC spin-labeled PLB was synthesized with the excellent assistance of Zhiwen Zhang. We appreciate discussions with Dr. D. Budil (Northeastern University), Dr. Z. Liang, and Dr. J. H. Freed (Cornell University), and Dr. Gianluigi Veglia (University of Minnesota).
This work was supported by National Institutes of Health grants No. AR48961 (Y.E.N.), No. AR32961 (D.D.T.), and No. GM27906 (D.D.T.), and National Science Foundation grant No. MCB 0346650 (P.G.F.). NLSL software was kindly provided by Dr. D. Budil (Northeastern University).
Editor: Eduardo Perozo.
References
- 1.Sachs, J. N., and D. M. Engelman. 2006. Introduction to the membrane protein reviews: the interplay of structure, dynamics, and environment in membrane protein function. Annu. Rev. Biochem. 75:707–712. [DOI] [PubMed] [Google Scholar]
- 2.Columbus, L., and W. L. Hubbell. 2002. A new spin on protein dynamics. Trends Biochem. Sci. 27:288–295. [DOI] [PubMed] [Google Scholar]
- 3.Cornea, R. L., L. R. Jones, J. M. Autry, and D. D. Thomas. 1997. Mutation and phosphorylation change the oligomeric structure of phospholamban in lipid bilayers. Biochemistry. 36:2960–2967. [DOI] [PubMed] [Google Scholar]
- 4.Reddy, L. G., L. R. Jones, and D. D. Thomas. 1999. Depolymerization of phospholamban in the presence of calcium pump: a fluorescence energy transfer study. Biochemistry. 38:3954–3962. [DOI] [PubMed] [Google Scholar]
- 5.MacLennan, D. H., and E. G. Kranias. 2003. Phospholamban: a crucial regulator of cardiac contractility. Nat. Rev. Mol. Cell Biol. 4:566–577. [DOI] [PubMed] [Google Scholar]
- 6.Zamoon, J., A. Mascioni, D. D. Thomas, and G. Veglia. 2003. NMR solution structure and topological orientation of monomeric phospholamban in dodecylphosphocholine micelles. Biophys. J. 85:2589–2598. [DOI] [PMC free article] [PubMed] [Google Scholar]
- 7.Metcalfe, E. E., J. Zamoon, D. D. Thomas, and G. Veglia. 2004. 1H/15N heteronuclear NMR spectroscopy shows four dynamic domains for phospholamban reconstituted in dodecylphosphocholine micelles. Biophys. J. 87:1205–1214. [DOI] [PMC free article] [PubMed] [Google Scholar]
- 8.Karim, C. B., T. L. Kirby, Z. Zhang, Y. Nesmelov, and D. D. Thomas. 2004. Phospholamban structural dynamics in lipid bilayers probed by a spin label rigidly coupled to the peptide backbone. Proc. Natl. Acad. Sci. USA. 101:14437–14442. [DOI] [PMC free article] [PubMed] [Google Scholar]
- 9.Karim, C. B., Z. Zhang, E. C. Howard, K. D. Torgersen, and D. D. Thomas. 2006. Phosphorylation-dependent conformational switch in spin-labeled phospholamban bound to SERCA. J. Mol. Biol. 358:1032–1040. [DOI] [PubMed] [Google Scholar]
- 10.Mascioni, A., C. Karim, J. Zamoon, D. D. Thomas, and G. Veglia. 2002. Solid-state NMR and rigid body molecular dynamics to determine domain orientations of monomeric phospholamban. J. Am. Chem. Soc. 124:9392–9393. [DOI] [PubMed] [Google Scholar]
- 11.Traaseth, N. J., J. J. Buffy, J. Zamoon, and G. Veglia. 2006. Structural dynamics and topology of phospholamban in oriented lipid bilayers using multidimensional solid-state NMR. Biochemistry. 45:13827–13834. [DOI] [PubMed] [Google Scholar]
- 12.Kirby, T. L., C. B. Karim, and D. D. Thomas. 2004. Electron paramagnetic resonance reveals a large-scale conformational change in the cytoplasmic domain of phospholamban upon binding to the sarcoplasmic reticulum Ca-ATPase. Biochemistry. 43:5842–5852. [DOI] [PubMed] [Google Scholar]
- 13.James, P., M. Inui, M. Tada, M. Chiesi, and E. Carafoli. 1989. Nature and site of phospholamban regulation of the Ca2+ pump of sarcoplasmic reticulum. Nature. 342:90–92. [DOI] [PubMed] [Google Scholar]
- 14.Toyofuku, T., K. Kurzydlowski, M. Tada, and D. H. MacLennan. 1994. Amino acids Lys-Asp-Asp-Lys-Pro-Val402 in the Ca2+-ATPase of cardiac sarcoplasmic reticulum are critical for functional association with phospholamban. J. Biol. Chem. 269:22929–22932. [PubMed] [Google Scholar]
- 15.Toyoshima, C., M. Asahi, Y. Sugita, R. Khanna, T. Tsuda, and D. H. MacLennan. 2003. Modeling of the inhibitory interaction of phospholamban with the Ca2+ ATPase. Proc. Natl. Acad. Sci. USA. 100:467–472. [DOI] [PMC free article] [PubMed] [Google Scholar]
- 16.Hutter, M. C., J. Krebs, J. Meiler, C. Griesinger, E. Carafoli, and V. Helms. 2002. A structural model of the complex formed by phospholamban and the calcium pump of sarcoplasmic reticulum obtained by molecular mechanics. ChemBioChem. 3:1200–1208. [DOI] [PubMed] [Google Scholar]
- 17.Zamoon, J., F. Nitu, C. Karim, D. D. Thomas, and G. Veglia. 2005. Mapping the interaction surface of a membrane protein: unveiling the conformational switch of phospholamban in calcium pump regulation. Proc. Natl. Acad. Sci. USA. 102:4747–4752. [DOI] [PMC free article] [PubMed] [Google Scholar]
- 18.Columbus, L., and W. L. Hubbell. 2004. Mapping backbone dynamics in solution with site-directed spin labeling: GCN4–58 bZip free and bound to DNA. Biochemistry. 43:7273–7287. [DOI] [PubMed] [Google Scholar]
- 19.Budil, D., S. Lee, S. Saxena, and J. H. Freed. 1996. Nonlinear-least-squares analysis of slow-motion EPR spectra in one and two dimensions using a modified Levenberg-Marquardt algorithm. J. Magn. Reson. A120:155–189. [Google Scholar]
- 20.Karim, C. B., Z. Zhang, and D. D. Thomas. 2007. Synthesis of TOAC-spin-labeled proteins and reconstitution in lipid membranes. Nature Protocols. 2:43–49. [DOI] [PubMed] [Google Scholar]
- 21.Earle, K. A., D. E. Budil, and J. H. Freed. 1993. 250-GHz EPR of nitroxides in the slow-motional regime: models of rotational diffusion. J. Phys. Chem. 97:13289–13297. [Google Scholar]
- 22.Ernst, R. R. B. G., and A. Wokaun. 1987. Principles of Nuclear Magnetic Resonance in One and Two Dimensions. Oxford University Press, Oxford, UK.
- 23.Fajer, P. G., P. Bennett, C. Polnaszek, E. A. Fajer, and D. D. Thomas. 1990. General method for multiparameter fitting of high-resolution EPR spectra using a simplex algorithm. J. Magnet. Res. 88:111–125. [Google Scholar]
- 24.Schneider, D. J., and J. H. Freed. 1989. Calculating slow motional magnetic resonance spectra: a user's guide. In Biological Magnetic Resonance. L.J. Berliner, Editor. Plenum Publishing, New York.
- 25.Dzikovski, B. G., P. P. Borbat, and J. H. Freed. 2004. Spin-labeled gramicidin A: channel formation and dissociation. Biophys. J. 87:3504–3517. [DOI] [PMC free article] [PubMed] [Google Scholar]
- 26.Lipari, G., and A. Szabo. 1982. Model-free approach to the interpretation of nuclear magnetic resonance relaxation in macromolecules. 1. Theory and range of validity. J. Am. Chem. Soc. 104:4546–4559. [Google Scholar]
- 27.Hanson, P., D. J. Anderson, G. Martinez, G. L. Millhauser, F. Formaggio, M. Crisma, C. Toniolo, and C. Vita. 1998. Electron spin resonance and structural analysis of water soluble, alanine-rich peptides incorporating TOAC. Mol. Phys. 95:957–966. [Google Scholar]
- 28.Libertini, L., and O. Griffith. 1970. Orientation dependence of the electron spin resonance spectrum of di-t-butyl nitroxide. J. Chem. Phys. 53:1359–1367. [Google Scholar]
- 29.Birmachu, W., and D. D. Thomas. 1990. Rotational dynamics of the Ca-ATPase in sarcoplasmic reticulum studied by time-resolved phosphorescence anisotropy. Biochemistry. 29:3904–3914. [DOI] [PubMed] [Google Scholar]
- 30.Khairy, K., D. Budil, and P. Fajer. 2006. Nonlinear-least-squares analysis of slow motional regime EPR spectra. J. Magn. Reson. 183:152–159. [DOI] [PubMed] [Google Scholar]
- 31.Barnes, J. P., Z. Liang, H. S. Mchaourab, J. Freed, and W. L. Hubbell. 1999. A multifrequency electron spin resonance study of T4 lysozyme dynamics. Biophys. J. 76:3298–3306. [DOI] [PMC free article] [PubMed] [Google Scholar]
- 32.Miick, S. M., K. M. Casteel, and G. L. Millhauser. 1993. Experimental molecular dynamics of an alanine-based helical peptide determined by spin label electron spin resonance. Biochemistry. 32:8014–8021. [DOI] [PubMed] [Google Scholar]
- 33.Todd, A. P., and G. L. Millhauser. 1991. ESR spectra reflect local and global mobility in a short spin-labeled peptide throughout the α-helix-coil transition. Biochemistry. 30:5515–5523. [DOI] [PubMed] [Google Scholar]
- 34.Benz, R. W., F. Castro-Roman, D. J. Tobias, and S. H. White. 2005. Experimental validation of molecular dynamics simulations of lipid bilayers: a new approach. Biophys. J. 88:805–817. [DOI] [PMC free article] [PubMed] [Google Scholar]
- 35.Lentz, B. R., Y. Barenholz, and T. E. Thompson. 1976. Fluorescence depolarization studies of phase transitions and fluidity in phospholipid bilayers. 1. Single component phosphatidylcholine liposomes. Biochemistry. 15:4521–4528. [DOI] [PubMed] [Google Scholar]
- 36.Saffman, P. G., and M. Delbruck. 1975. Brownian motion in biological membranes. Proc. Natl. Acad. Sci. USA. 72:3111–3113. [DOI] [PMC free article] [PubMed] [Google Scholar]
- 37.Hoshijima, M., Y. Ikeda, Y. Iwanaga, S. Minamisawa, M. O. Date, Y. Gu, M. Iwatate, M. Li, L. Wang, J. M. Wilson, Y. Wang, J. Ross, Jr., and K. R. Chien. 2002. Chronic suppression of heart-failure progression by a pseudophosphorylated mutant of phospholamban via in vivo cardiac rAAV gene delivery. Nat. Med. 8:864–871. [DOI] [PubMed] [Google Scholar]
- 38.Hoshijima, M., R. Knoll, M. Pashmforoush, and K. R. Chien. 2006. Reversal of calcium cycling defects in advanced heart failure: toward molecular therapy. J. Am. Coll. Cardiol. 48(Suppl 1):A15–A23. [DOI] [PubMed] [Google Scholar]